Recursion App
You can use the Recursion app to work with general terms or two-term or three-term recursion formulas of numeric sequences. It creates a numeric table from a recursion formula and draws a graph. You can also draw a Phase Graph based on two recursion formulas of the same type, or a Web Graph to check the convergence or divergence of two-term recursion formulas.
Operation Flow
Example: To create a numeric table for the three-term recursion formula (Fibonacci sequence) where the first term is and the second term is , and the value of the -variable changes from 1 to 6, and then draw a graph of the numeric table
-
h > Recursion
-
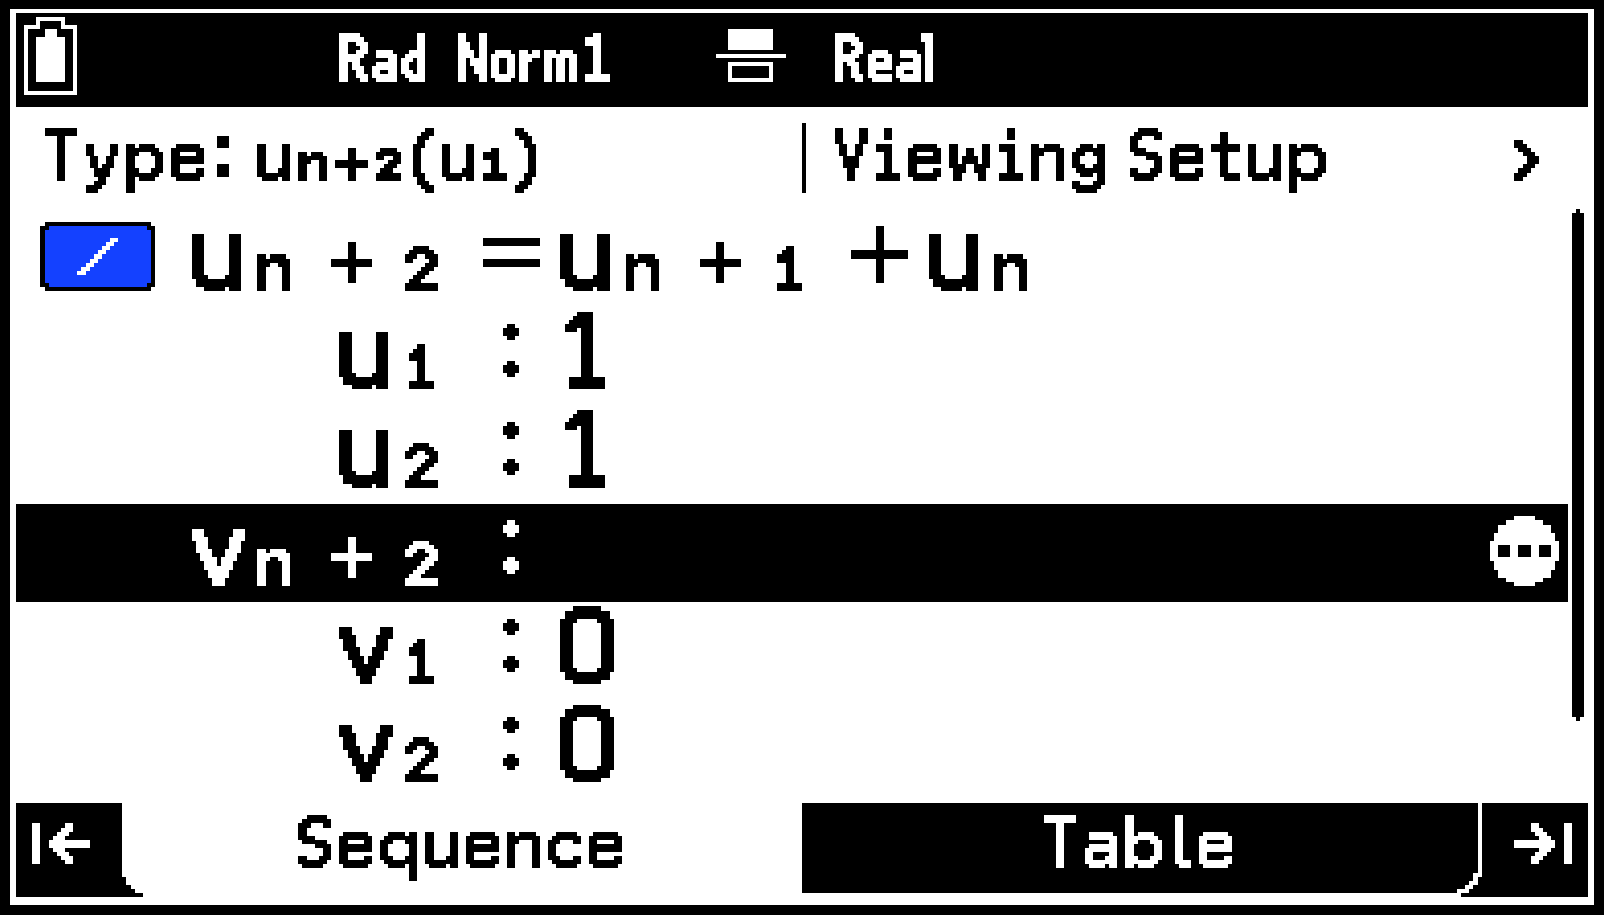
Specify the formula type, first term type and the numeric table domain.
-
On the Sequence tab, press u to highlight the first line.
-
Press O, and then use the Setup menu that appears to configure the settings shown below.
-
On the Sequence tab, input , , .
-
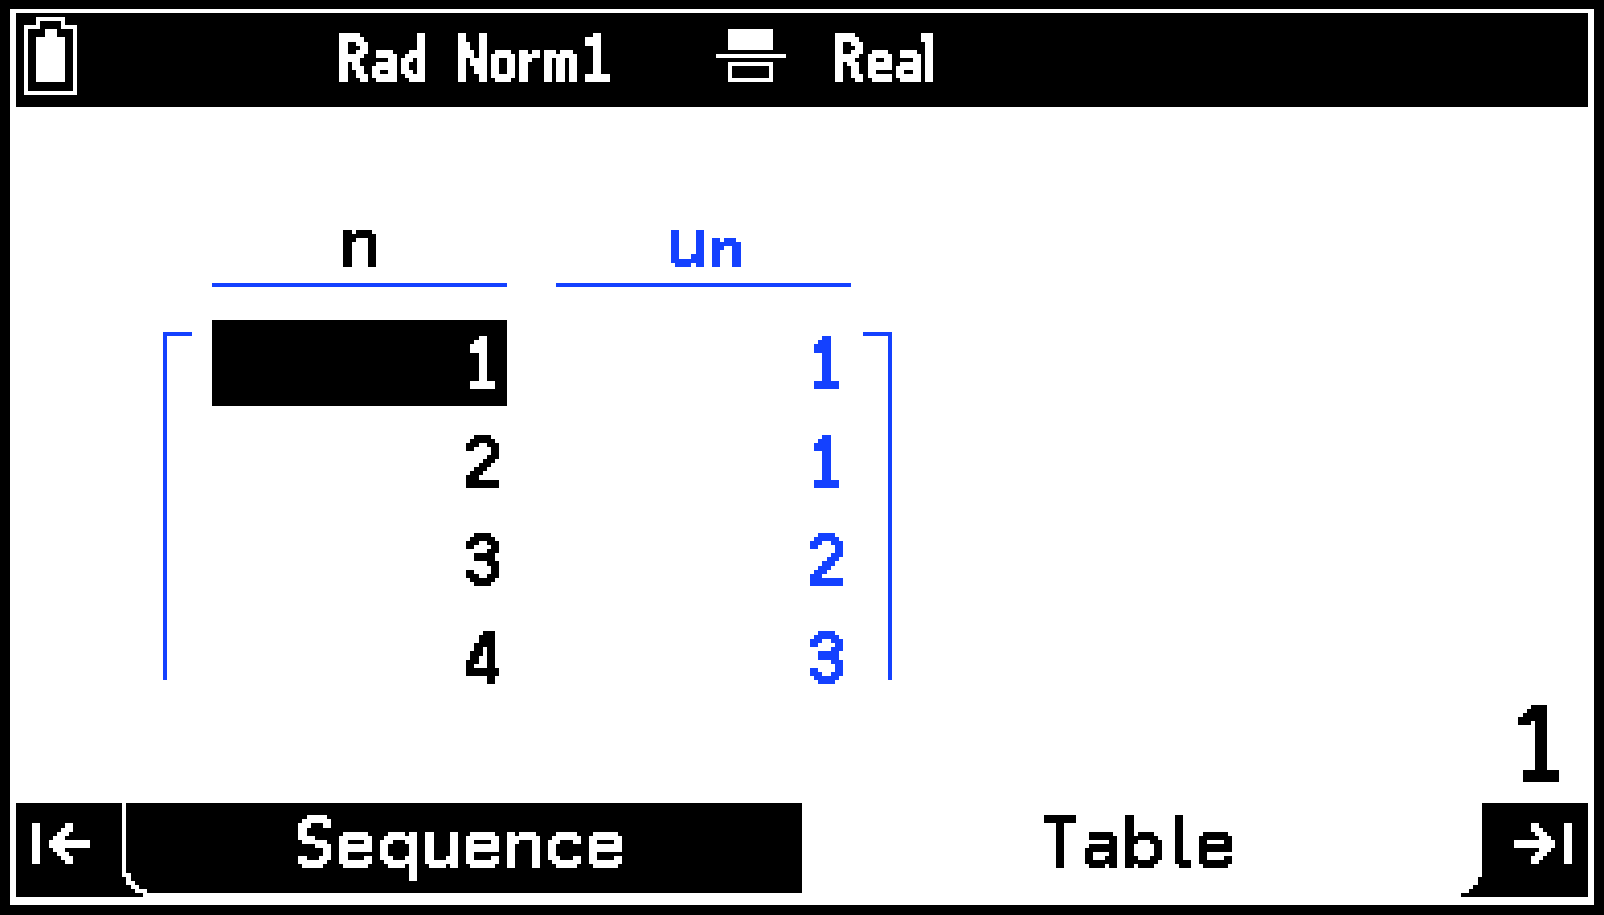
To display the numeric table, press >.
-
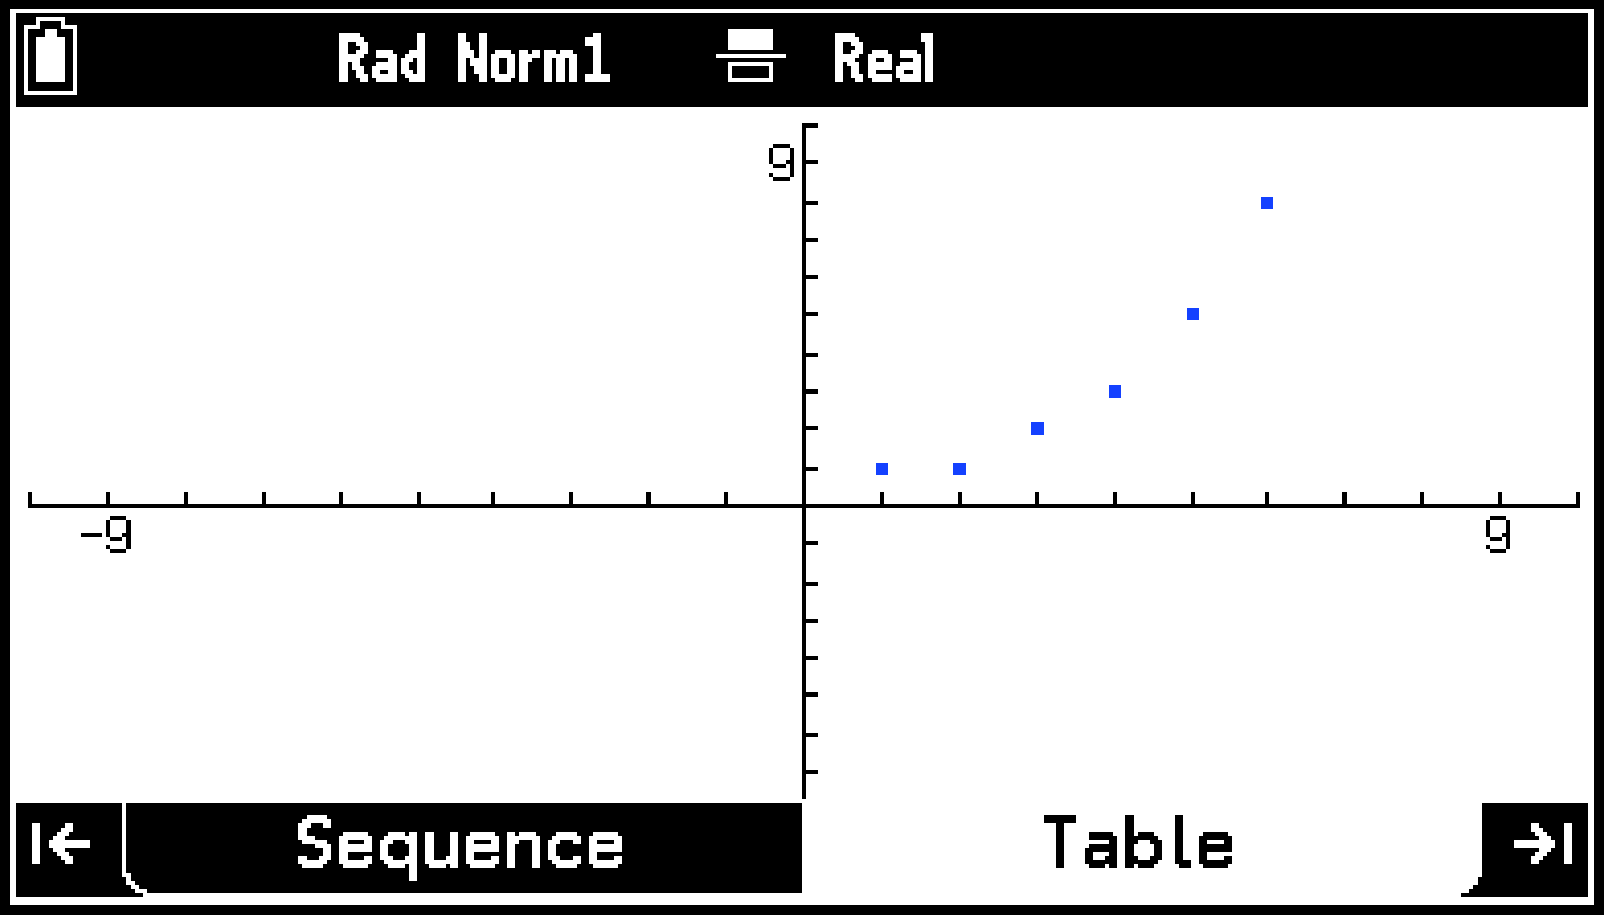
To draw a graph, select T > [Graph Points].
-
Use the View Window menu that appears to select [Pre-set Windows] > [Standard].
-
Next, highlight
 and then press O.
 -
To return to the numeric table display, press b.
[Type] > []
[First Term] > []
[Set Table Domain] > [Start]: 1 ; [End]: 6
d (Highlights line 2 ().)
C > [Recursion] > []+
C > [Recursion] > []E
1E
1E
The numeric table is displayed on the Table tab.
This causes the graph of the numeric table to appear on the Table tab.
Pressing < returns to the Sequence tab.
Using the Sequence Tab
On the Sequence tab, select one of the formula types shown below and input the formula.
|
For this formula type: |
Enter this formula: |
|---|---|
|
General term (Up to three of , , ) |
|
|
Two-term recursion formula (Up to three of , , ) |
|
|
Three-term recursion formula (Up to three of , , ) |
|
|
, |
Two general terms and |
|
, |
General term and two-term recursion formula |
|
, |
Two-term recursion formula and general term |
|
, |
Two two-term recursion formulas and |
Using the Setup Menu
To display the Setup menu
-
On the Sequence tab, use u to highlight the first line.
-
Press O.
Pressing U always highlights the first line.
To choose the formula type and first term type
|
To select this: |
Select this from the Setup menu: |
|---|---|
|
General term () |
[Type] > [] |
|
Two-term recursion formula () |
[Type] > [] |
|
Three-term recursion formula () |
[Type] > [] |
|
Two general terms and |
[Type] > [,] |
|
General term and two-term recursion formula |
[Type] > [,] |
|
Two-term recursion formula and general term |
[Type] > [,] |
|
Two two-term recursion formulas and |
[Type] > [,] |
|
First term type * |
[First Term] > [] |
|
First term type * |
[First Term] > [] |
The first term type must be specified when the formula type is [], [], [,], [,] or [,].
To specify the numeric table domain
-
From the Setup menu, select [Set Table Domain].
-
Highlight [Start], input a starting value (0 or some positive integer) and then press E.
-
Highlight [End], input the ending value* (a positive integer that is greater than the starting value) and then press E.
-
To close the menu, press b.
Do not specify an ending value that exceeds the starting value plus 998. The ending value must be equal to or less than 1 × .
To specify the starting coordinates for drawing a web graph (Formula type: )
Before drawing a web graph on the Table tab, specify the starting coordinates (-coordinates) for drawing in advance. To specify the starting coordinates, select [Set Web Graph Start] from the Setup menu. For information about web graph drawing, see Using Web Graph to Check the Convergence or Divergence of a Numeric Sequence.
Inputting and Editing Recursion Formulas
To input or edit a recursion formula
On the Sequence tab, highlight the line where you want to input something and then start inputting. To edit part of something you have already entered, press O, r, or l.
Use C > [Recursion] to input , , (and , , , ).
If the formula type is [], [,], [,] or [,], input the first term. If the formula type is [], input the first and second terms.
Note
The restrictions described below apply when [,], [,], [,] or [,] is selected as the formula type.
|
With this formula type: |
This type of input is not supported: |
|---|---|
|
, |
Input of in the left-side expression and input of in the left-side expression at the same time*1 Input of an expression that includes *2 |
|
, |
Input of in the left-side expression and input of in the left-side expression at the same time*1 Input of an expression that includes *2 |
|
, |
Input of in the left-side expression and input of in the left-side expression at the same time*1 Input of an expression that includes *2 |
|
, |
Input of in the left-side expression and input of in the left-side expression at the same time*1 Input of an expression that includes *2 |
Input on the Sequence tab itself is possible, but doing so causes an error (Circular ERROR) when you try to create a table.
Input in the Sequence tab itself is possible, but doing so causes an error (Syntax ERROR) when you try to create a table.
Example of Inputting a Two-term Recursion Formula and General Term at the Same Time
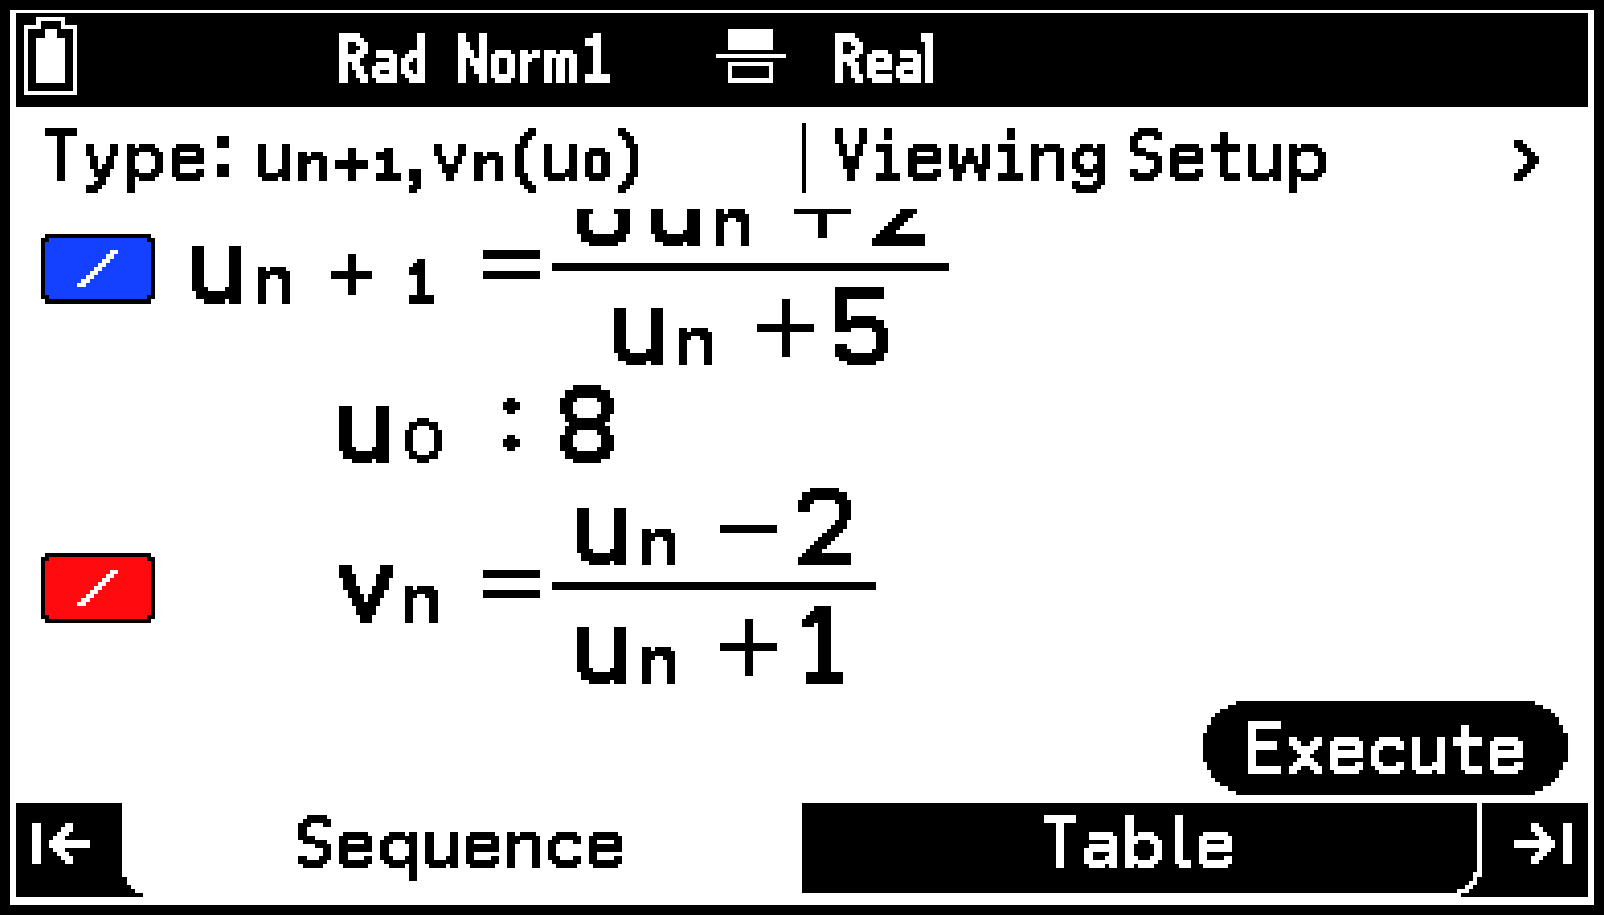
Example: To enter the equation below, which consists of two-term recursion formula and a general term . Next, create a numeric table and then graph the table.
(However )
-
On the Sequence tab, press u to highlight the first line.
-
Press O. Next, use the Setup menu that appears to configure the settings shown below.
-
Input: , ,
-
To display the number table, press >.
-
To draw a graph, select T > [Graph Points].
-
Use the View Window menu that appears to select [Pre-set Windows] > [Standard].
-
Next, highlight
and then press O.
[Type] > [,]
[First Term] > []
[Set Table Domain] > [Start]: 1 ; [End]: 6
d (Highlights line 2 ().)
e6C > [Recursion] > []+2d
C > [Recursion] > []+5E
8E
eC > [Recursion] > []-2d
C > [Recursion] > []+1E
This displays the numeric table on the Table tab.
This causes the graph of the numeric table to appear on the Table tab.
To delete a recursion formula
See To delete a function.
To specify the line type and line color of a graph drawn from a recursion formula
See Graph Drawing Settings (Line Type, Line Color).
Creating a Numeric Table
Of the recursion formulas on the Sequence tab, those with T > [Select] turned on can be used for numeric table creation. You can determine the current on/off setting by checking the icon to the left of a recursion formula.
|
|
|
To create a numeric table, press > or <, or highlight ![]() and then press O.
and then press O.
Turning on S > [Display] adds a cumulative sum column to the numeric table for each term (, , ).
Using the Table Tab
The Table tab displays a numeric table or a graph. When you move from the Sequence tab to the Table tab, the numeric table is initially displayed. You can switch from numeric table display to graph display by using the T menu.
Operations While a Numeric Table is Displayed
You can use the cursor keys, as well as the U and D keys to move the cell highlighting between cells. You can also perform the operations below from the T menu.
|
To do this: |
Select this menu item: |
|---|---|
|
Specify the domain of the table being created*1 |
T > [Set Table Domain] |
|
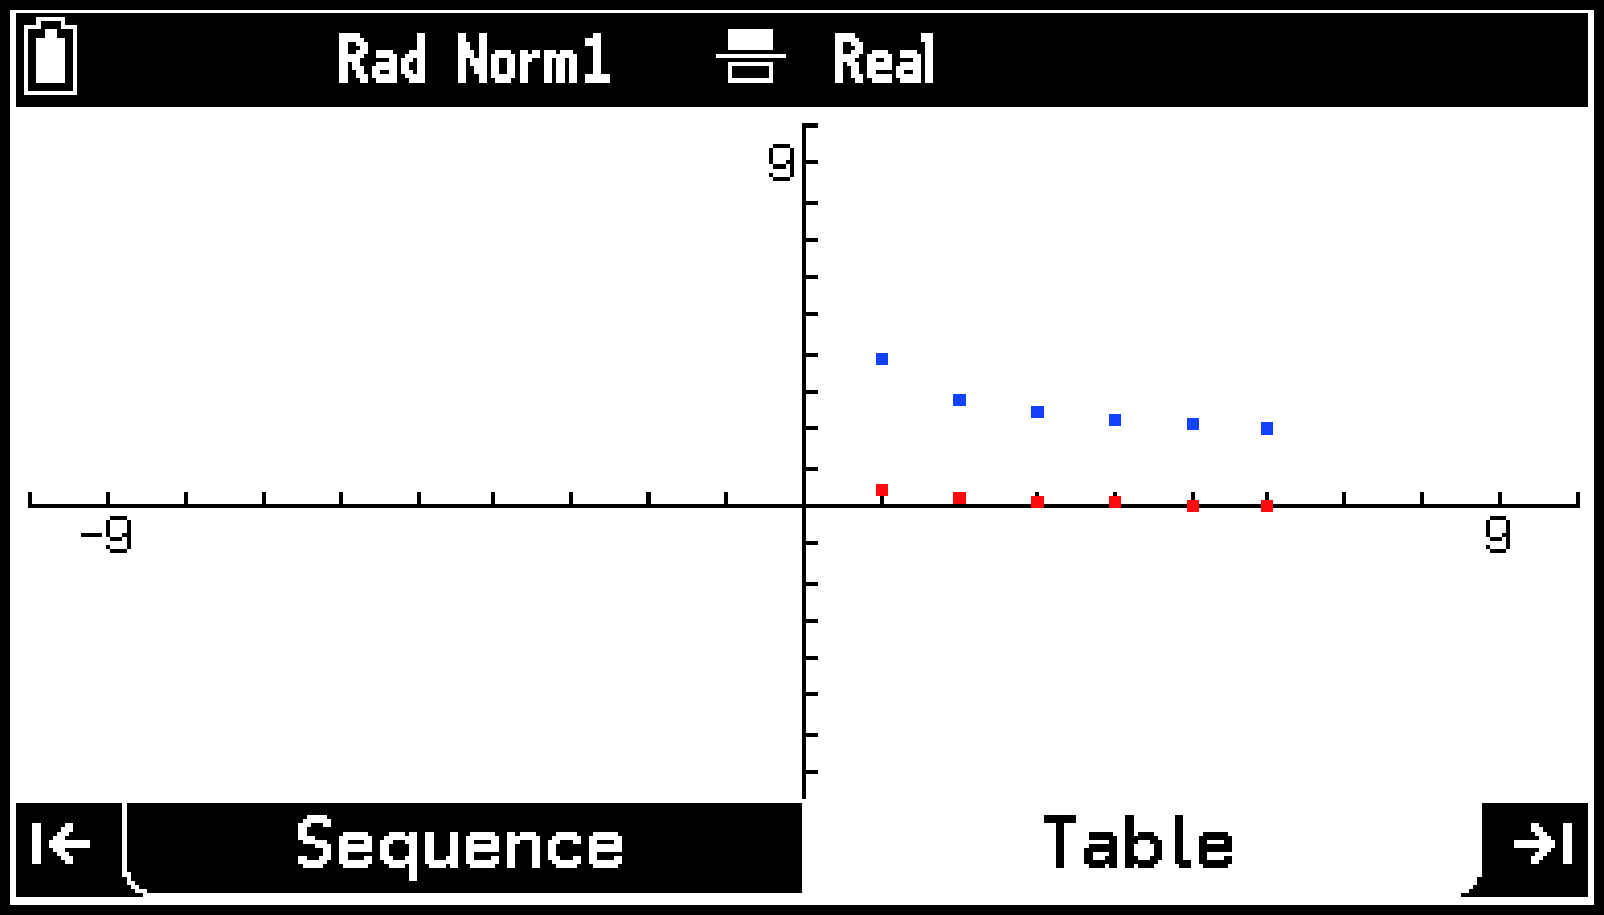
Draw a graph that shows dots at the coordinates*2 of a numeric table |
T > [Graph Points] |
|
Draw a graph that connects the coordinates*2 of a numeric table with straight line segments |
T > [Graph Points (Joined)] |
|
Use Web Graph to check the convergence or divergence of a numeric sequence*3 |
T > [Web Graph] |
|
Draw a Phase Graph based on two recursion formulas*4 |
T > [Phase Graph] |
|
Specify the display range of a graph*5 |
T > [View Window] |
|
Save one column of a numeric table to a list variable |
T > [Store List] |
|
Delete an entire numeric table and return to the Sequence tab |
T > [Delete] |
See To specify the numeric table domain.
Each coordinate consists of the numeric table -column as the -axis and the //-column as the -axis.
Drawing is possible when is selected as the formula type. See Using Web Graph to Check the Convergence or Divergence of a Numeric Sequence.
Drawing is possible when , , or is selected as the formula type. See Drawing a Phase Graph From Two Sequences.
See Specifying the Display Range of the Graph Window (View Window).
Drawing a Phase Graph From Two Sequences
You can create numeric tables (sequences) from two recursion formulas and then draw a Phase Graph using the values of one formula as the horizontal axis and the values of the other formula as the vertical axis.
Example: To input the two two-term recursion formulas and , where the first terms are and respectively. Next, create sequences that change the value of variable from 1 to 10, and then use the sequences to draw a Phase Graph.
-
On the Sequence tab, press u to highlight the first line.
-
Press O, and then use the Setup menu that appears to configure the settings shown below.
-
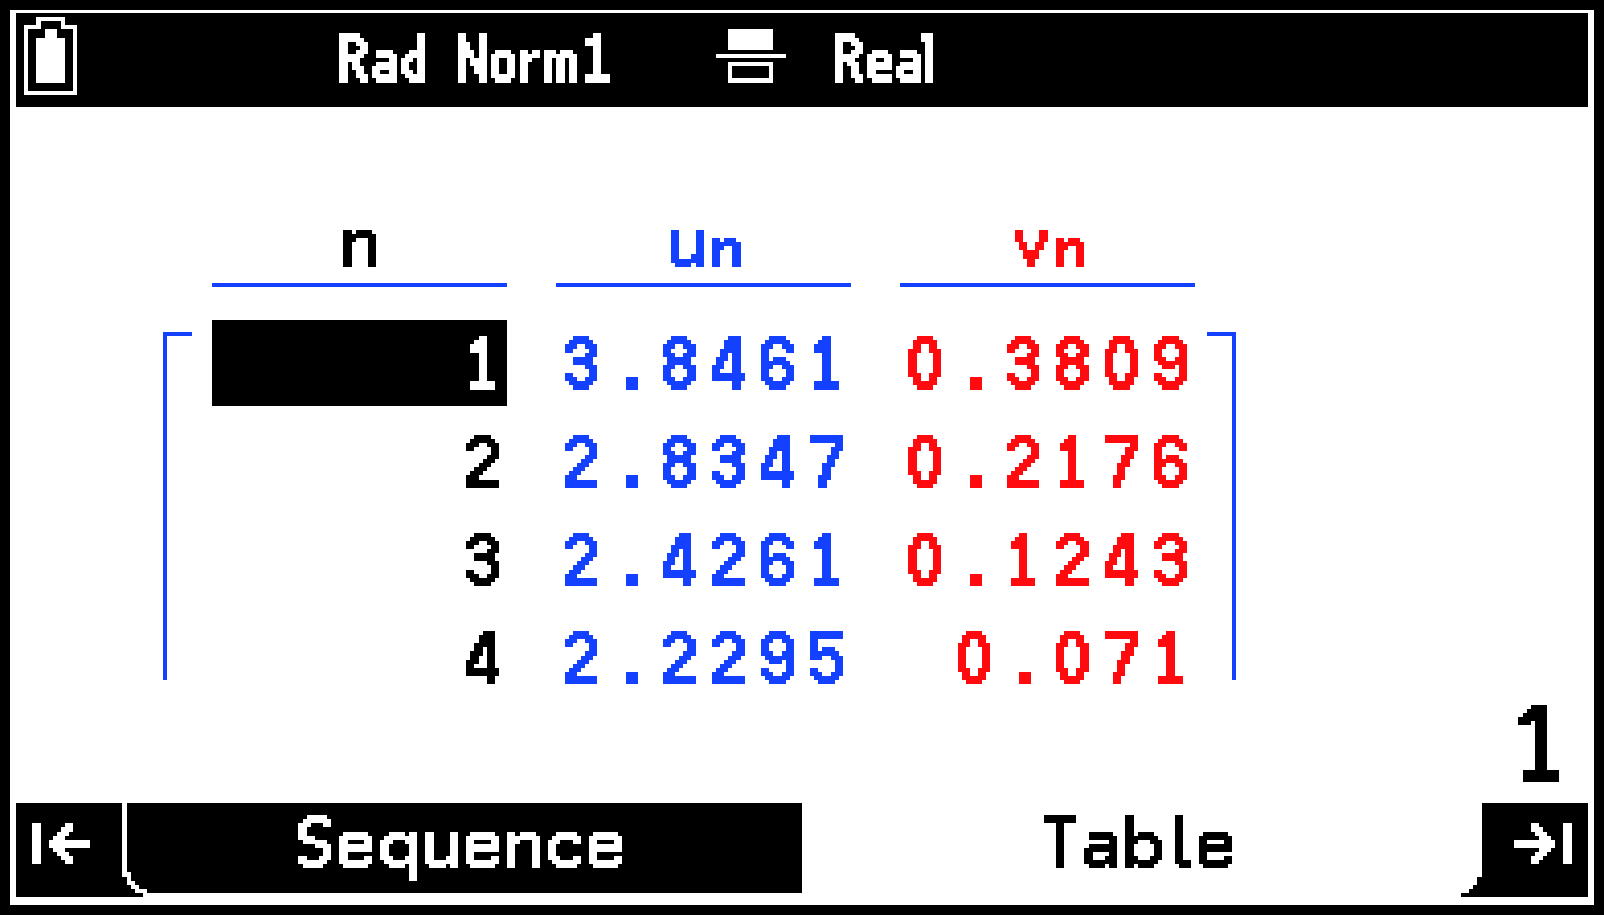
On the Sequence tab, input , , , .
-
Press > to go to the Table tab.
-
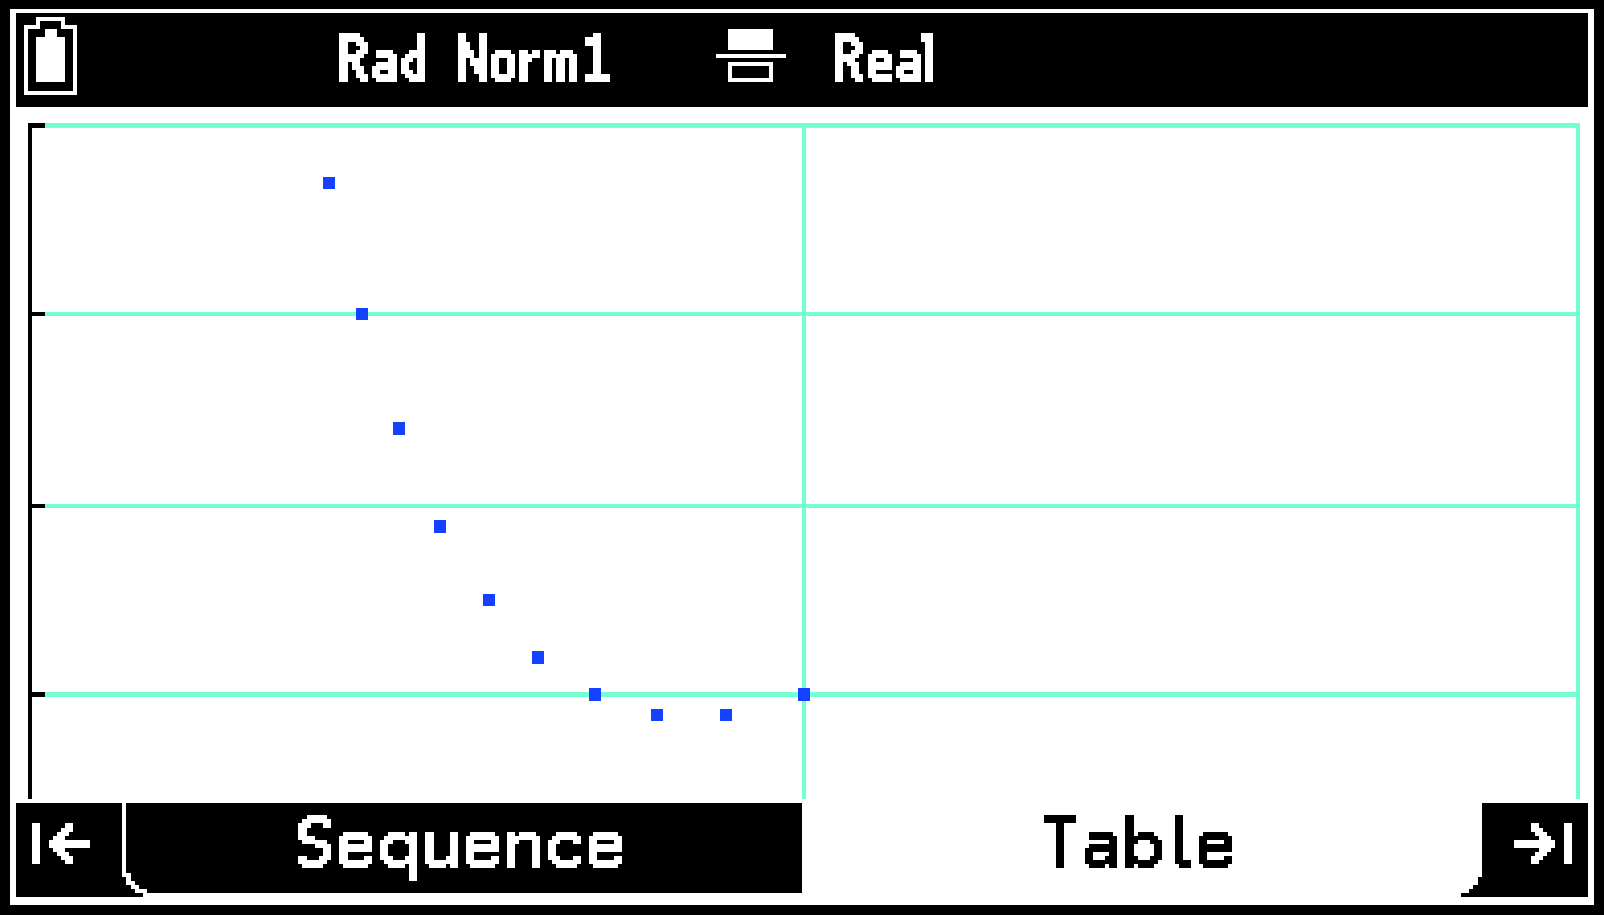
Select T > [Phase Graph].
-
On the View Window menu that appears, input the values shown below.
-
Highlight
and then press O.
[Type] > []
[First Term] > []
[Set Table Domain] > [Start]: 1 ; [End]: 10
Minimum = 0, Maximum = 2, Scale = 1
Minimum = 0, Maximum = 4, Scale = 1
Phase Graph appears on the Table tab.
Note
A Phase Graph can be drawn when , , or is selected as the formula type.
The -axis values are those of the formula that is higher in the Sequence tab list, while the -axis values are those of the lower formula.
The color used to draw the graph is the color assigned to the formula that is higher in the Sequence tab list.
If three regression formulas (, , ) have been entered and all three are selected for numeric table creation, a menu will appear in step 5 above asking you to select two of the three (-, -, -).
If S > [Display] is turned on, a menu will appear to select whether to graph using (sequence) or (cumulative sum of sequences) in step 5 above.
Using Web Graph to Check the Convergence or Divergence of a Numeric Sequence
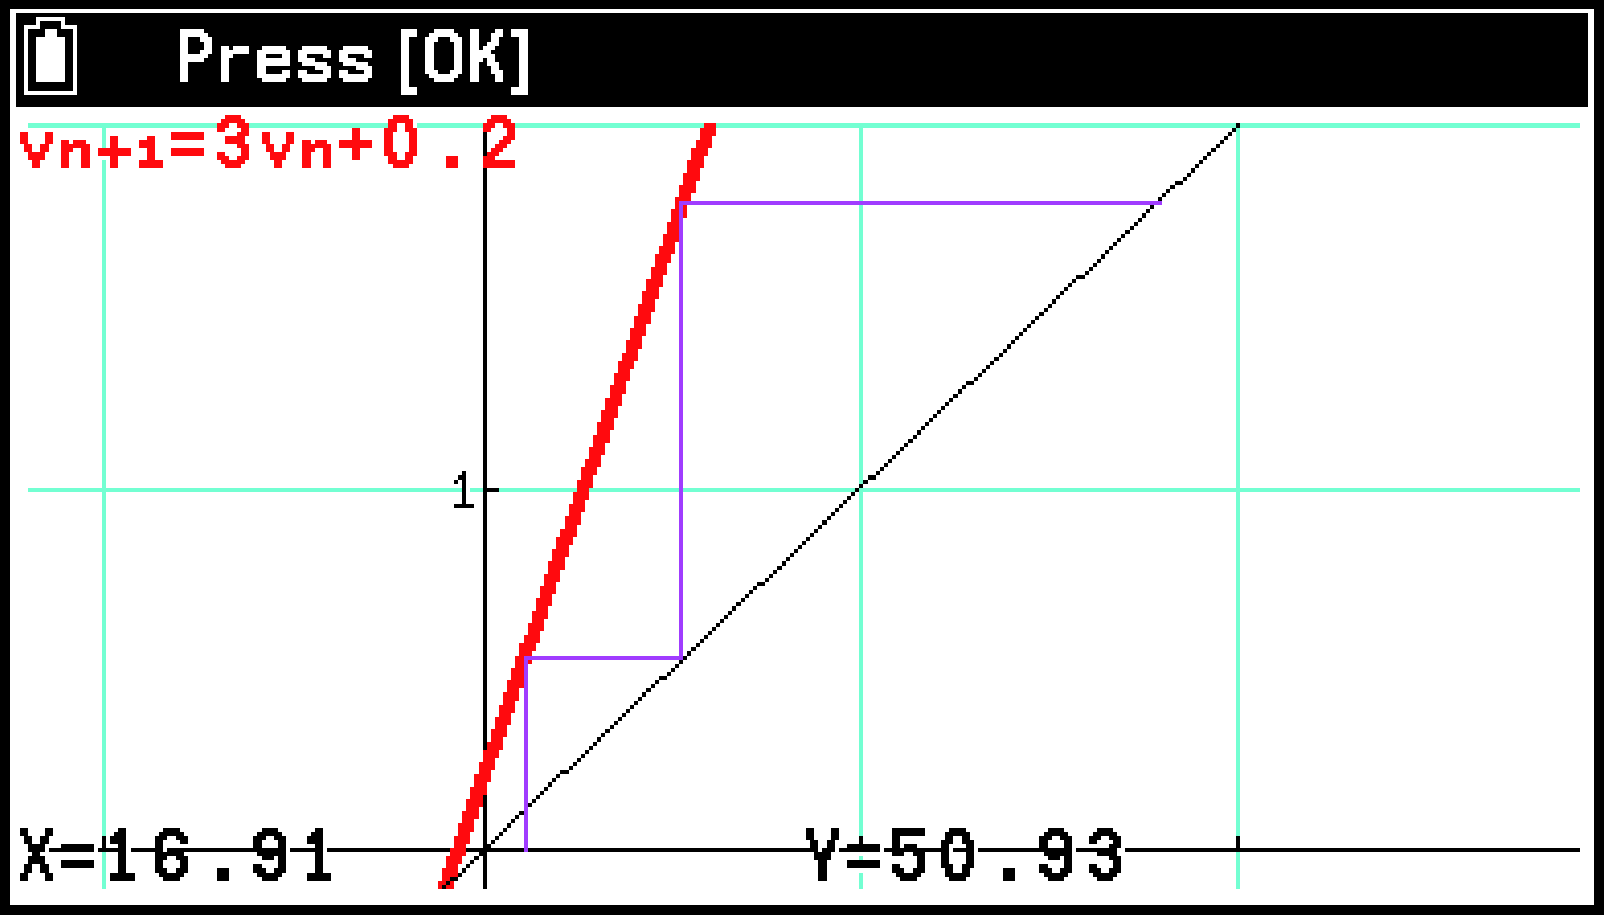
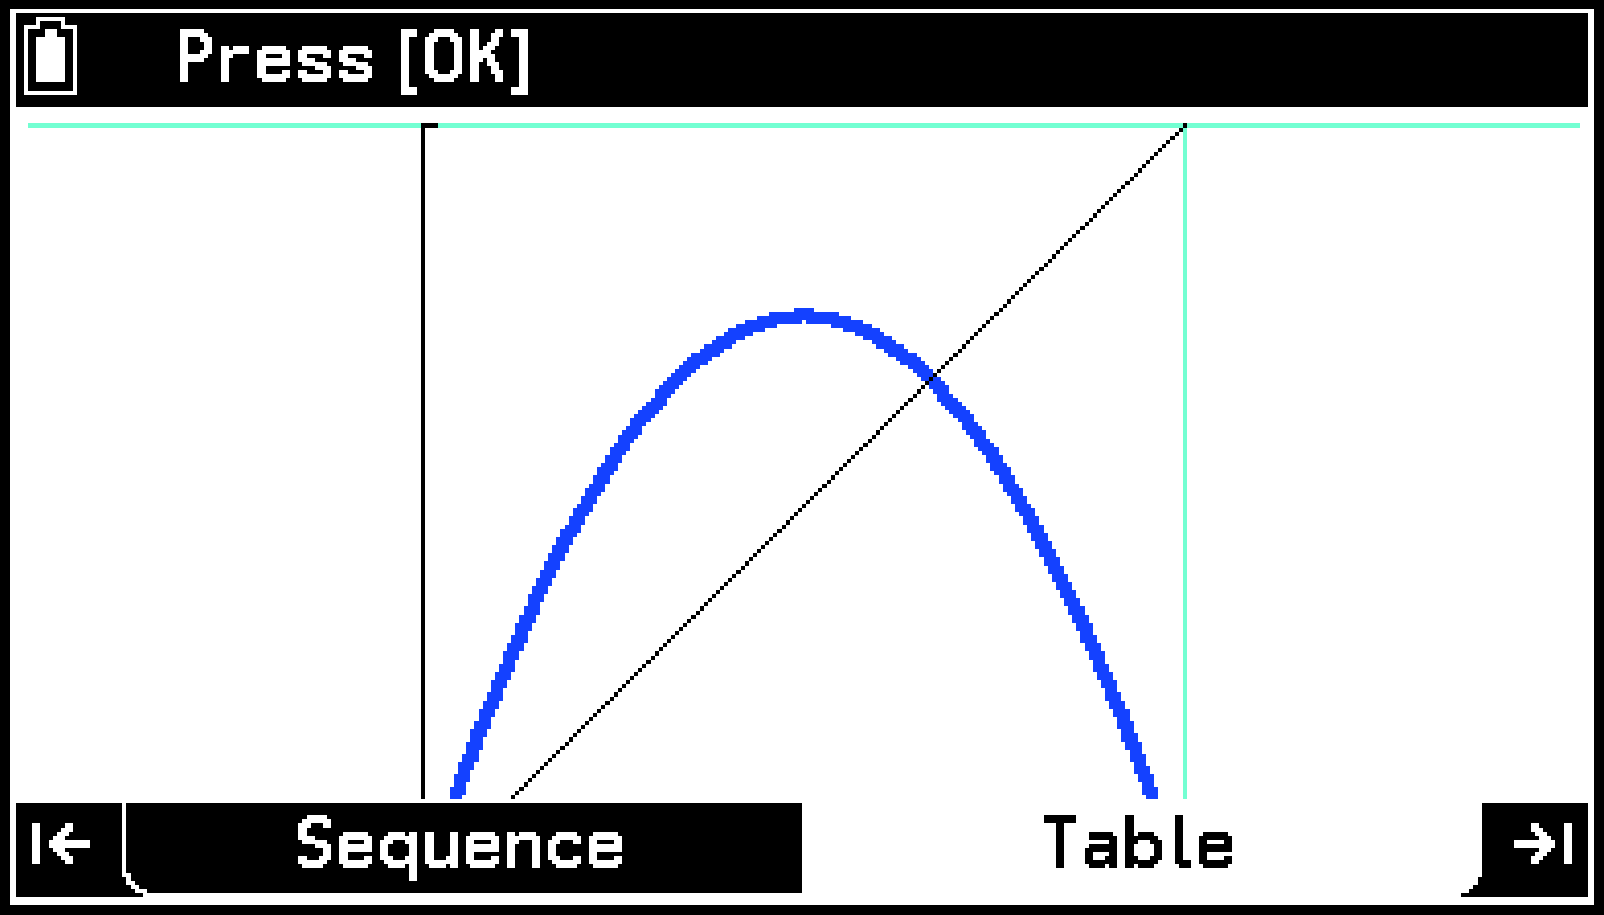
For example, graph where and in a two-term recursion formula that can be expressed in terms of and . Overlap this with a straight line with a slope of 45 degrees (graph of ). You can use these two graphs to draw a web graph automatically.
Selecting [Web Graph] in the example procedure below automatically graphs and draws a straight line with a 45-degree slope. Then you can simply press O multiple times to draw the web graph. By observing the behavior of the web graph, you can intuitively grasp whether the sequence is convergent or divergent.

Convergent
Divergent
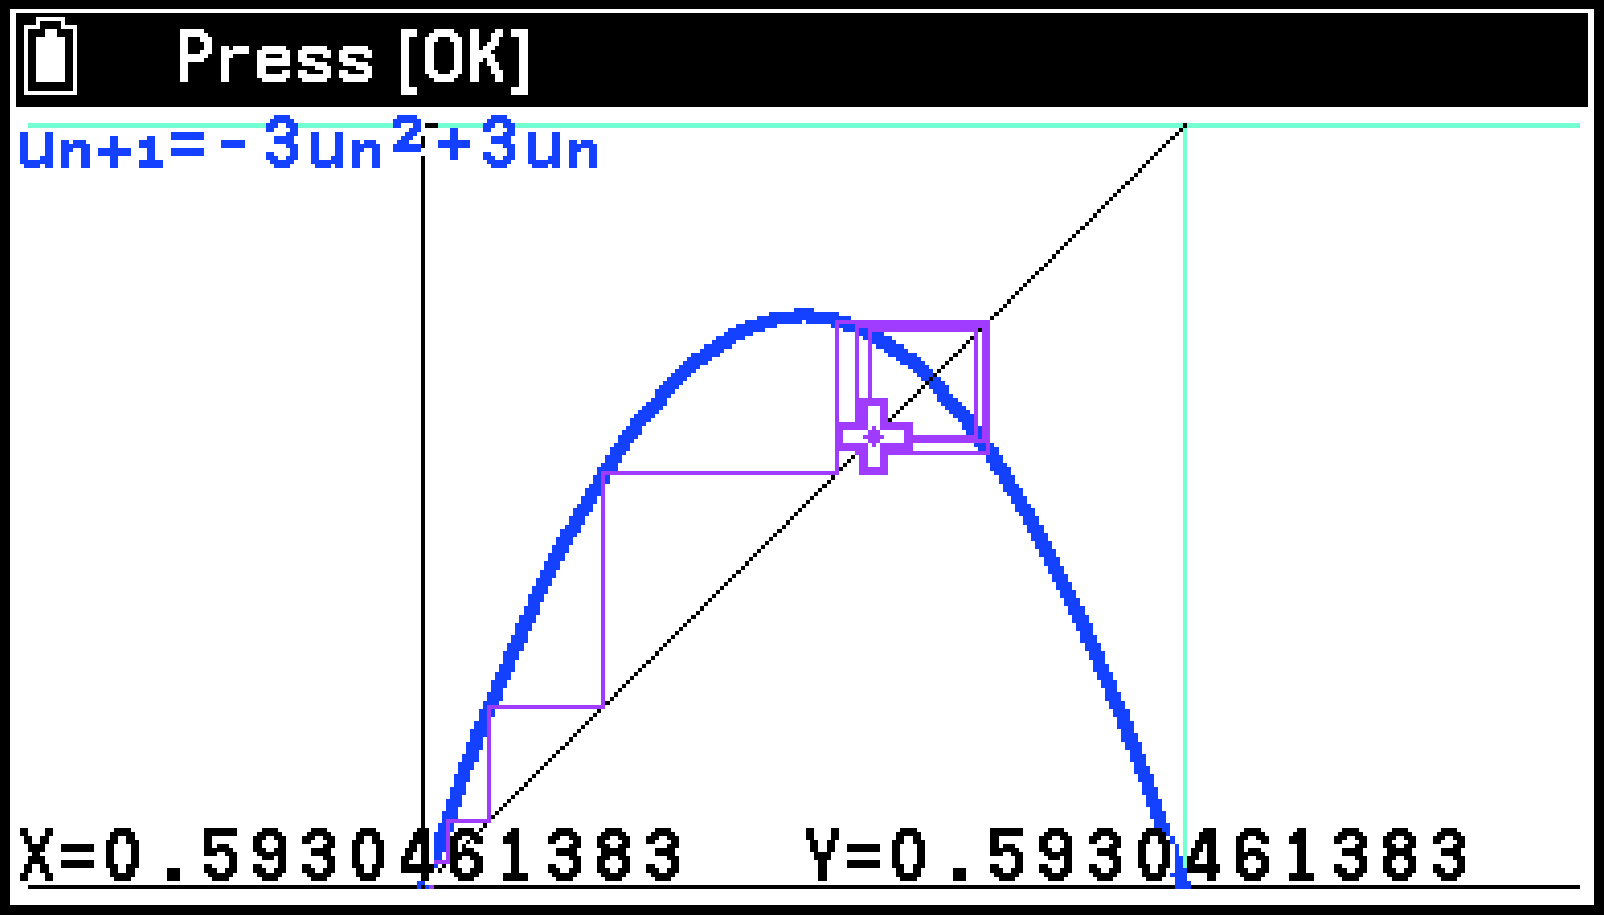
Example: To enter the two-term recursion formula equation (first term ), draw a web graph, and determine if the graph is convergent or divergent
-
On the Sequence tab, press u to highlight the first line.
-
Press O, and then use the Setup menu that appears to configure the settings shown below.
-
On the Sequence tab, input , .
-
Press > to go to the Table tab.
-
Select T > [Web Graph].
-
On the View Window menu that appears, input the values shown below.
-
Highlight
and then press O. -
Press O.
-
Press O 20 times.
[Type] > []
[First Term] > []
[Set Table Domain] > [Start] : 0 ; [End] : 6
[Set Web Graph Start] > [Start] : 0.01*
Make the -coordinate of the starting point for drawing the web graph the same value as .
Minimum = -0.52, Maximum = 1.52, Scale = 1
Minimum = 0, Maximum = 1, Scale = 1
This graphs and draws a straight line with a slope of 45 degrees.
This causes a cross pointer (![]() ) to flash at the starting point of the web graph.
) to flash at the starting point of the web graph.
Each press of O draws the straight lines of the web graph. The graph indicates that the numeric series is convergent.
To exit web graph drawing, press b.
Note
A web graph can be drawn when is selected as the formula type.
You can specify the line type and line color of the graph drawn above. For details, see Graph Drawing Settings (Line Type, Line Color).
Operations While a Graph is Displayed
|
To do this: |
Select this menu item: |
Details: |
|---|---|---|
|
Specify the display range |
T > [View Window] |
Specifying the Display Range of the Graph Window (View Window) |
|
Display a pointer on a graph and read the coordinate values |
T > [Trace] |
|
|
Zoom in and out of the display |
T > [Zoom] |
|
|
Draw dots, lines, characters, etc. |
T > [Sketch] |
|
|
Grab a point on a window and drag it around the display |
T > [Pan] |
Grabbing a Point on a Window and Drag It Around the Display (Pan) |
|
Adjust the background image |
T > [Fade I/O] |
Displaying a Numeric Table and Graph at the Same Time
When S > [Table with Graph] is turned on, the numeric table window is displayed on the right of the Table tab and the graph window is displayed on the left.
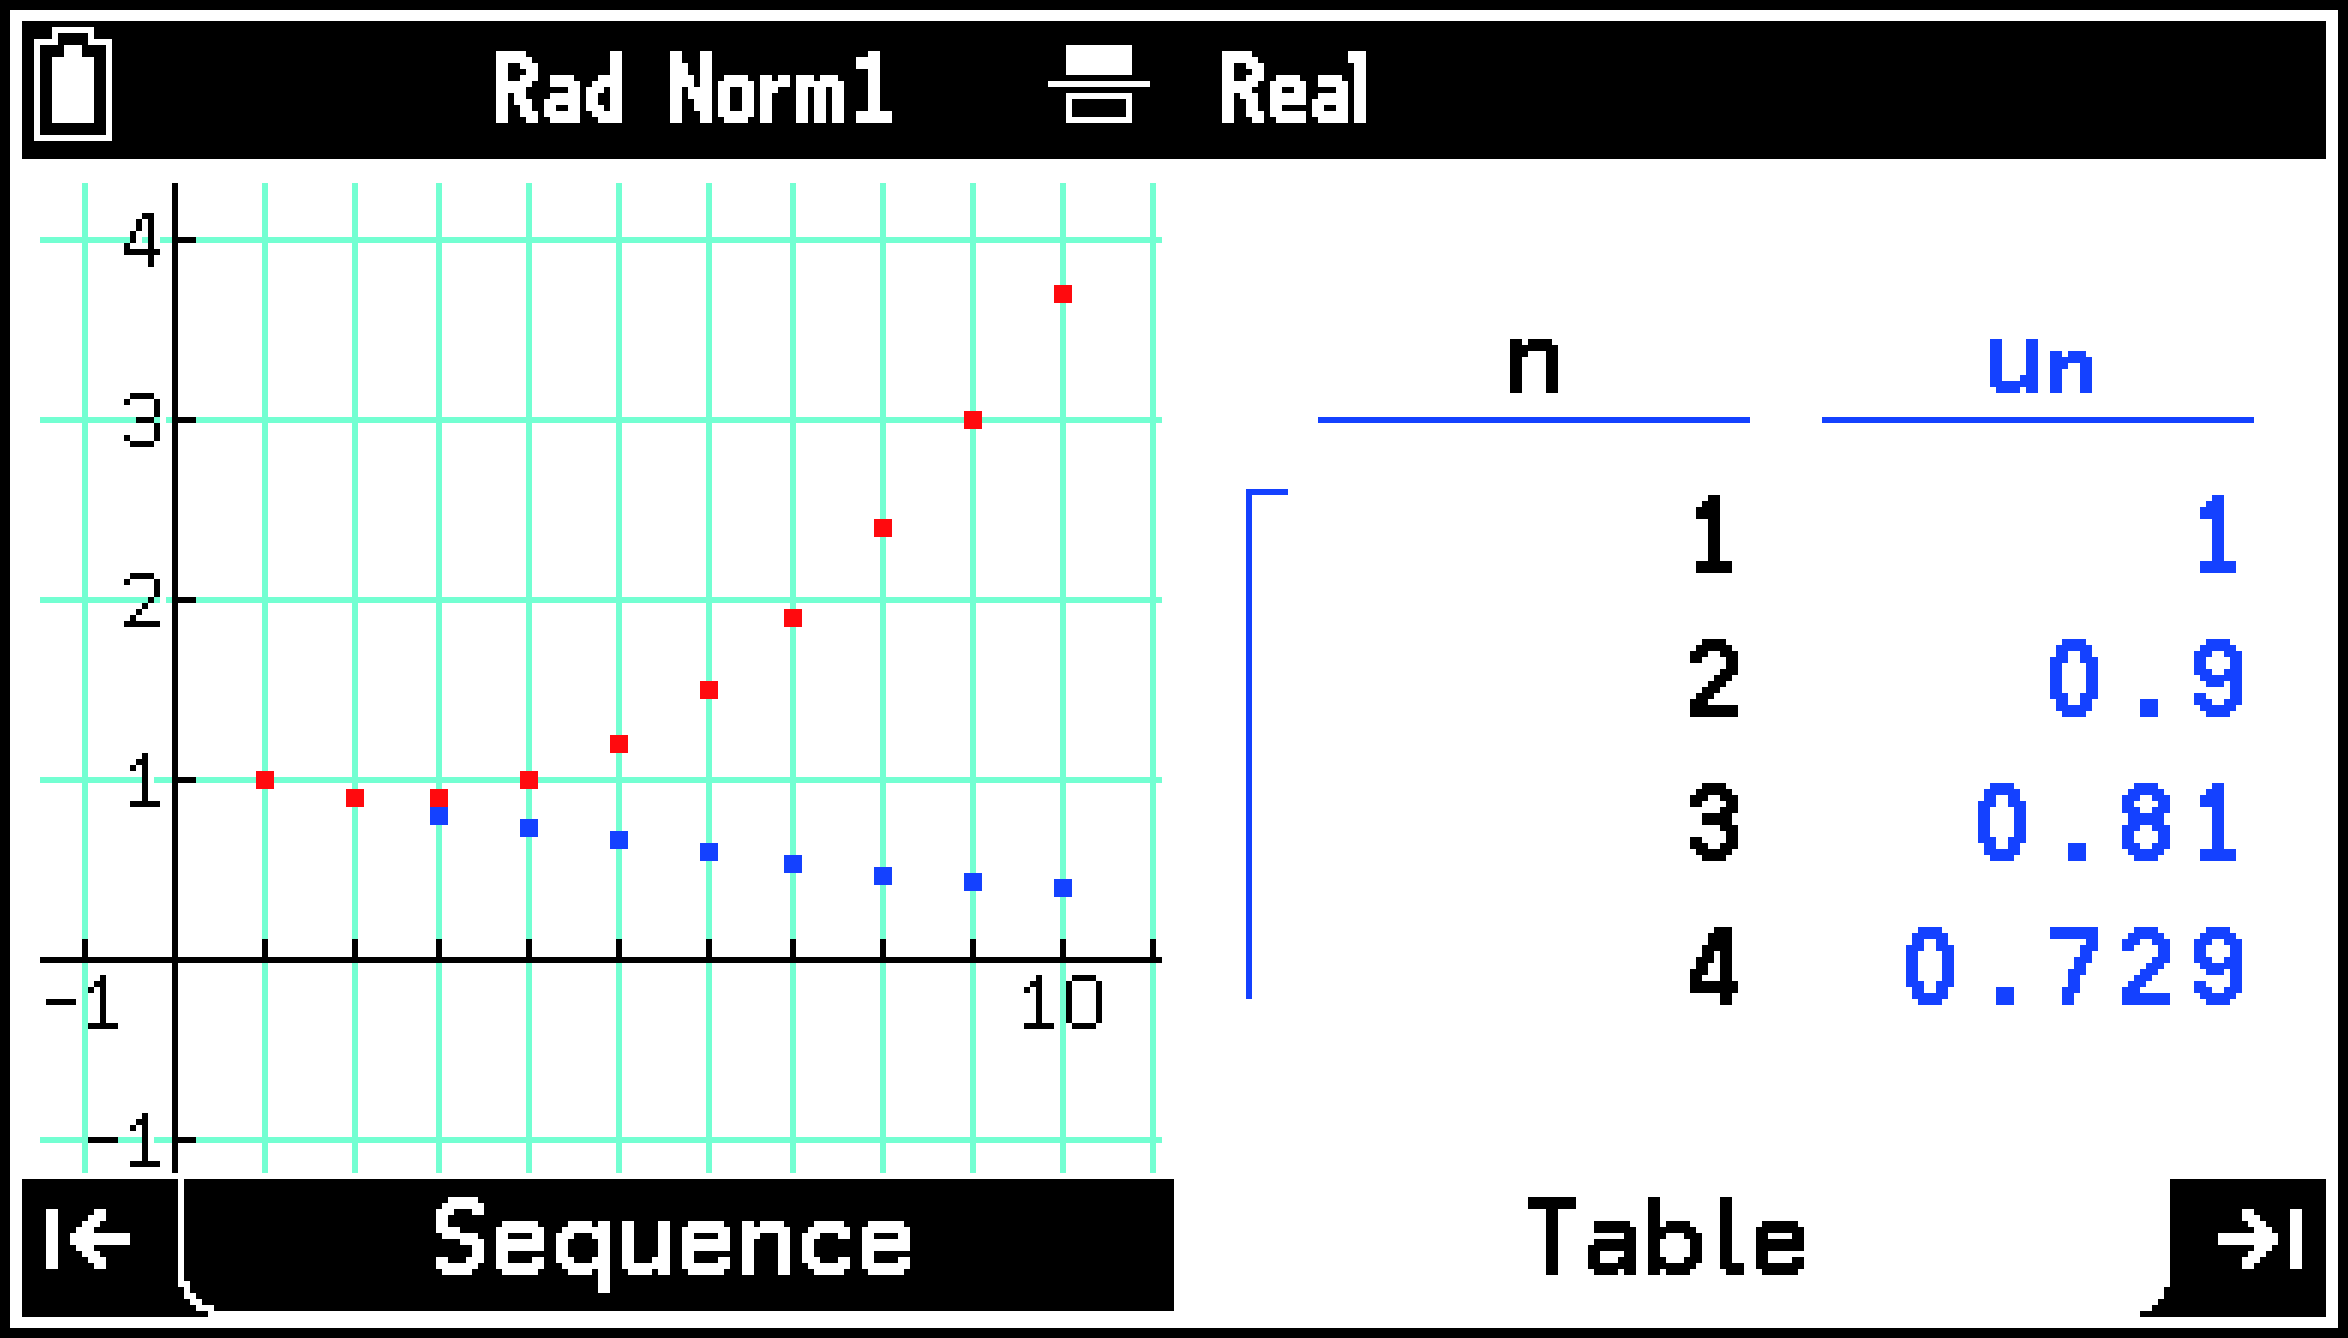
Nothing is drawn in the graph window immediately after you move to the Table tab from the Sequence tab. Use the following operations to draw the graph.
Select T > [Switch Active Window].
From T, select the menu item for drawing a graph.
Each time you select T > [Switch Active Window], the active window (the window that is affected by the operations you perform) toggles between the numeric table window and the graph window. The numeric table window is active when the cursor is displayed on the numeric table.
While the numeric table window is active, you can perform the operations described under Operations While a Numeric Table is Displayed. While the graph window is displayed, you can perform the operations under Operations While a Graph is Displayed, except for Pan and Fade I/O.