Geometry App
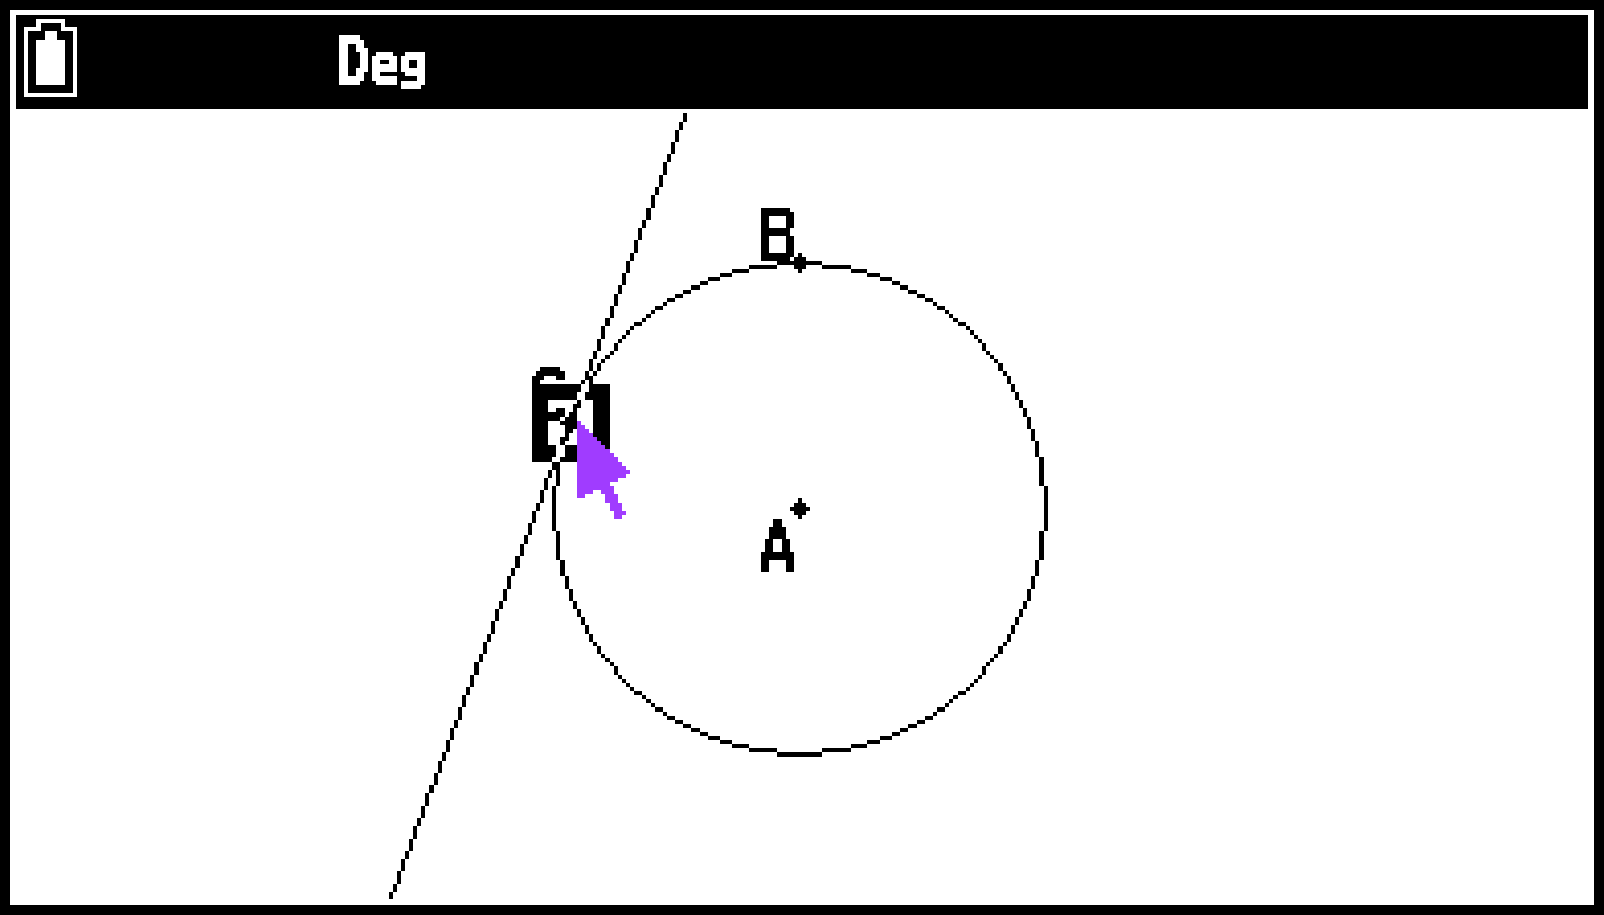
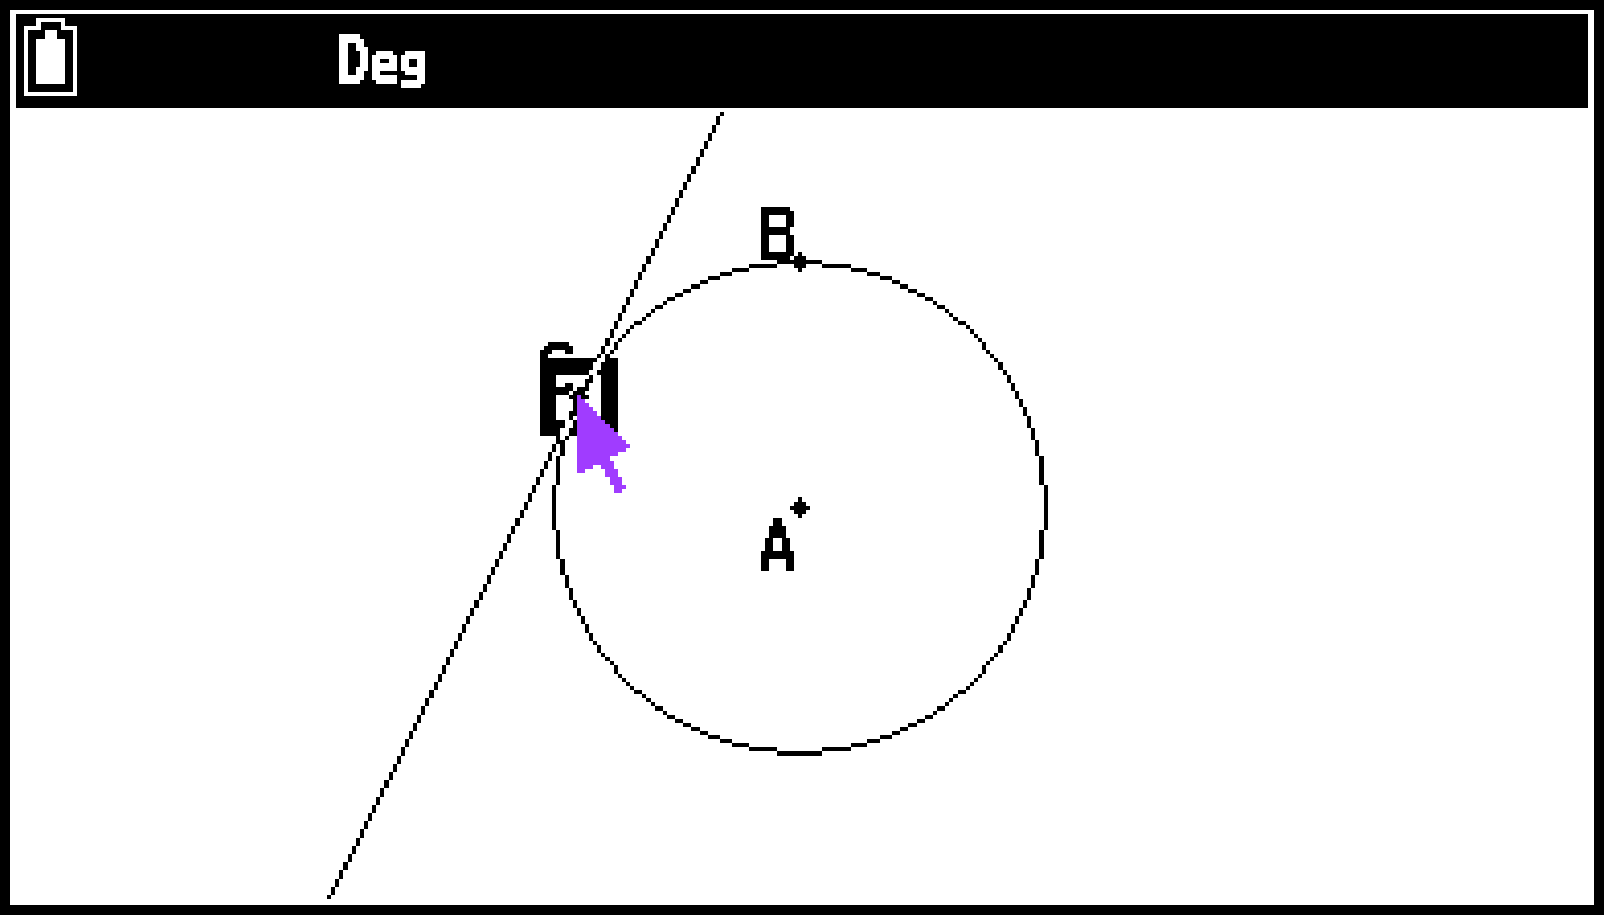
Select h > Geometry to start up the Geometry app. This app allows you to draw and analyze geometric objects. For example, you can draw a circle and then draw a line that is tangent to a particular point on the circle.
The Geometry app also includes an animation feature that lets you watch how a figure changes in accordance with conditions you define.
Note
Changes to the Angle, Grid, or Axes settings of the Settings menu in the Geometry app, affect only the Geometry app. They do not affect other apps. Conversely, changes made to these settings in other apps do not affect the Geometry app.
The initial default setting of the Geometry app’s Angle setting is Degree.
The examples in this chapter assume Geometry app initial default settings are in use (which are configured when a new file is created as described under Using the File Menu), unless otherwise noted.
Drawing and Editing Objects
This section explains how to perform the following operations.
Plot points, draw line segments, polygons, etc. (Draw menu, Draw Special menu)
Insert text into screen images
Undo an operation
Select and deselect objects, move an object, delete an object and other editing operations
Using the Pointer
You can use the following operations to move the on-screen pointer (![]() ) around the display when drawing objects, editing objects, etc.
) around the display when drawing objects, editing objects, etc.
To move the pointer
Use the cursor keys (d/u/l/r) to move the pointer around the display. Holding down a cursor key moves the pointer at high speed.
To make the pointer jump to a particular location
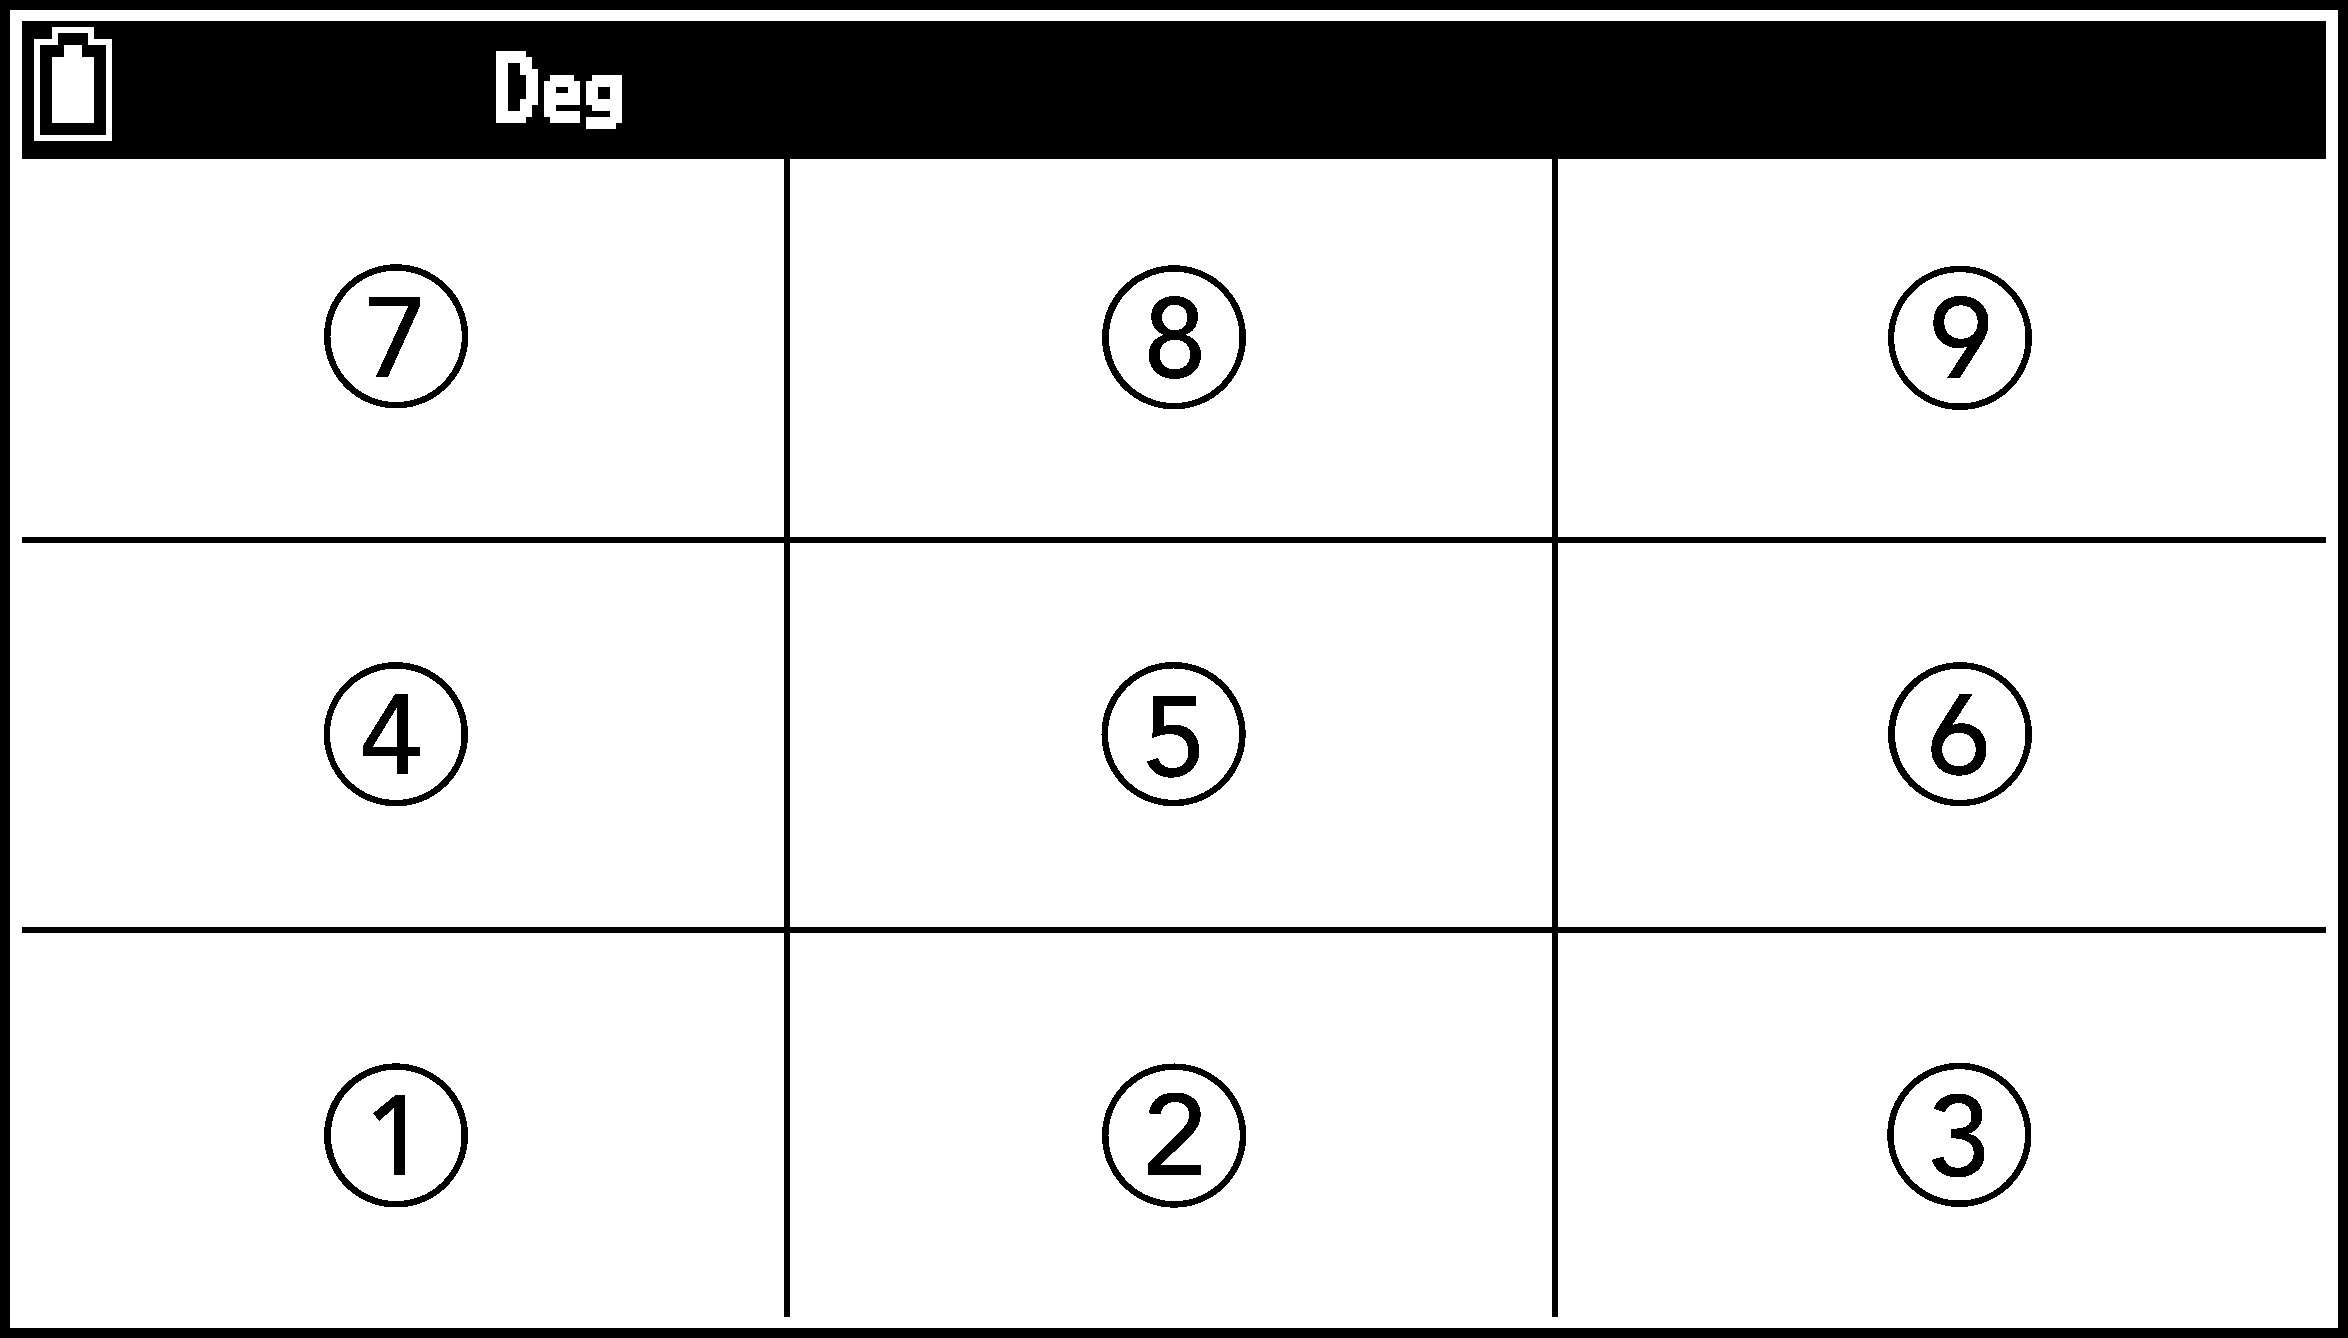
Pressing a number key (1 to 9) causes the pointer to jump to the corresponding location of the screen as shown below.
Using the Draw Menu
The Draw menu contains menu items for drawing basic geometric elements such as points, line segments, circles, etc.
|
To do this: |
Select this menu item: |
And then specify these points:*1 |
|---|---|---|
|
Plot a point |
T > [Draw] > [Point] |
One point*2 |
|
Draw a line segment |
T > [Draw] > [Line Segment] |
Two points in different locations (line segment start and end points) |
|
Draw a straight line |
T > [Draw] > [Line] |
Two points in different locations (two points through which a straight line passes) |
|
Draw a ray |
T > [Draw] > [Ray] |
Two points in different locations (ray start point and a point through which the ray passes) |
|
Draw a vector |
T > [Draw] > [Vector] |
Two points in different locations (vector start and end points) |
|
Draw a circle |
T > [Draw] > [Circle] |
Two points in different locations (circle center point and one point on the circumference) |
|
Draw an arc |
T > [Draw] > [Arc] |
Three points in different locations*3 |
|
Draw a semicircle |
T > [Draw] > [Semicircle, by Diameter] |
Two points in different locations (either end of a circle diameter) |
To specify a single point, move the pointer to the desired location and then press O.
See the Example 1 below.
See the Example 2 below.
Example 1: To plot a point
-
Select T > [Draw] > [Point].
-
Move the pointer to the location where you want to plot a point and then press O.
-
After you are finished plotting all the points you want, press b to deselect the Point tool.
This plots a point at the pointer location.
The ![]() icon remains on the screen, which means you repeat step 2 to plot more points if you want.
icon remains on the screen, which means you repeat step 2 to plot more points if you want.
Note
Some drawing tools remain after you draw something, like the Point tool. To deselect such a tool, press b or a.
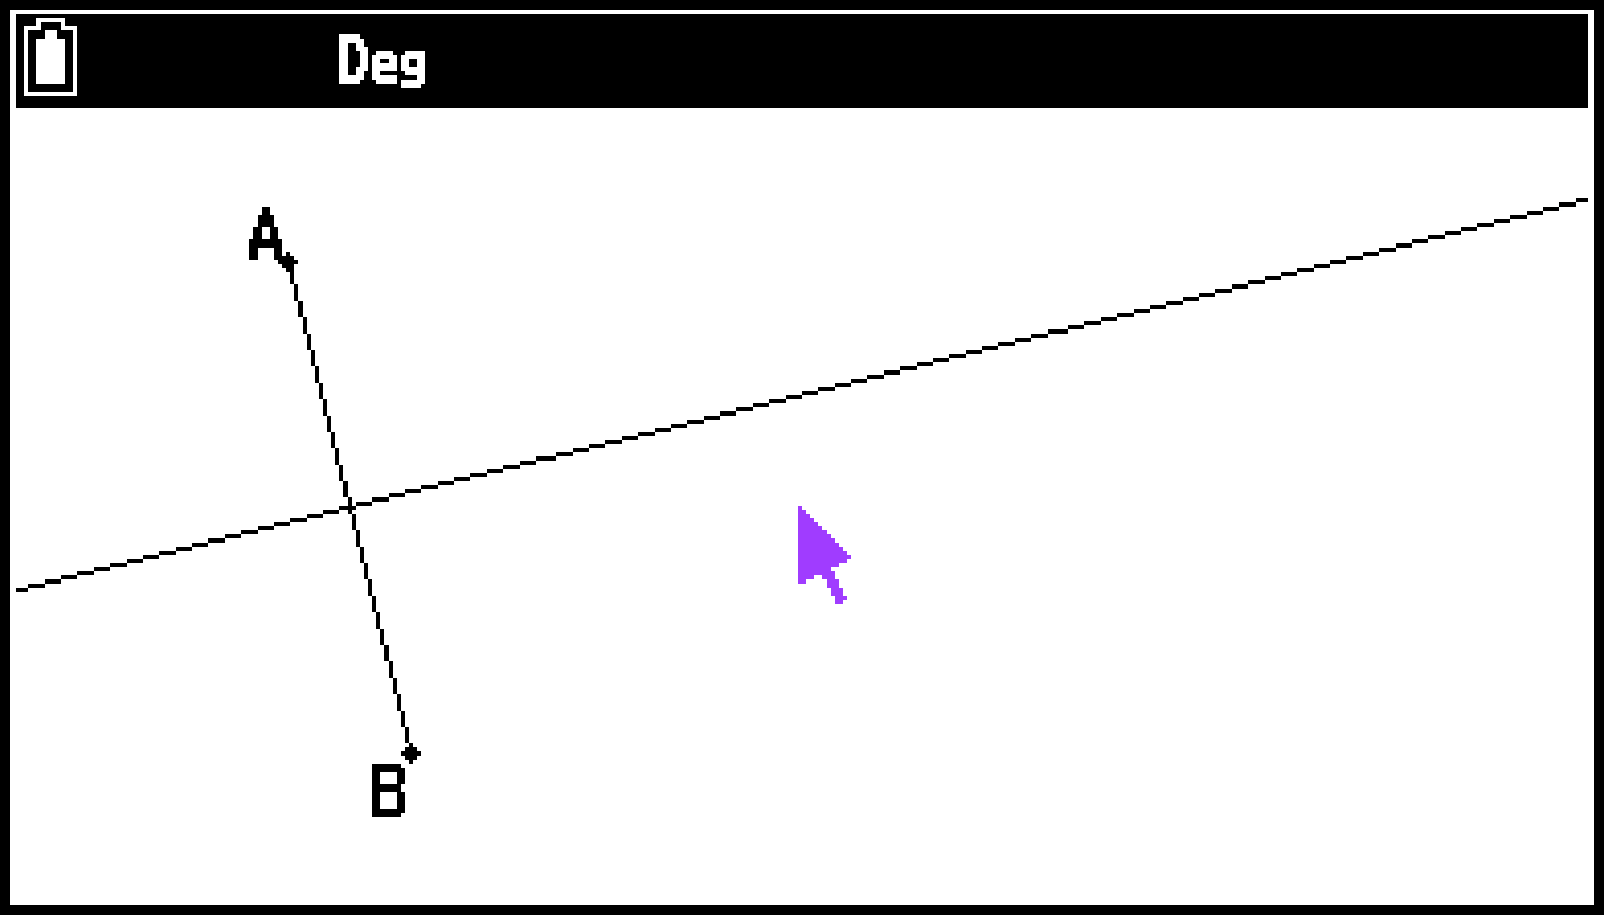
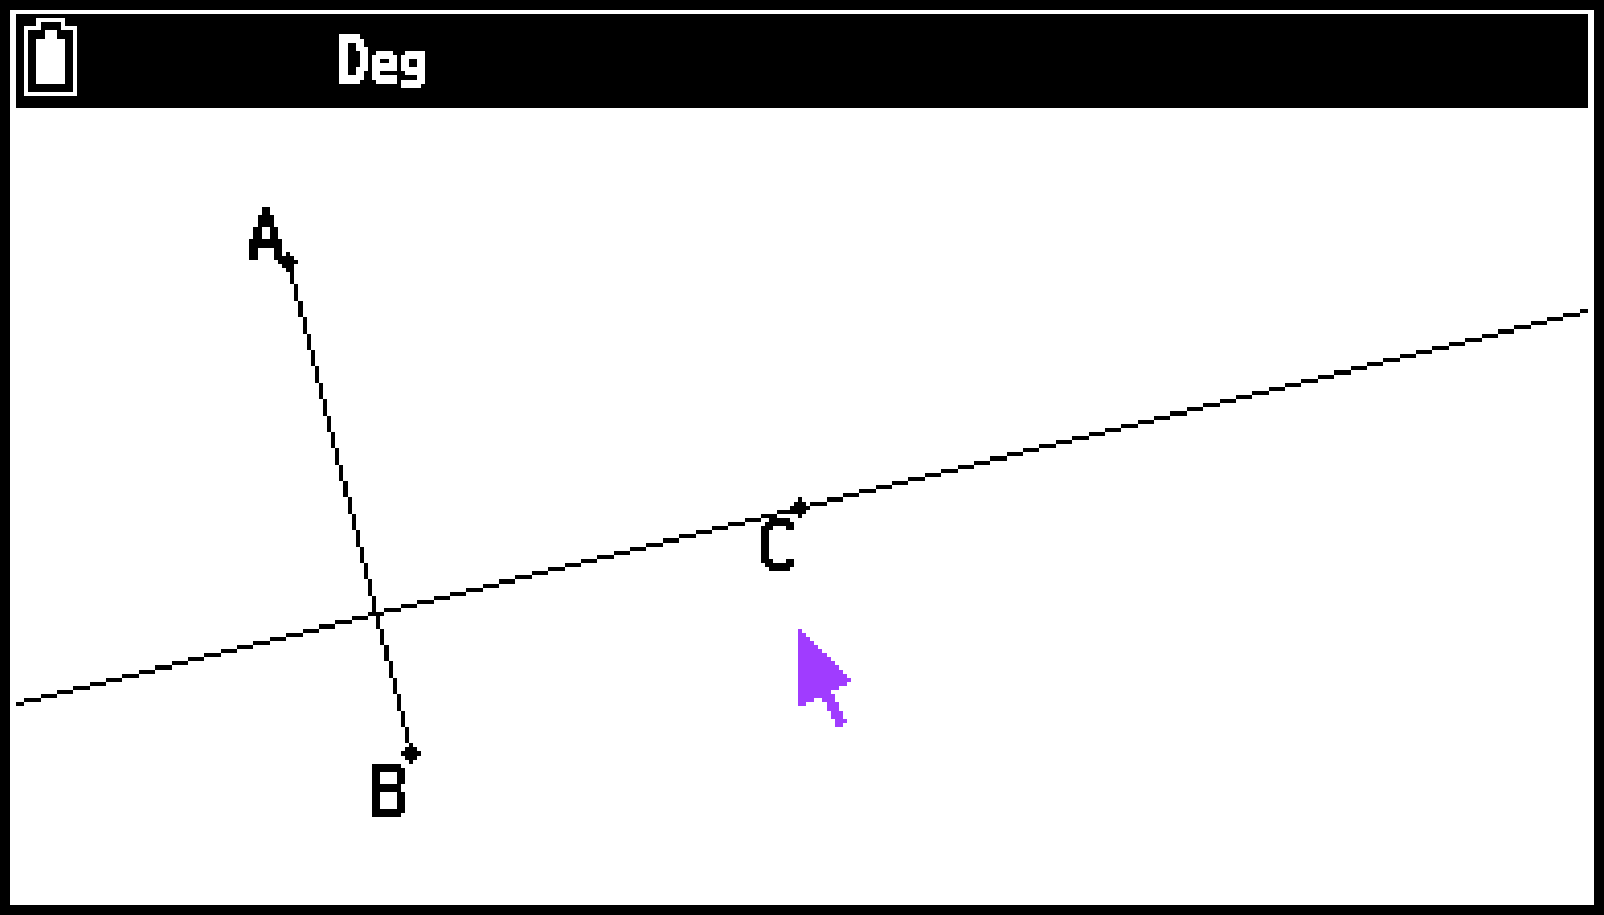
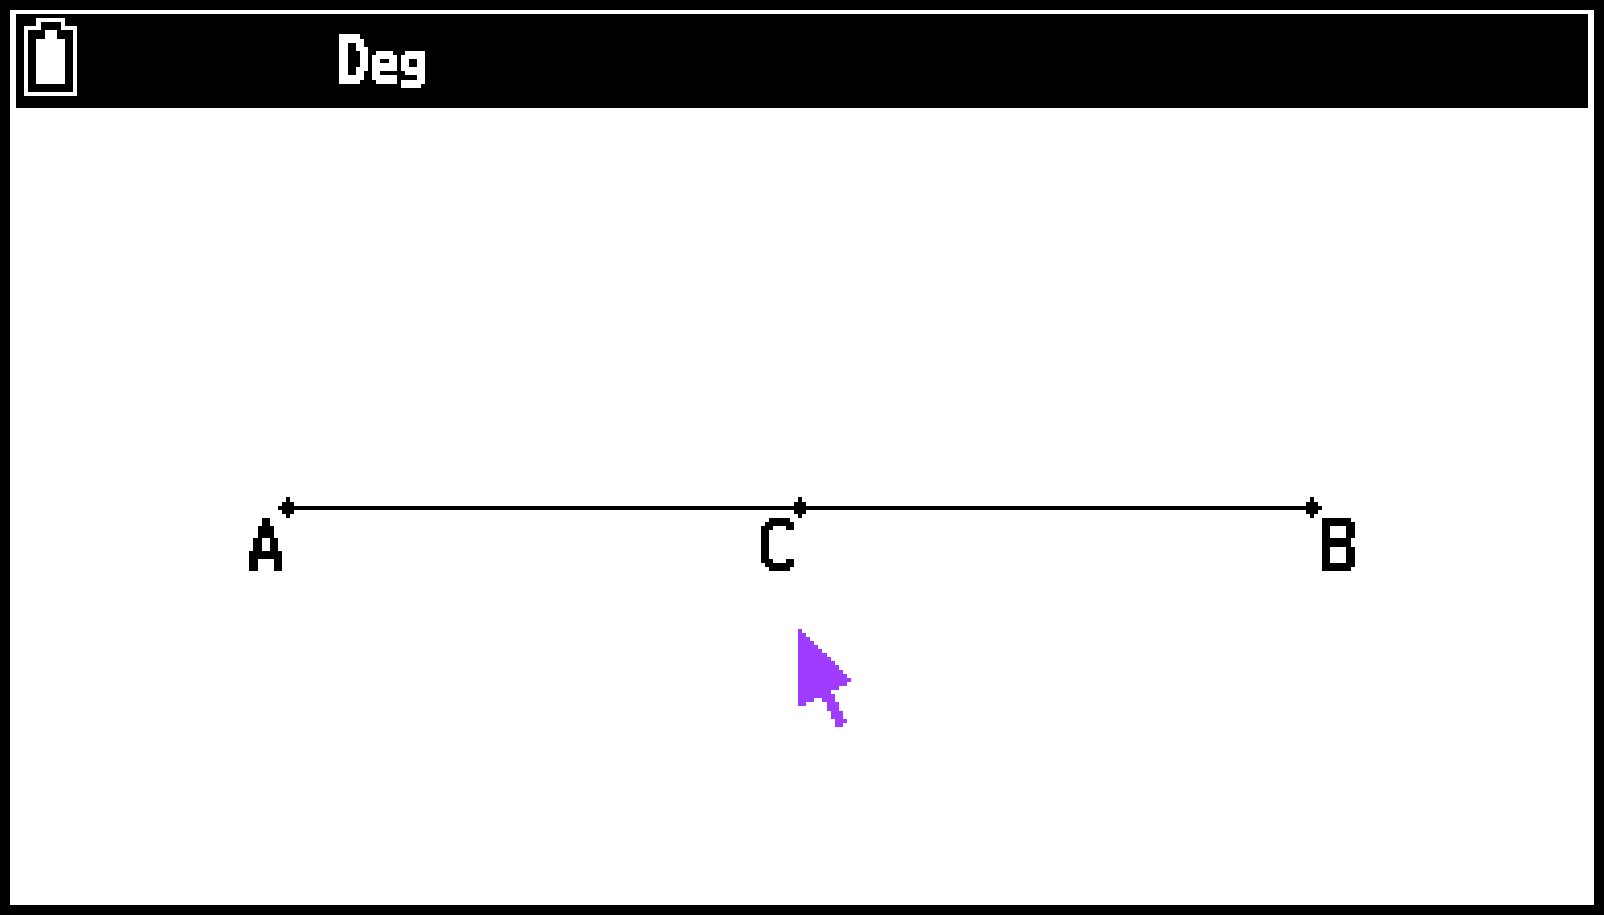
You can use the following procedure to add a labeled point to an existing line, to a side of a polygon, to the periphery of a circle, etc.
-
Select T > [Draw] > [Point].
-
Move the pointer on the screen towards the line where you want to add the labeled point, and then press O.
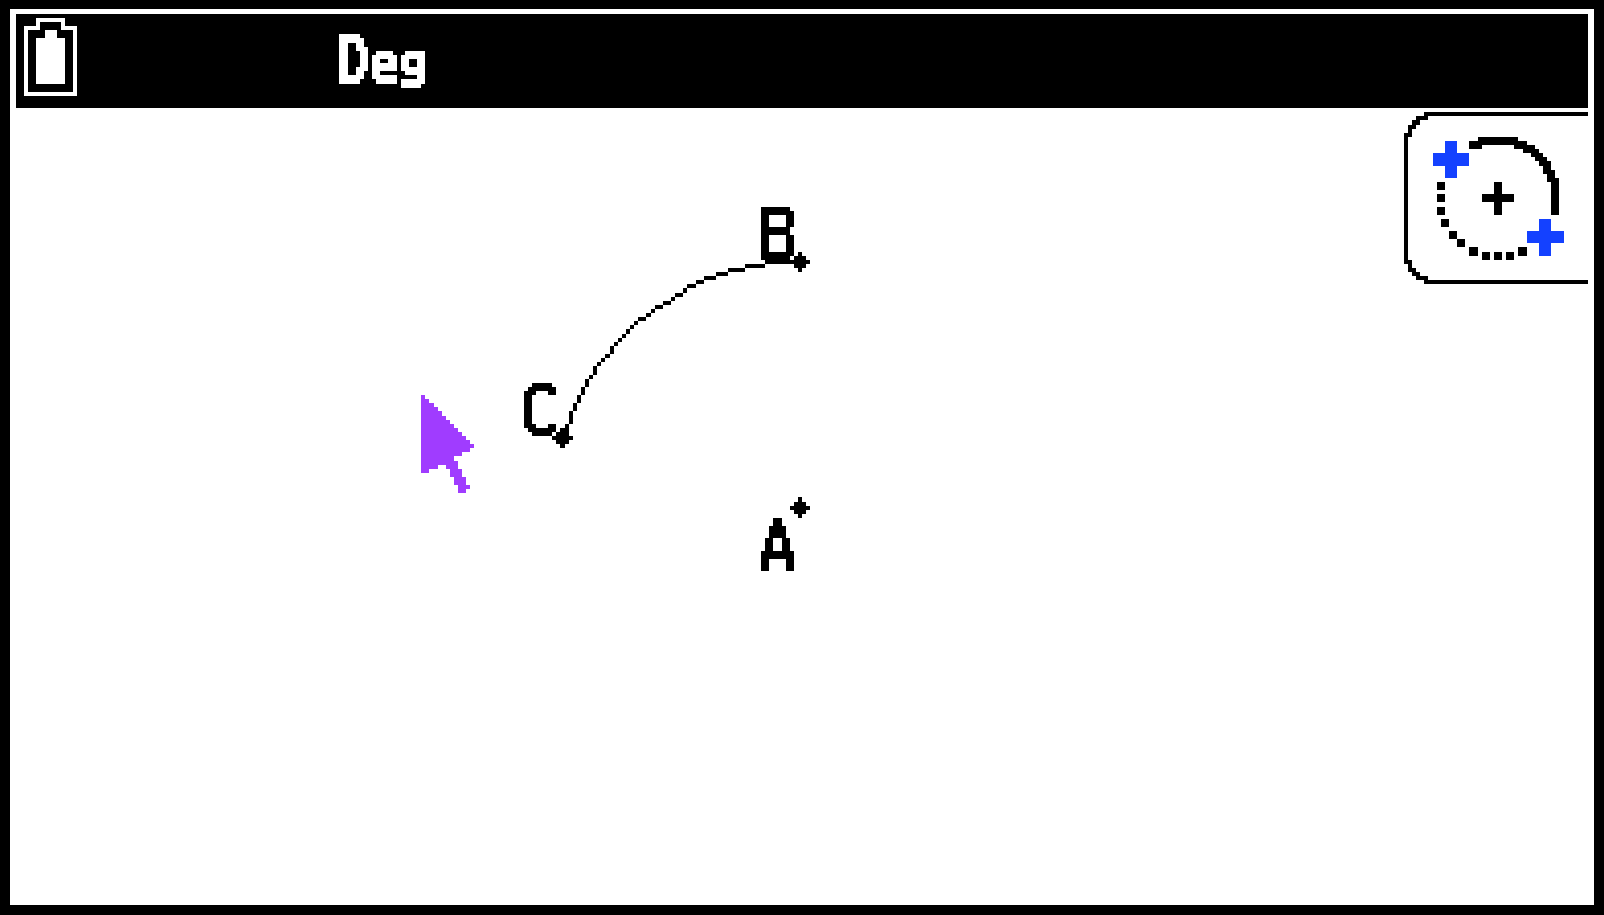
Example 2: To draw an arc
-
Select T > [Draw] > [Arc].
-
Move the pointer to the location where you want the center point of the arc to be and then press O.
-
Move the pointer to the location where you want the start point of the arc to be and then press O.
-
Move the pointer and the line segment to the location where you want the end point of the arc to be.
-
Press O.
-
Press b to deselect the Arc tool.
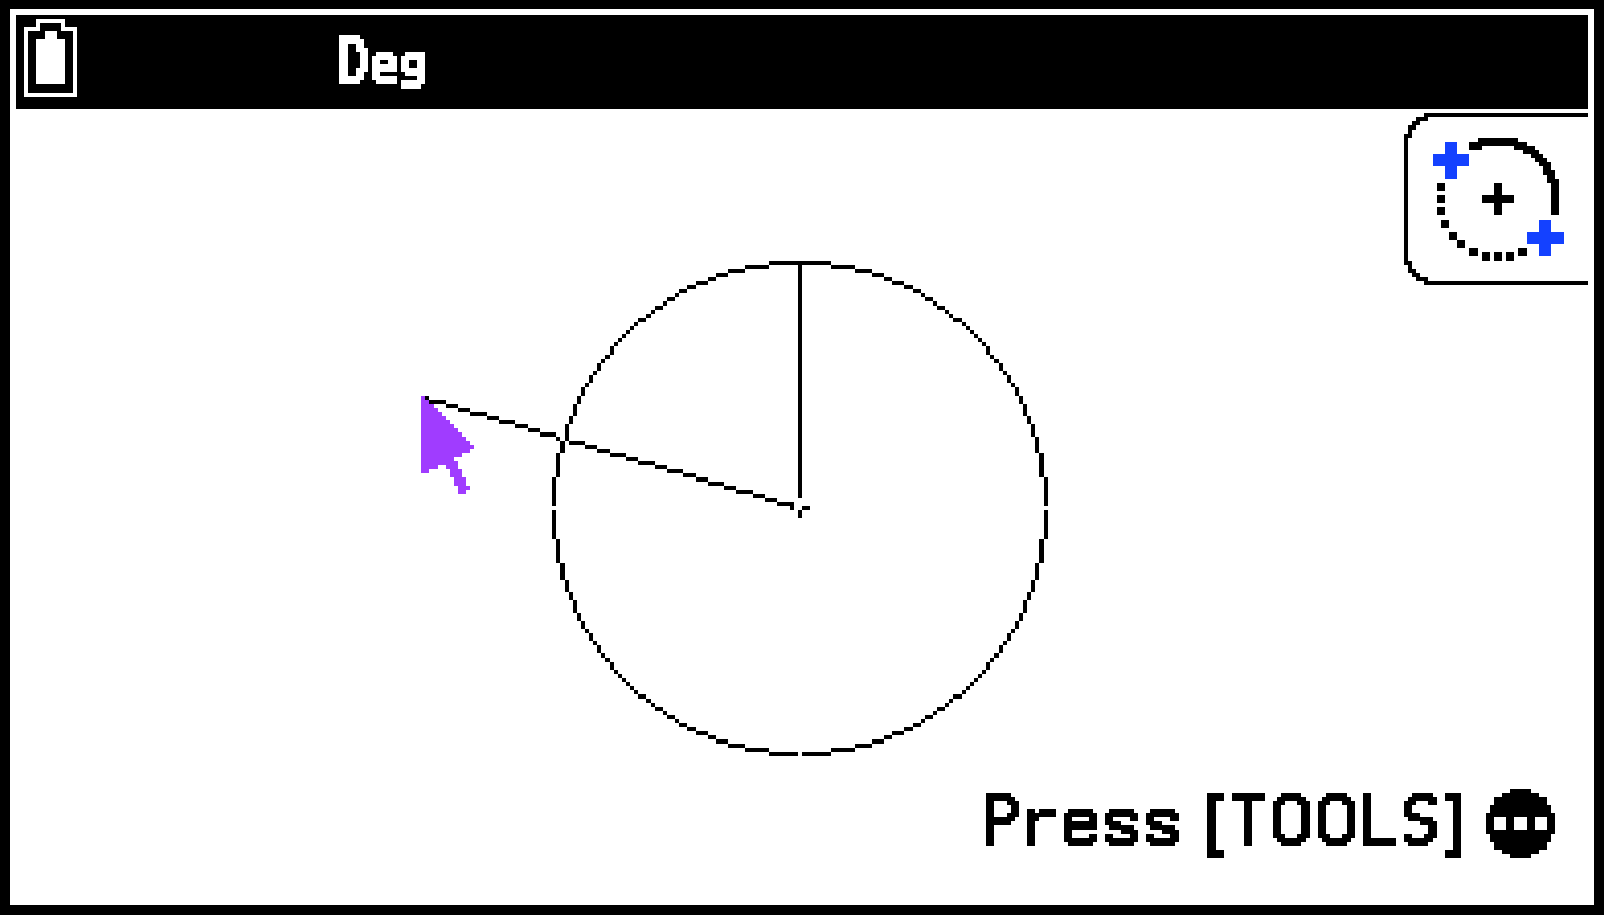
This draws an arc from the start point to the end point, in a counterclockwise direction.
Using the Draw Special Menu
The Draw Special menu contains menu items for drawing triangles, rectangles, and polygons, as well as menu items for drawing graphs based on the input functions.
|
To do this: |
Select this menu item: |
And then specify these points:*1 |
|---|---|---|
|
Draw a triangle |
T > [Draw Special] > [Triangle] |
Two points in different locations*2 |
|
Draw an isosceles triangle |
T > [Draw Special] > [Isosceles Triangle] |
|
|
Draw a rectangle |
T > [Draw Special] > [Rectangle] |
|
|
Draw a square |
T > [Draw Special] > [Square] |
|
|
Draw a polygon |
T > [Draw Special] > [Polygon] |
At least three points in different locations*3 |
|
To do this: |
Select this menu item: |
And then perform this operation: |
|---|---|---|
|
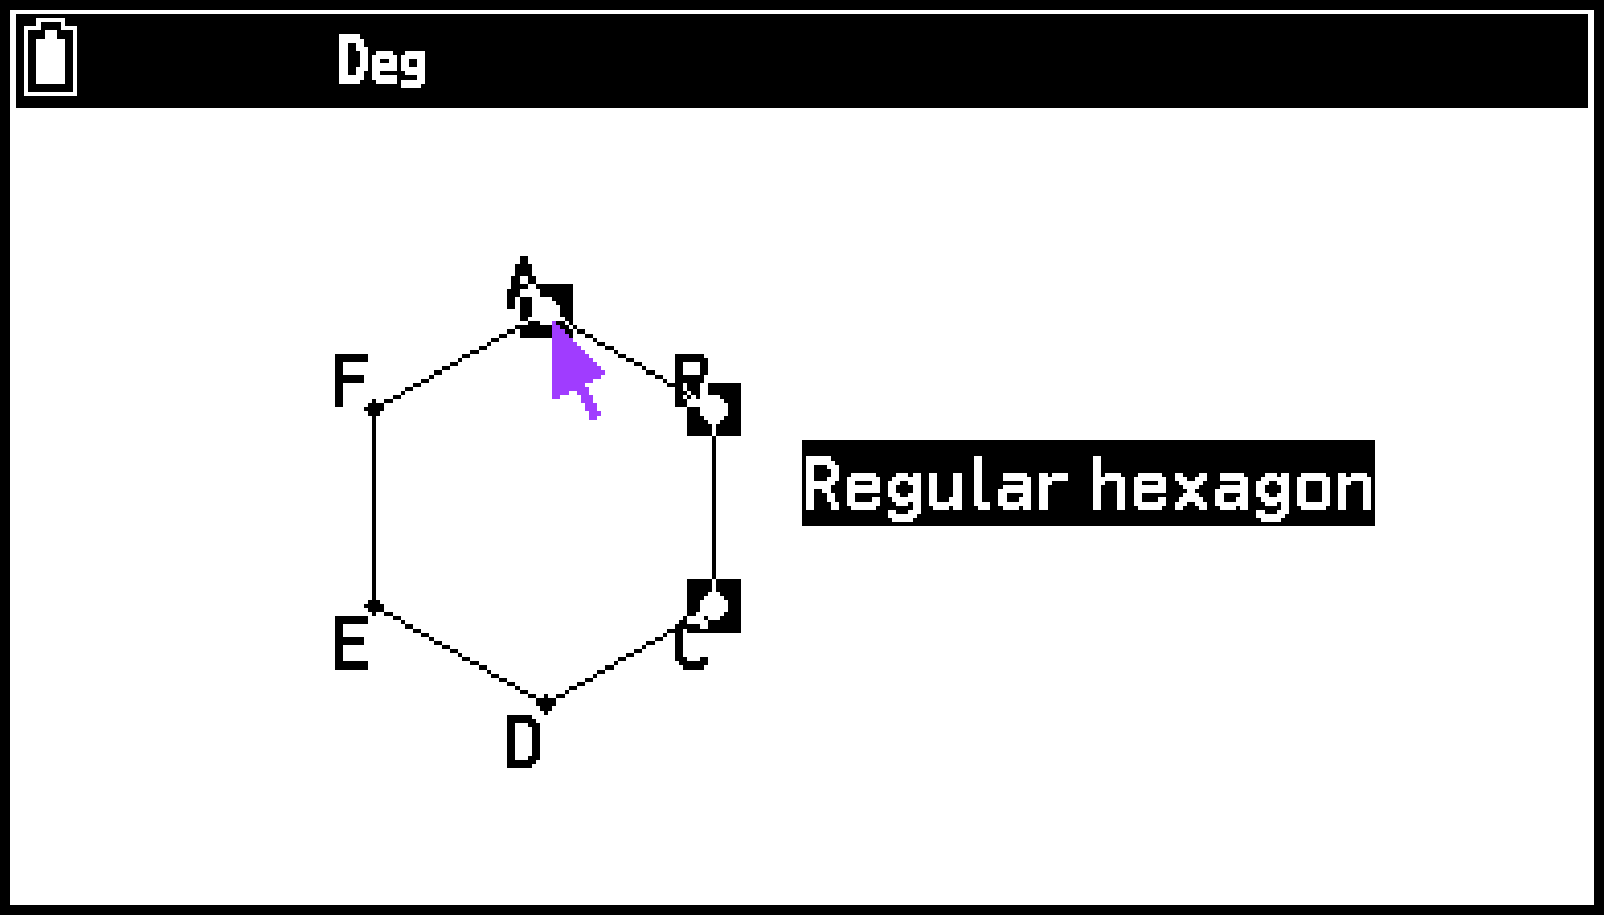
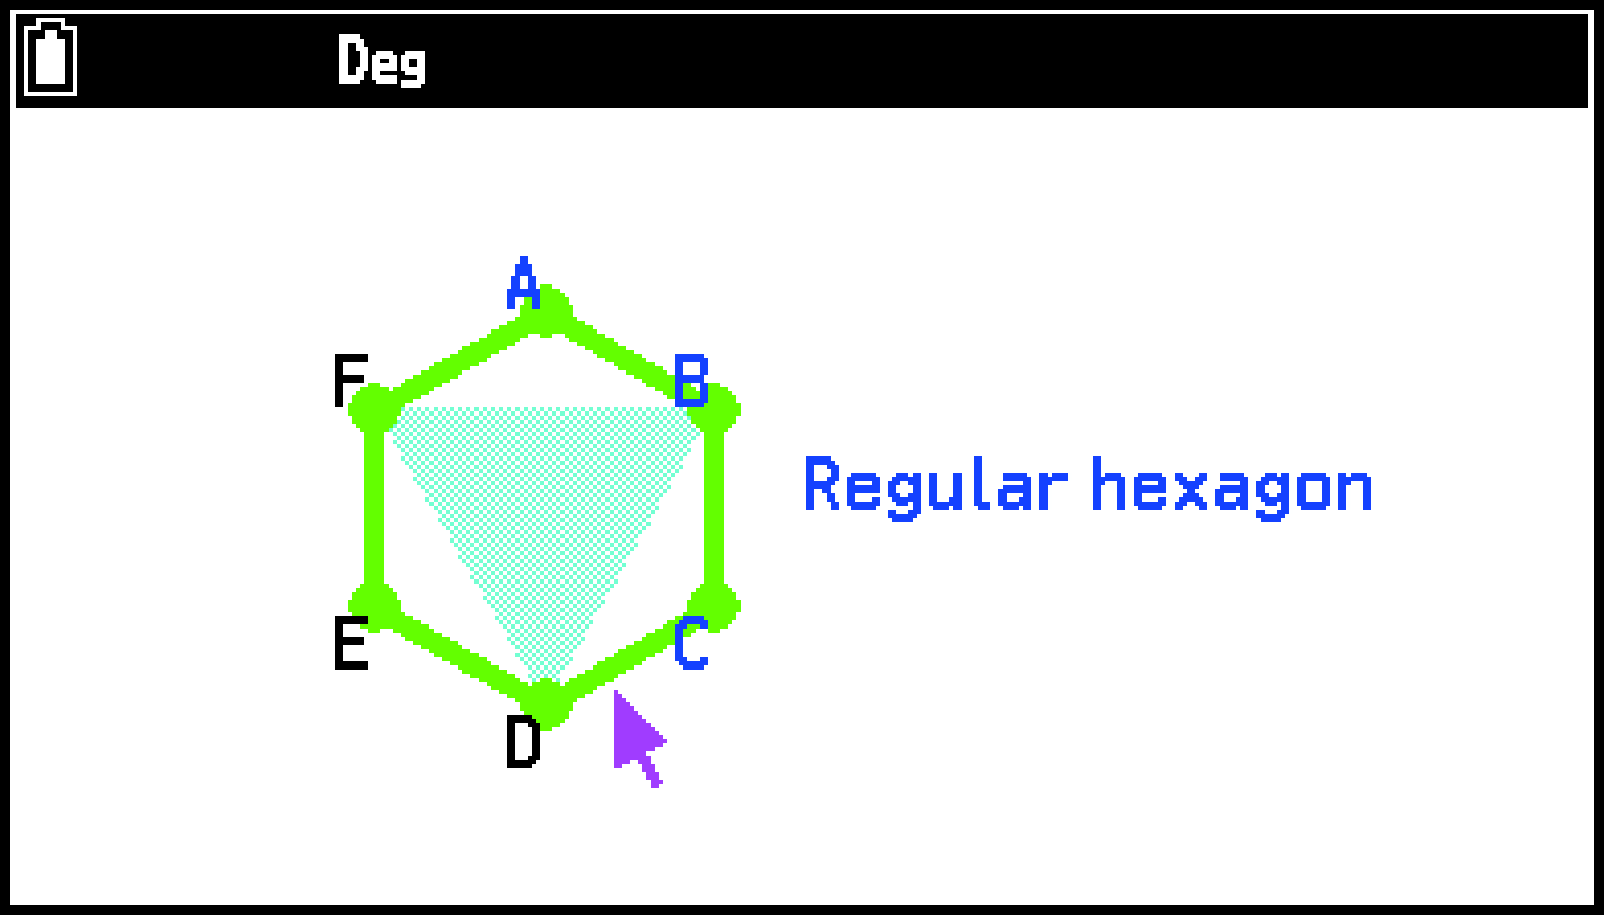
Draw a regular n-gon |
T > [Draw Special] > [Regular n-gon] |
In the dialog that appears, input an integer from 3 to 12 and then press O. |
|
Draw a function graph |
T > [Draw Special] > [Function f()] |
In the dialog that appears, enter a function in the form and then press O.*4 |
To specify a single point, move the pointer to the desired location and then press O.
See the Example 1 below.
See the Example 2 below.
The angle unit of the graph that is drawn is always Radian, regardless of the Angle setting on the Settings menu.
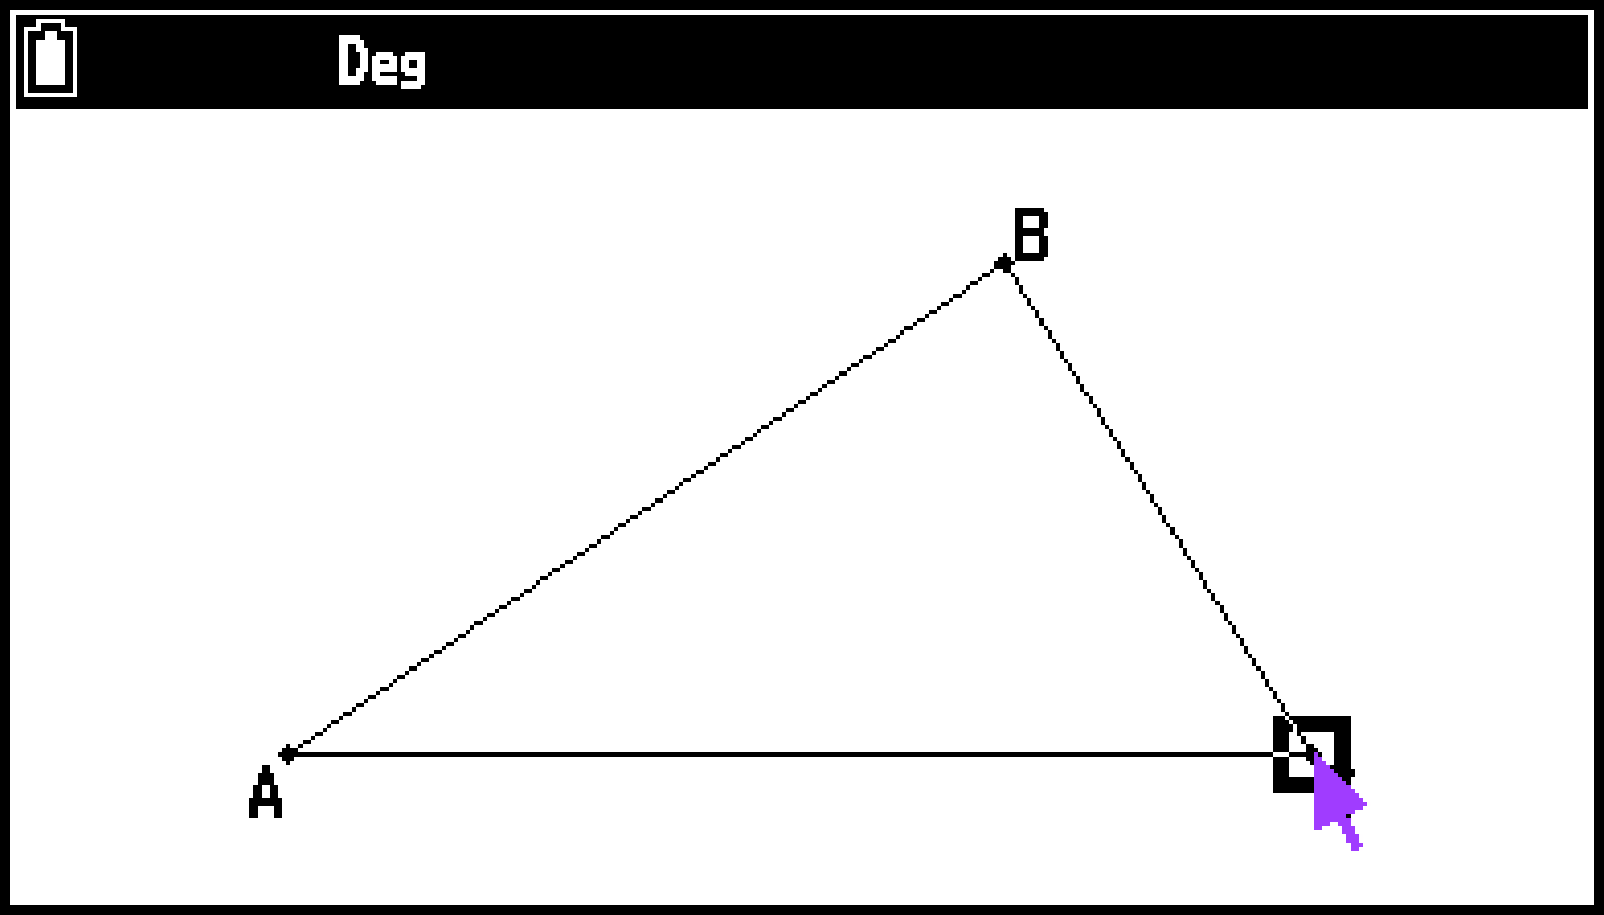
Example 1: To draw a triangle
-
Select T > [Draw Special] > [Triangle].
-
Move the pointer to any location on the screen and then press O.
-
Move the pointer to another location.
-
Press O.
This causes a selection boundary to appear, indicating the size of the triangle to be drawn.
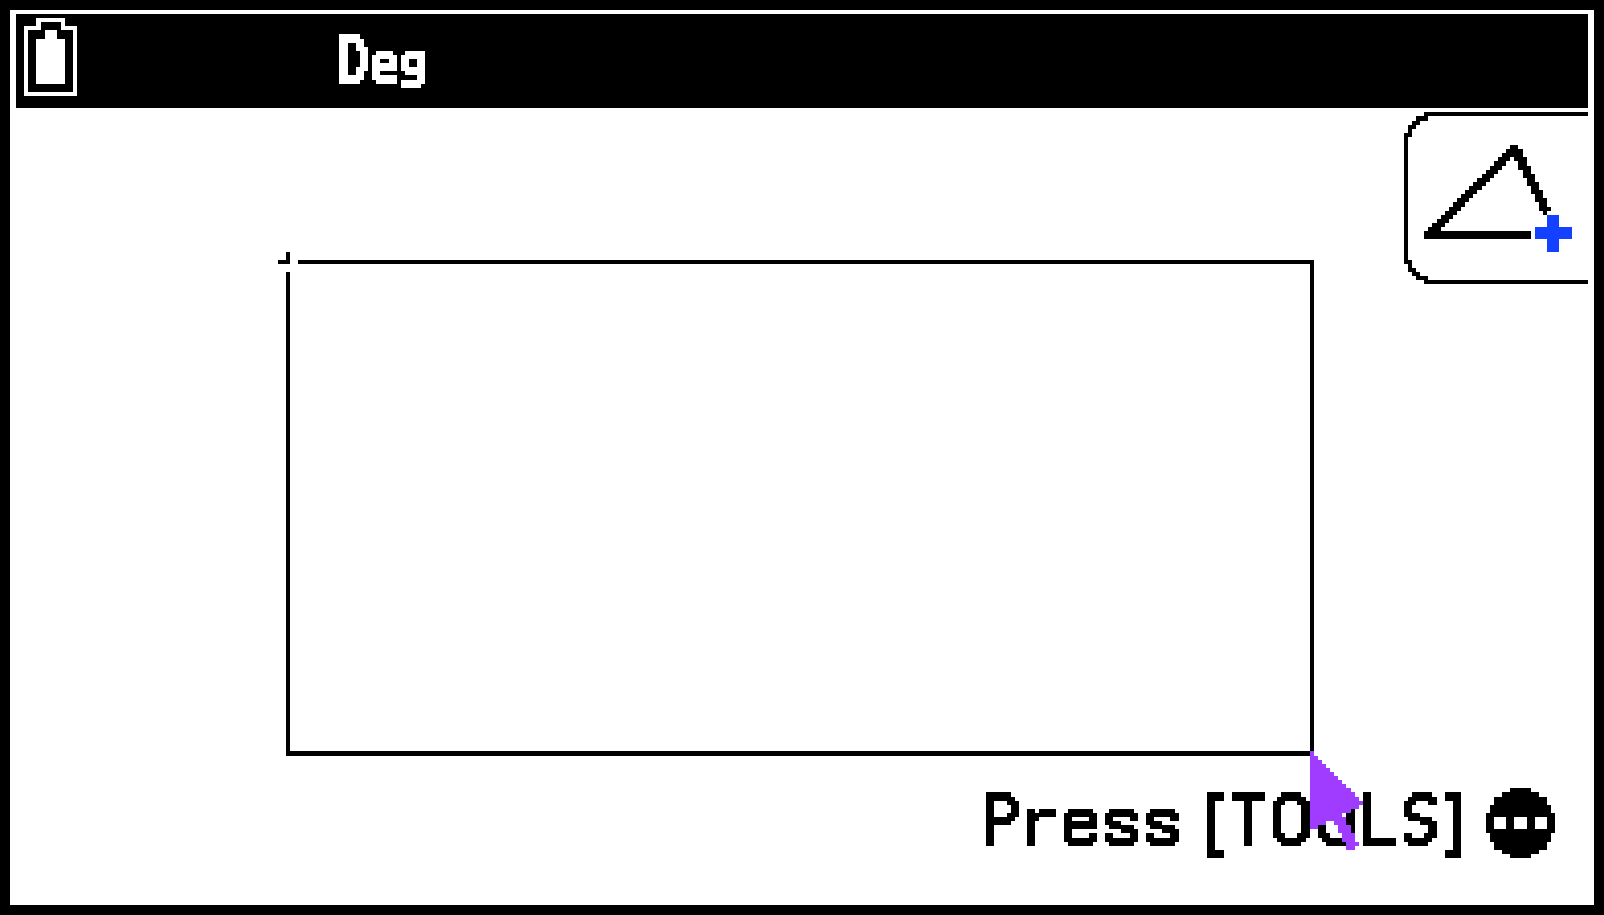
This draws a triangle.
Note
The same type of two-point selection boundary in the above procedure is also used when drawing an isosceles triangle, rectangle, square, or regular n-gon.
In each case, the resulting object is the maximum size that fits in the screen if the second point specified is too close to or at the same location as the first point.
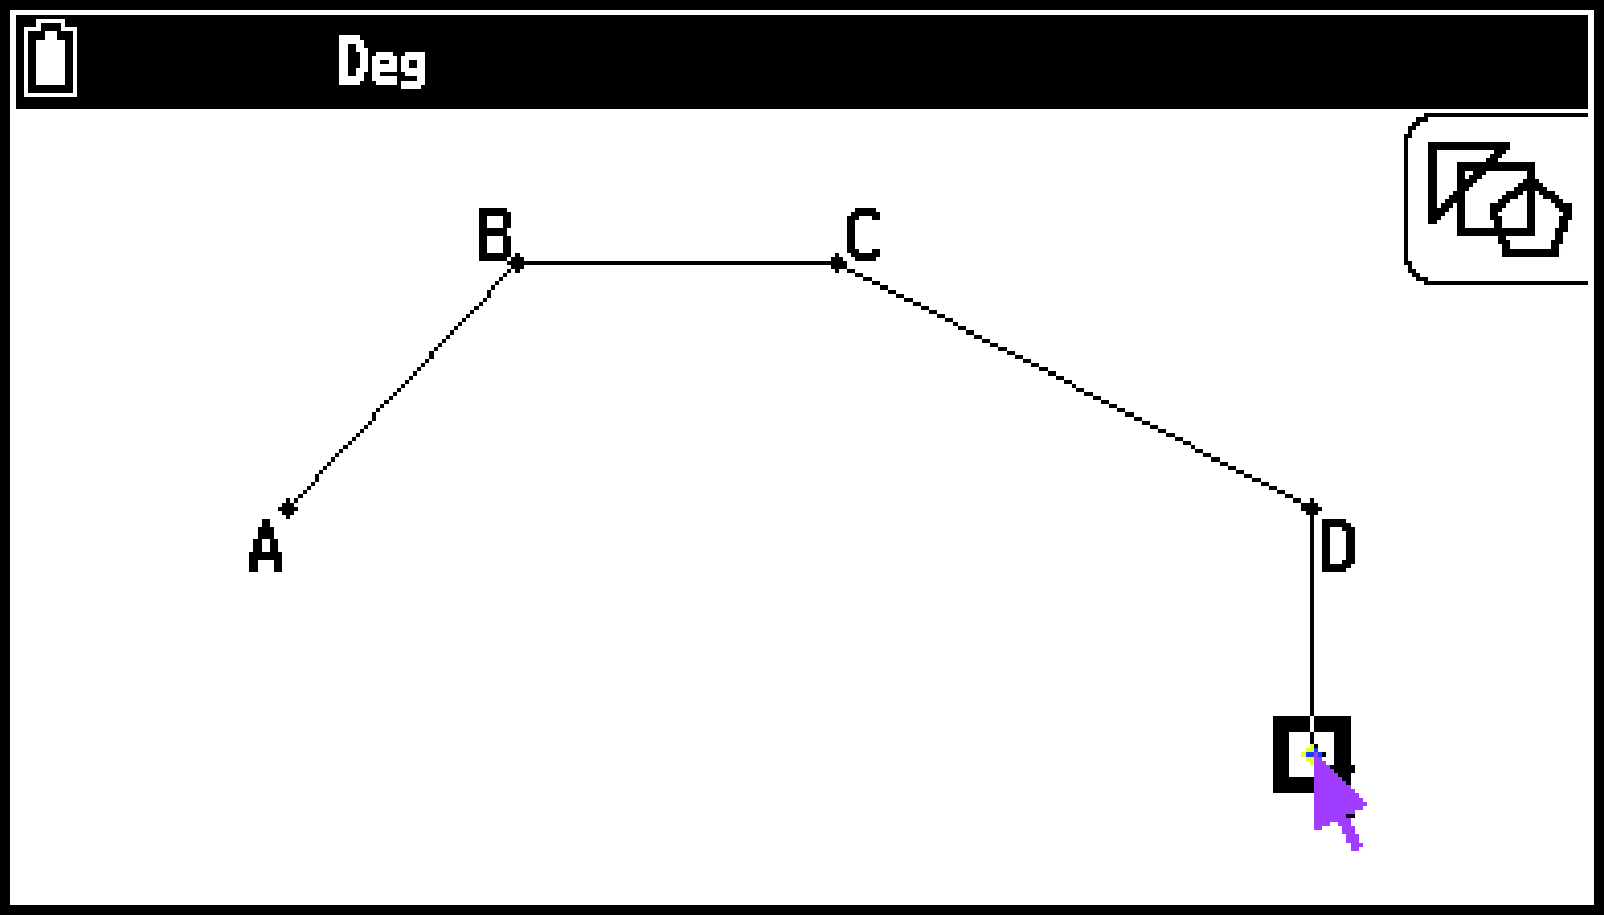
Example 2: To draw a polygon
-
Select T > [Draw Special] > [Polygon].
-
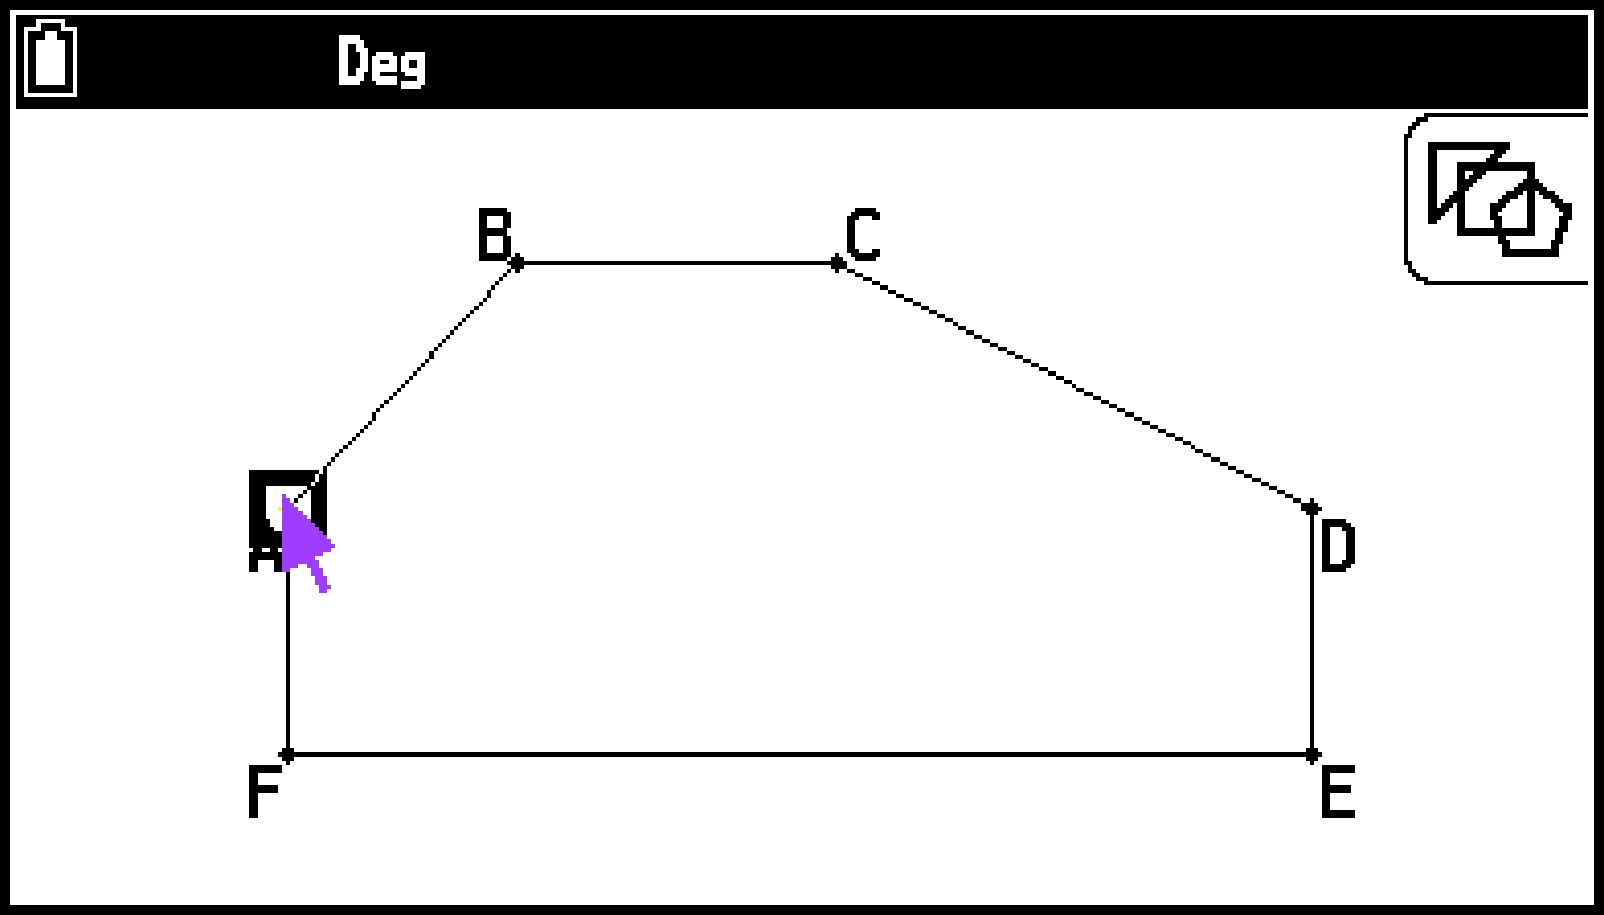
Move the pointer to the location where you want a vertex of the polygon to be and then press O.
-
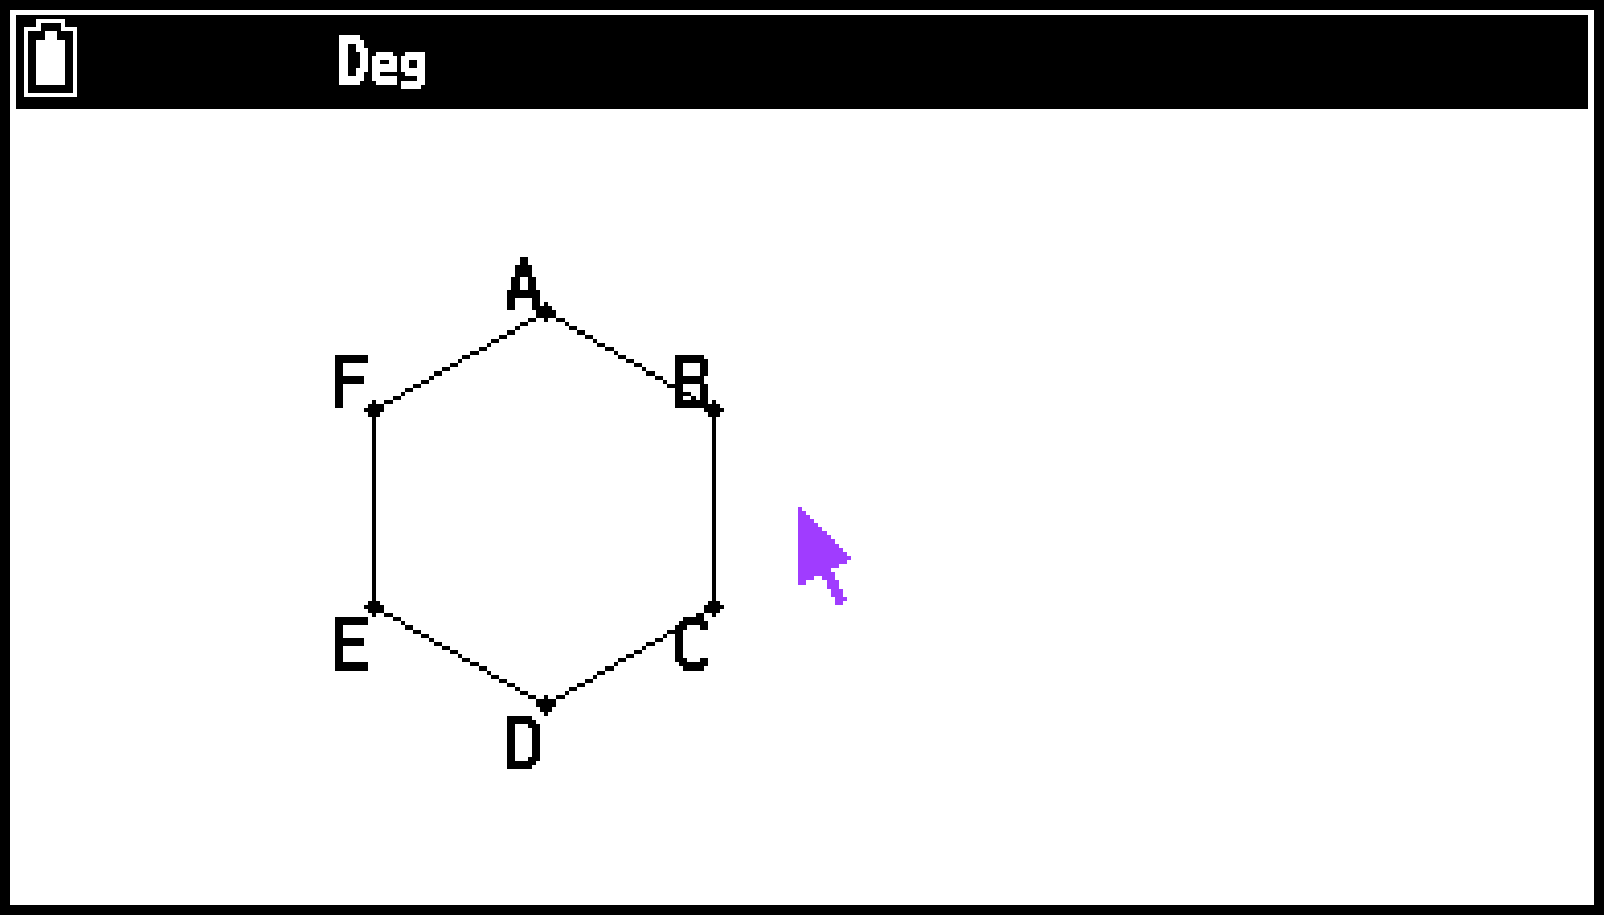
To complete the polygon, move the pointer to the location of the first vertex and then press O.
-
Press b to deselect the Polygon tool.
Repeat this step as many times as required to specify the other vertices of the polygon.
If you press b without performing the operation in step 3 above, the figure is finalized as-is, resulting in an unclosed non-polygon.
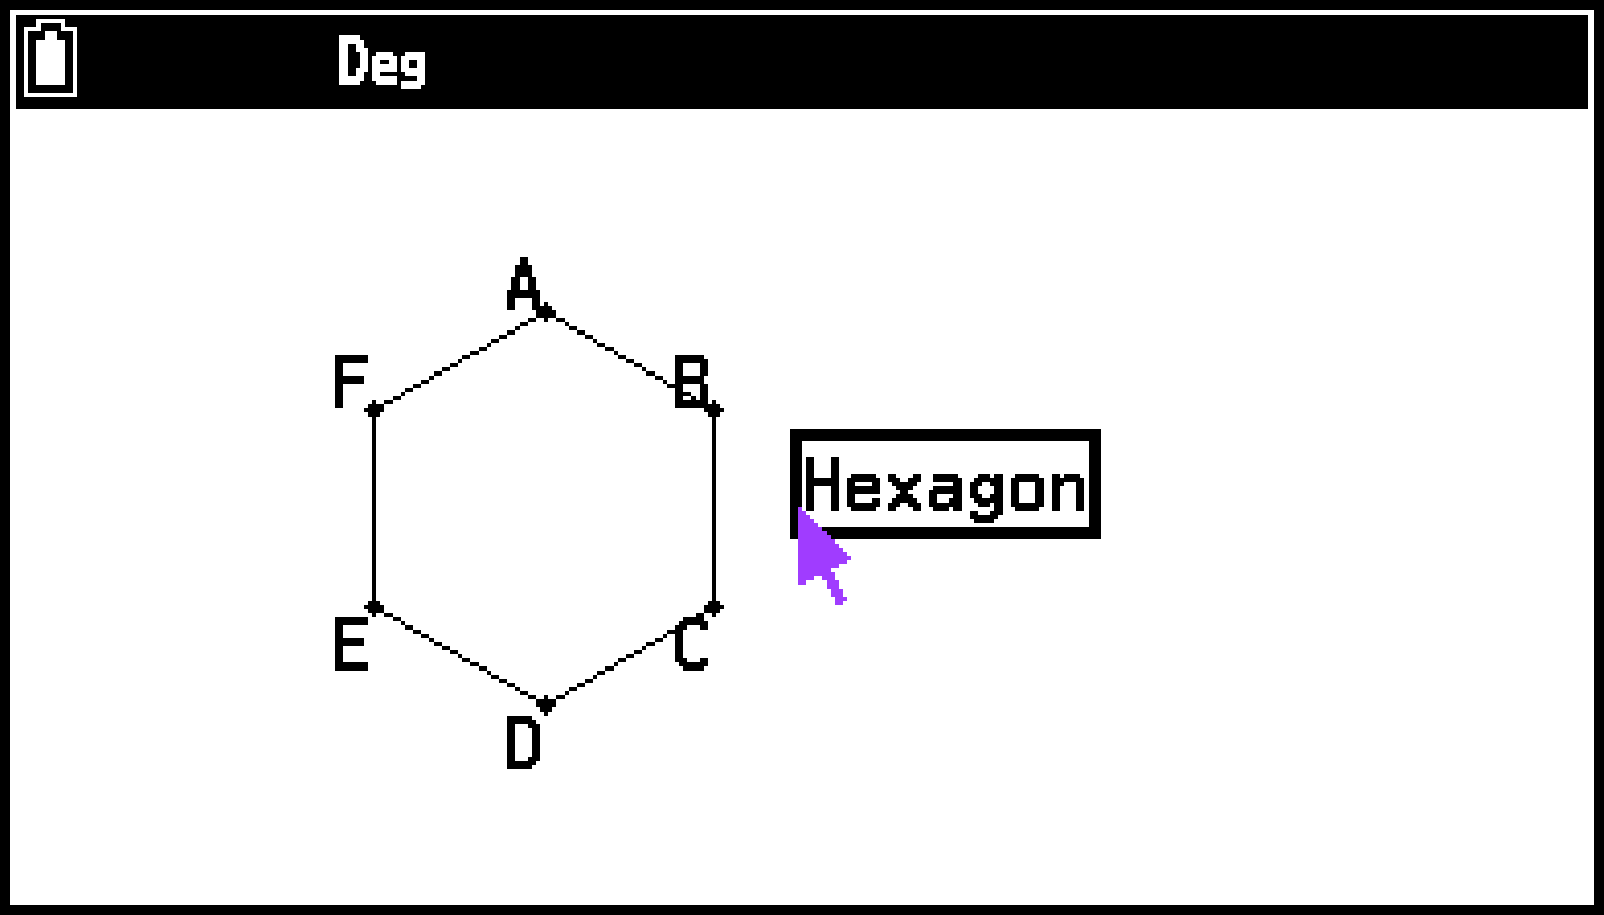
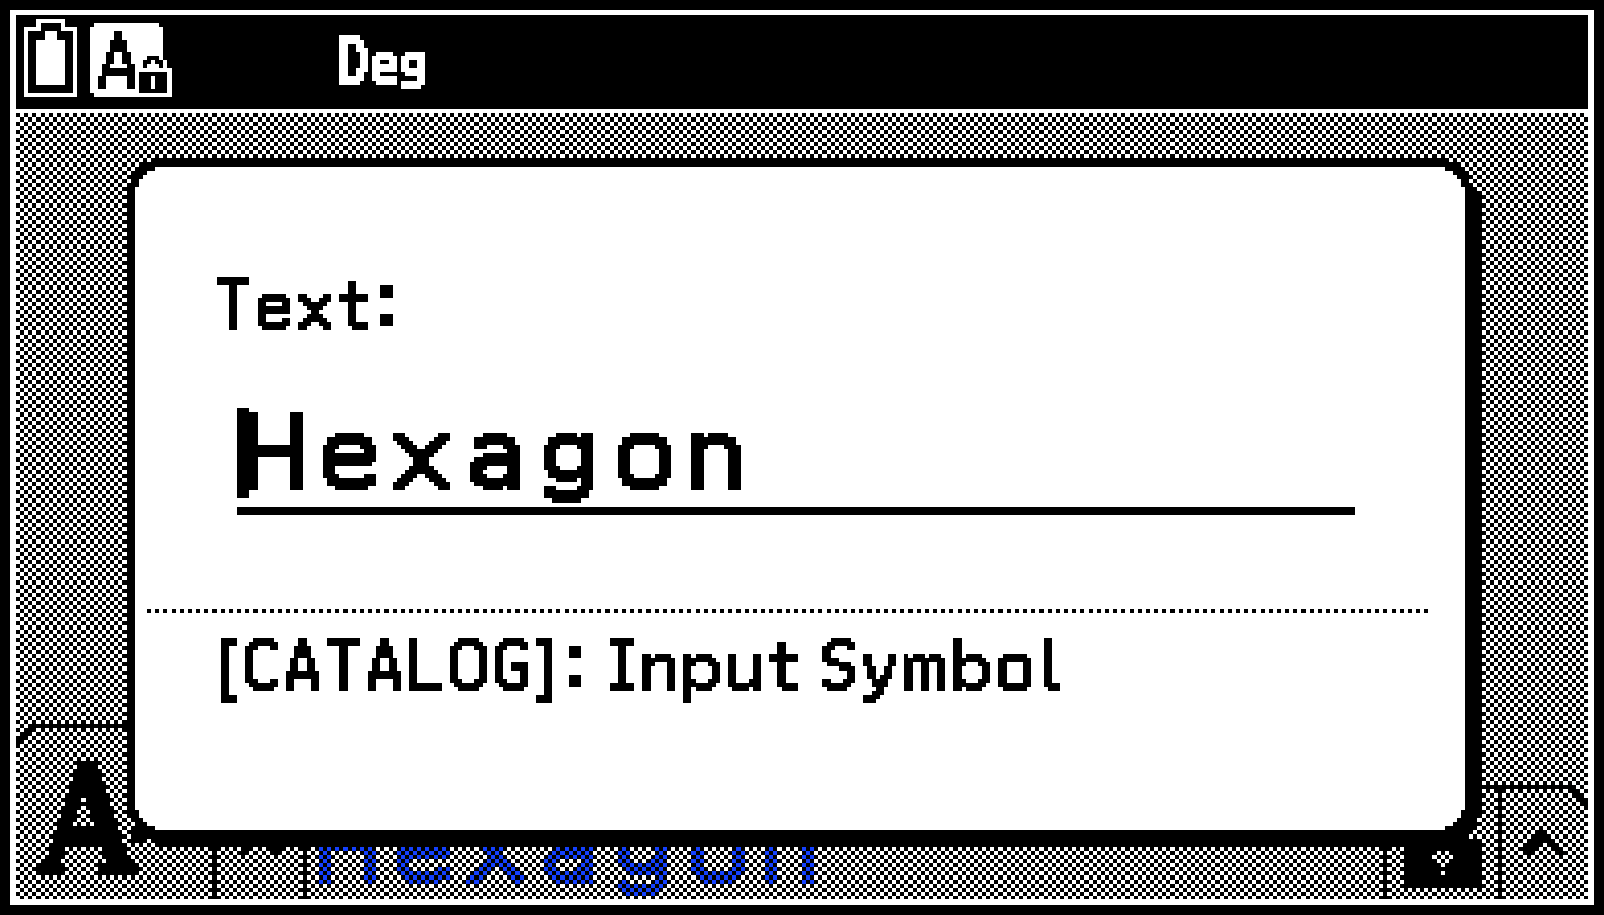
Inserting Text into Screen Images
To insert text into a screen image
-
Move the pointer to the location where you want to insert the text.
-
Select T > [Option] > [Text].
-
Input up to 31 characters of text and then press O.
This displays a text input dialog box and automatically switches the calculator’s keys to alpha lock.
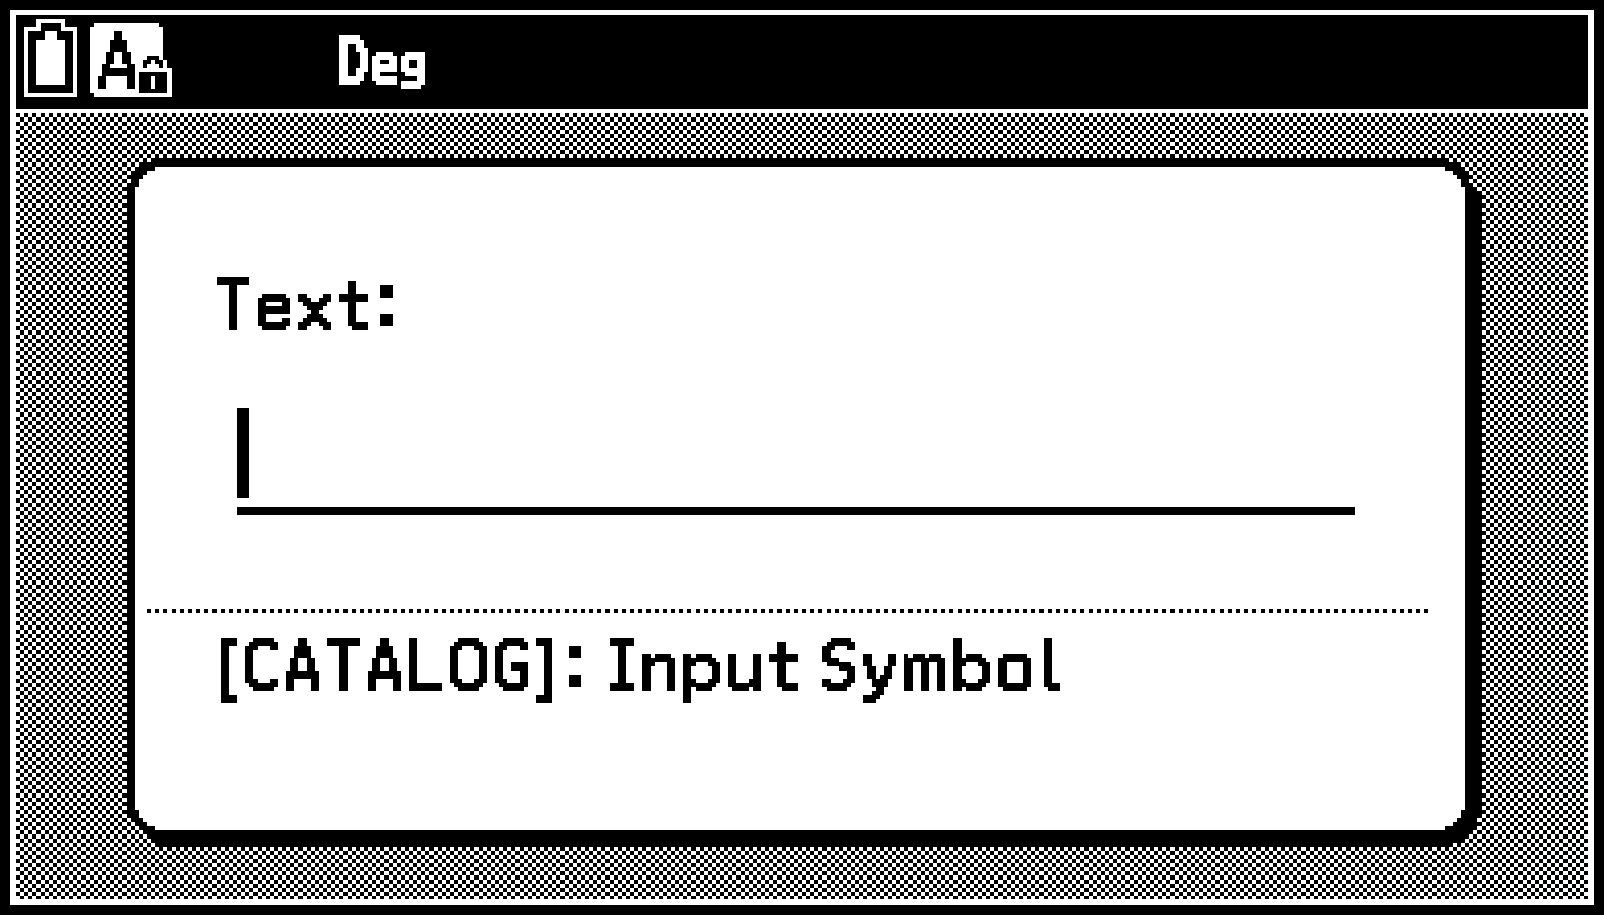
The text you input is inserted into the screen image at the location of the pointer.
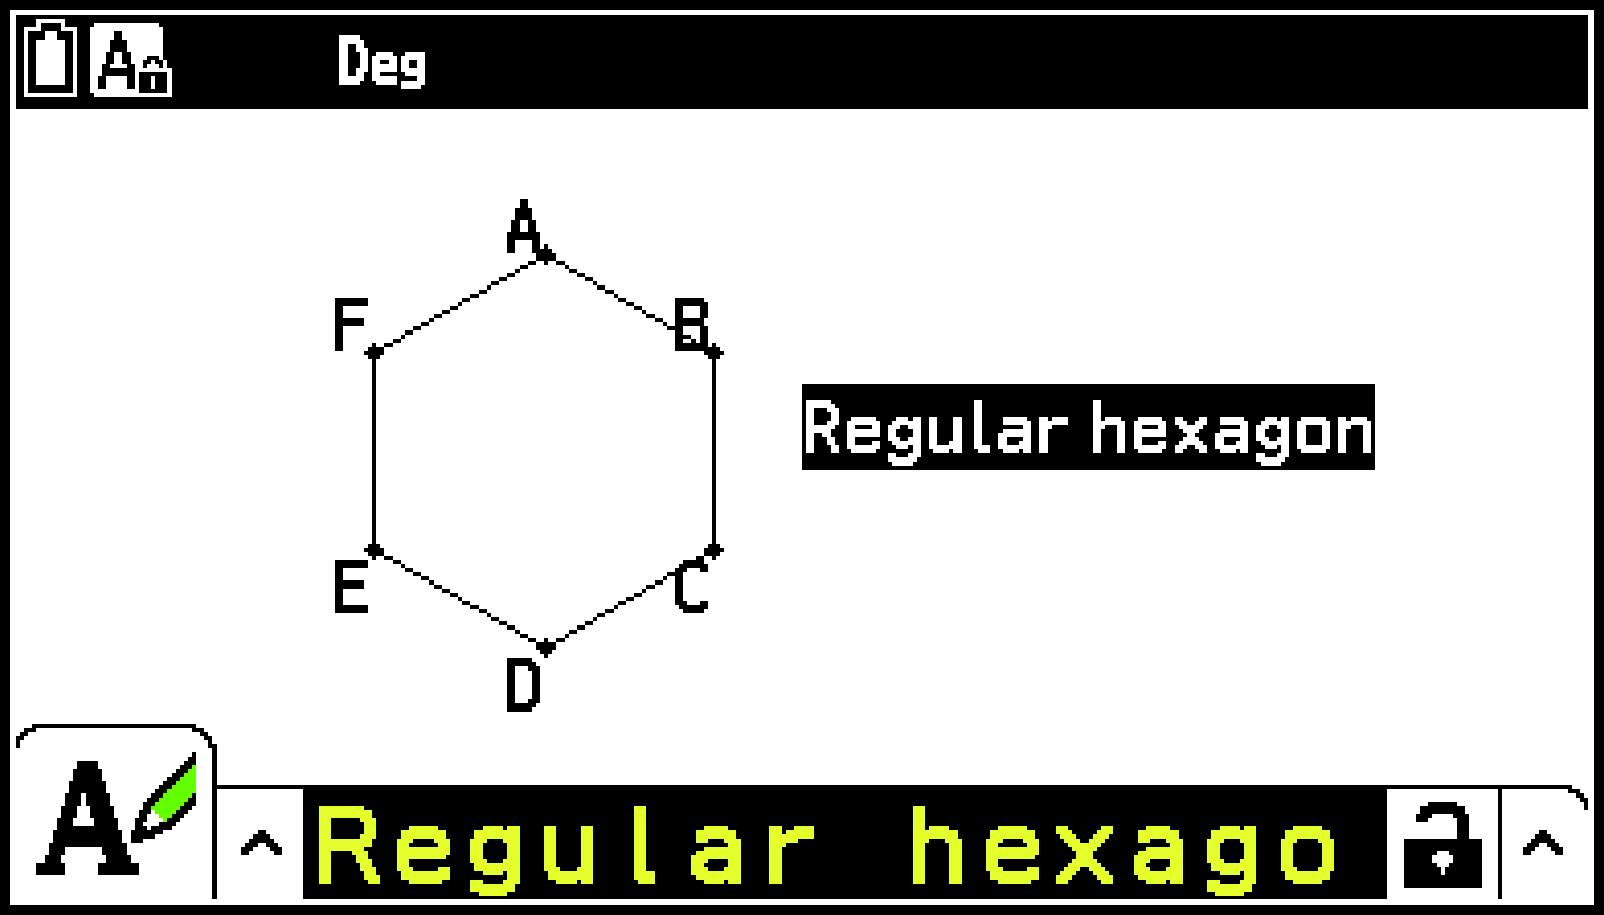
To edit screen text
-
Select the text you want to edit.
-
Press V.
-
Press O.
-
Edit the text and then press O.
-
To close the measurement box, press b twice.
This displays the measurement box at the bottom of the screen.
This displays a text input dialog box.
This causes the newly edited text to appear on the screen.
Note
For details about the measurement box, see Using the Measurement Box.
Undoing and Redoing an Operation
To undo the last operation you performed
Immediately after performing the operation, you want to undo, press / or select T > [Edit] > [Undo/Redo].
Note
T > [Edit] > [Clear All] operations cannot be undone. Also, you cannot undo an object select or deselect operation, a T > [View] menu item operation (View Window settings, pan, scroll, zoom operations), or a setting change.
To redo an operation
Immediately after undoing the operation, press / or select T > [Edit] > [Undo/Redo].
Selecting and Deselecting Objects
To edit an object (move, delete, change color, etc.) or to create a drawing using an object (such as constructing a midpoint of a line segment), you first need to select part of or all of the object. This section explains how to select and deselect objects.
Before starting the operations shown in the table below, make sure that no tool icons are displayed in the upper right corner of the screen. If a tool icon is displayed, press b or a to deselect the tool.
|
To do this: |
Perform this operation: |
|---|---|
|
Select a particular object |
This causes one or more This causes 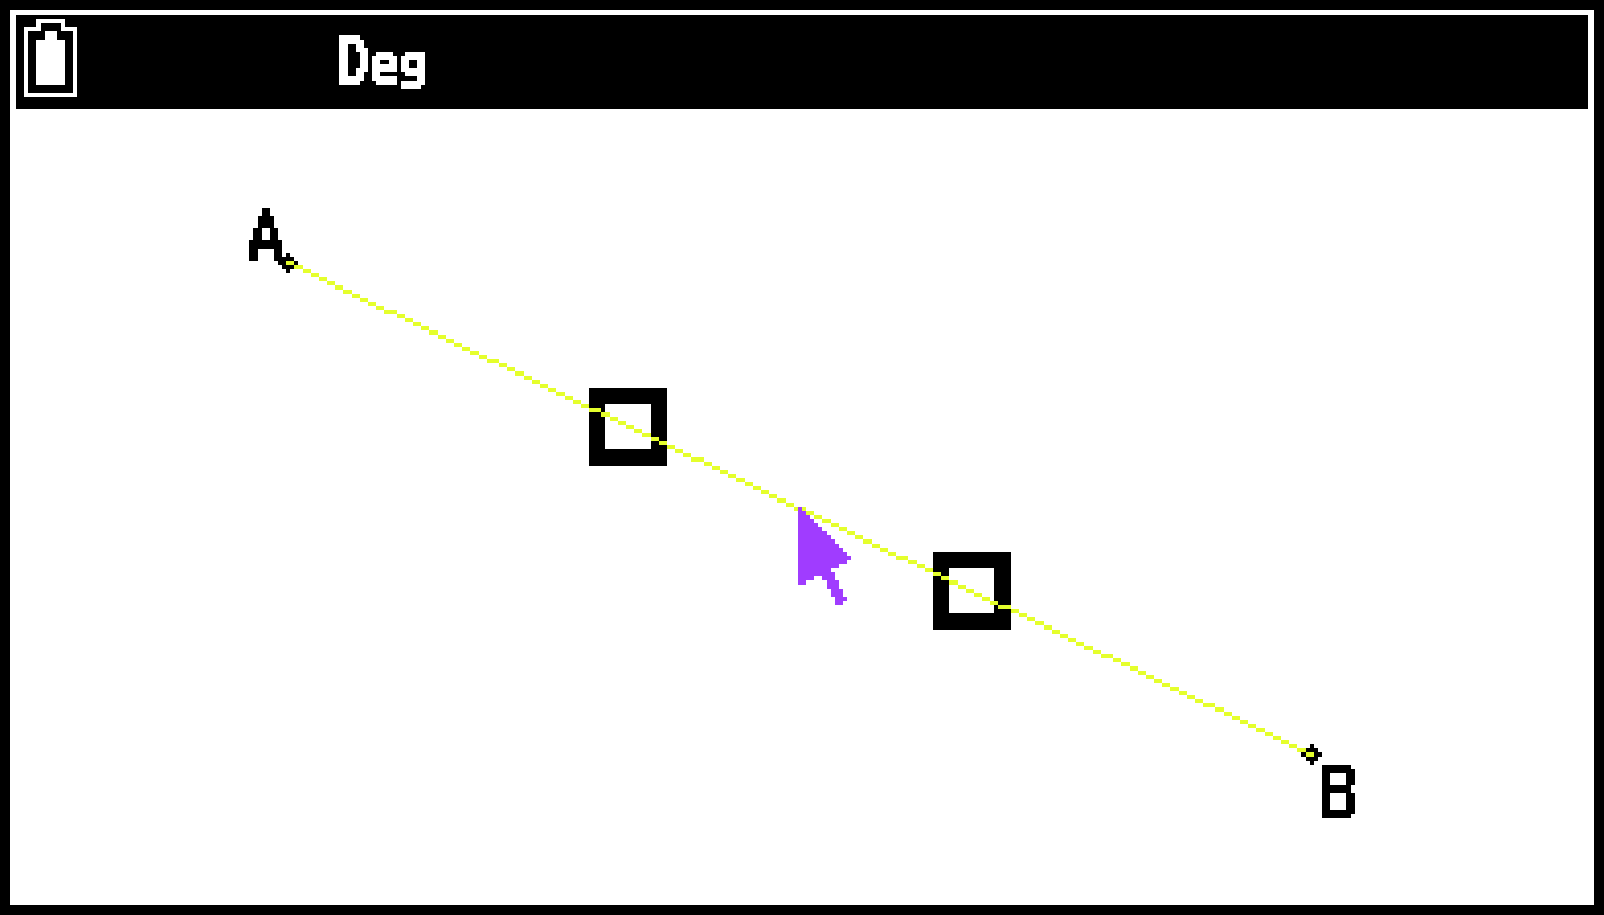 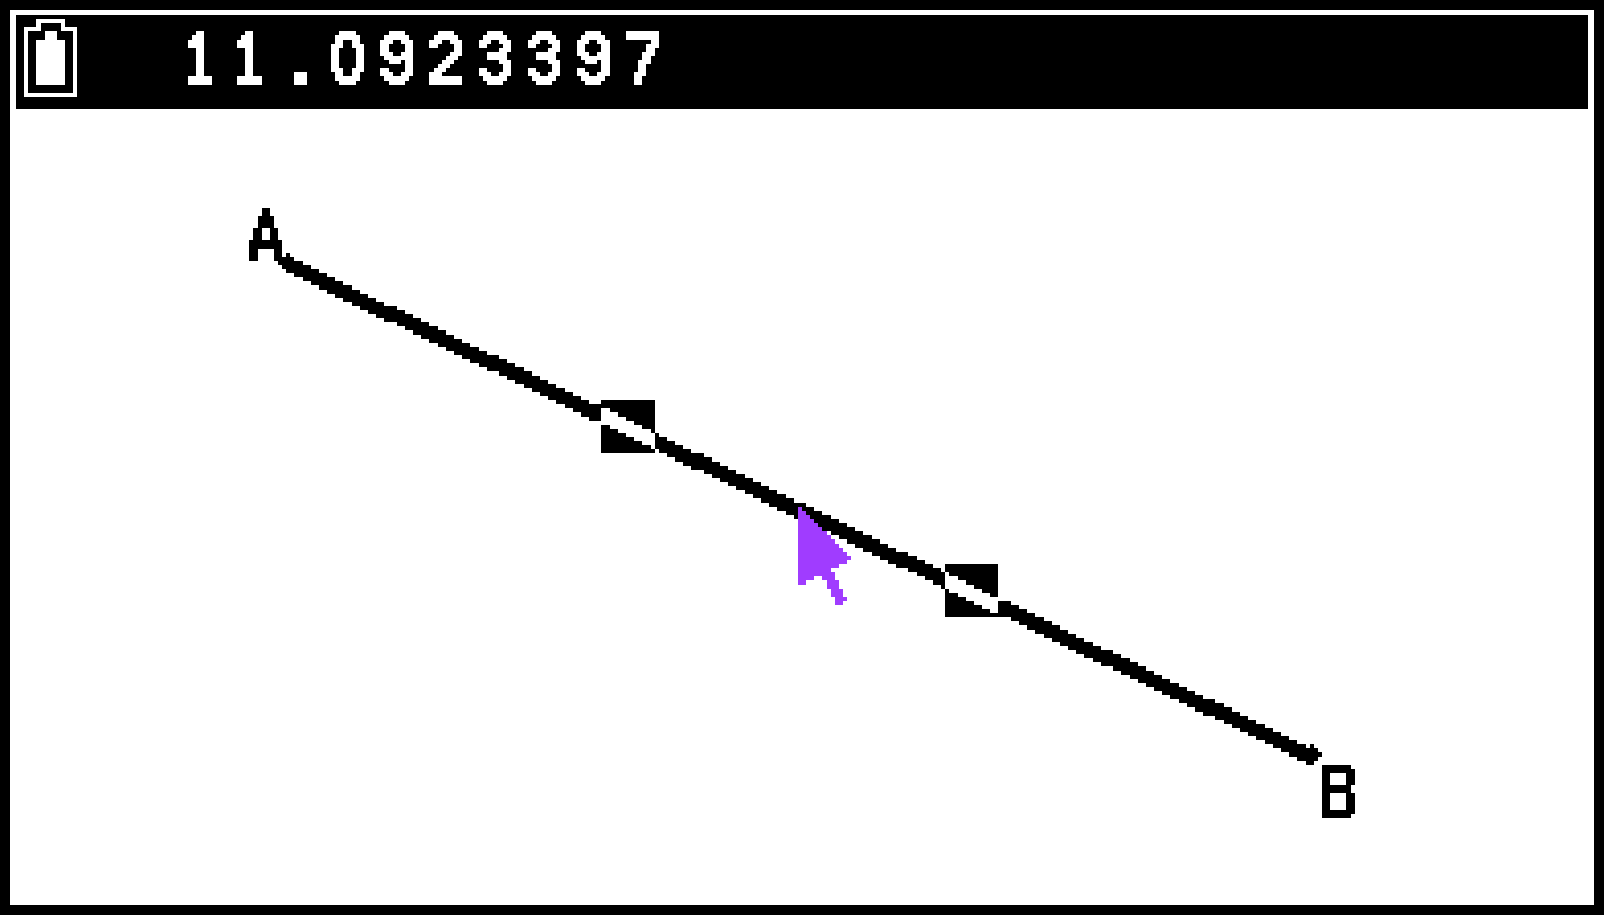 Now you can repeat steps 2 and 3 to select other objects if you want. |
|
Select an entire polygon |
This causes This selects the entire polygon. 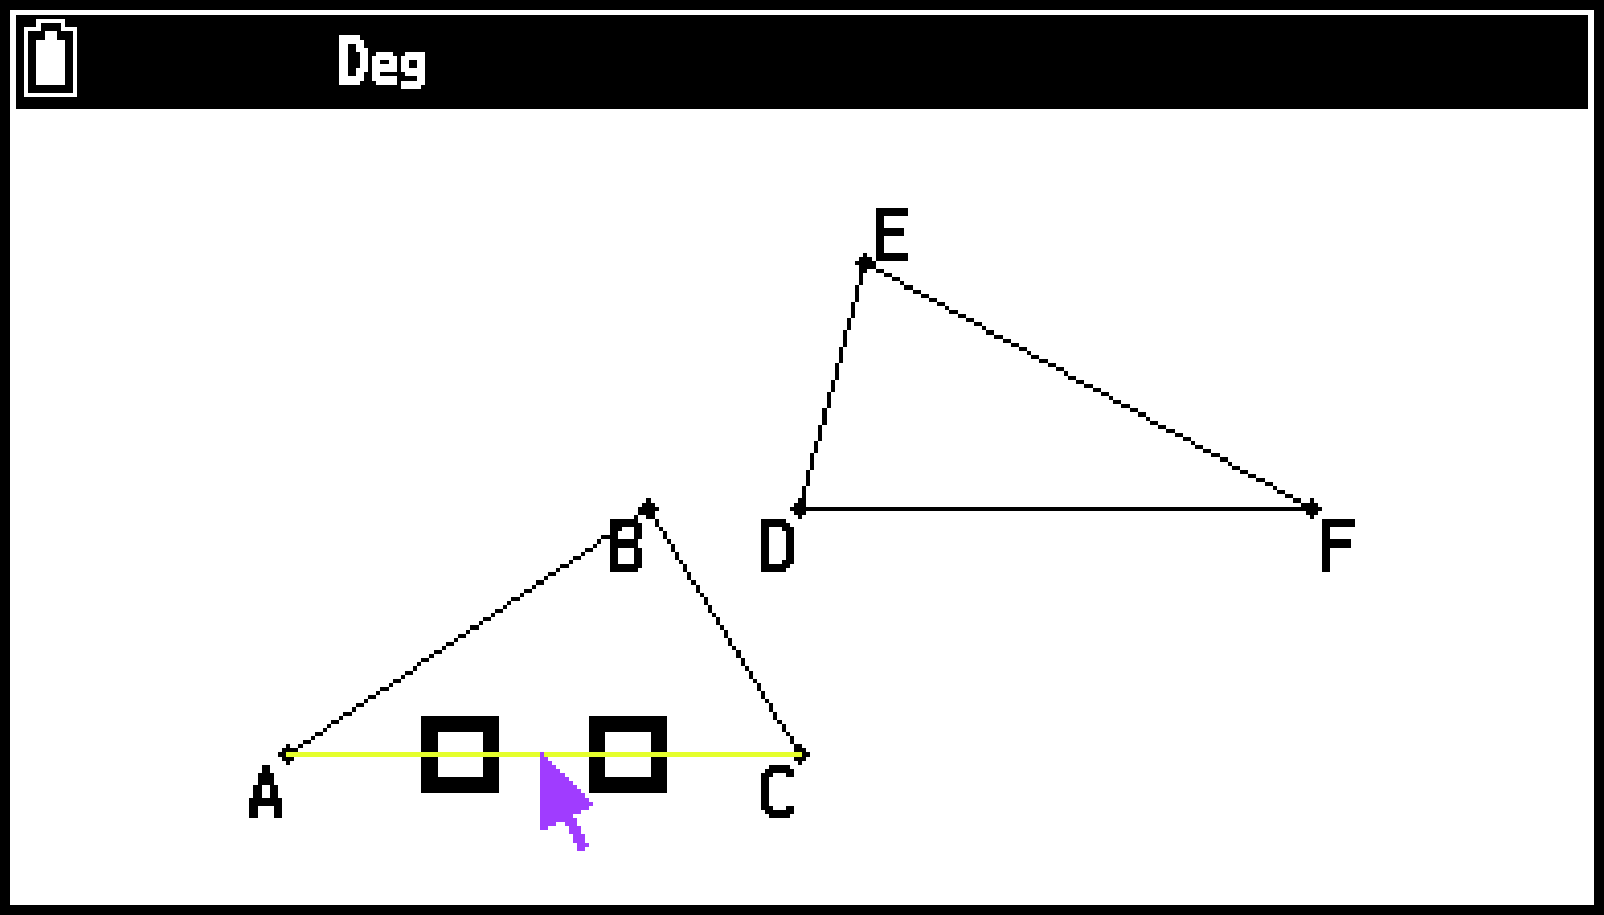 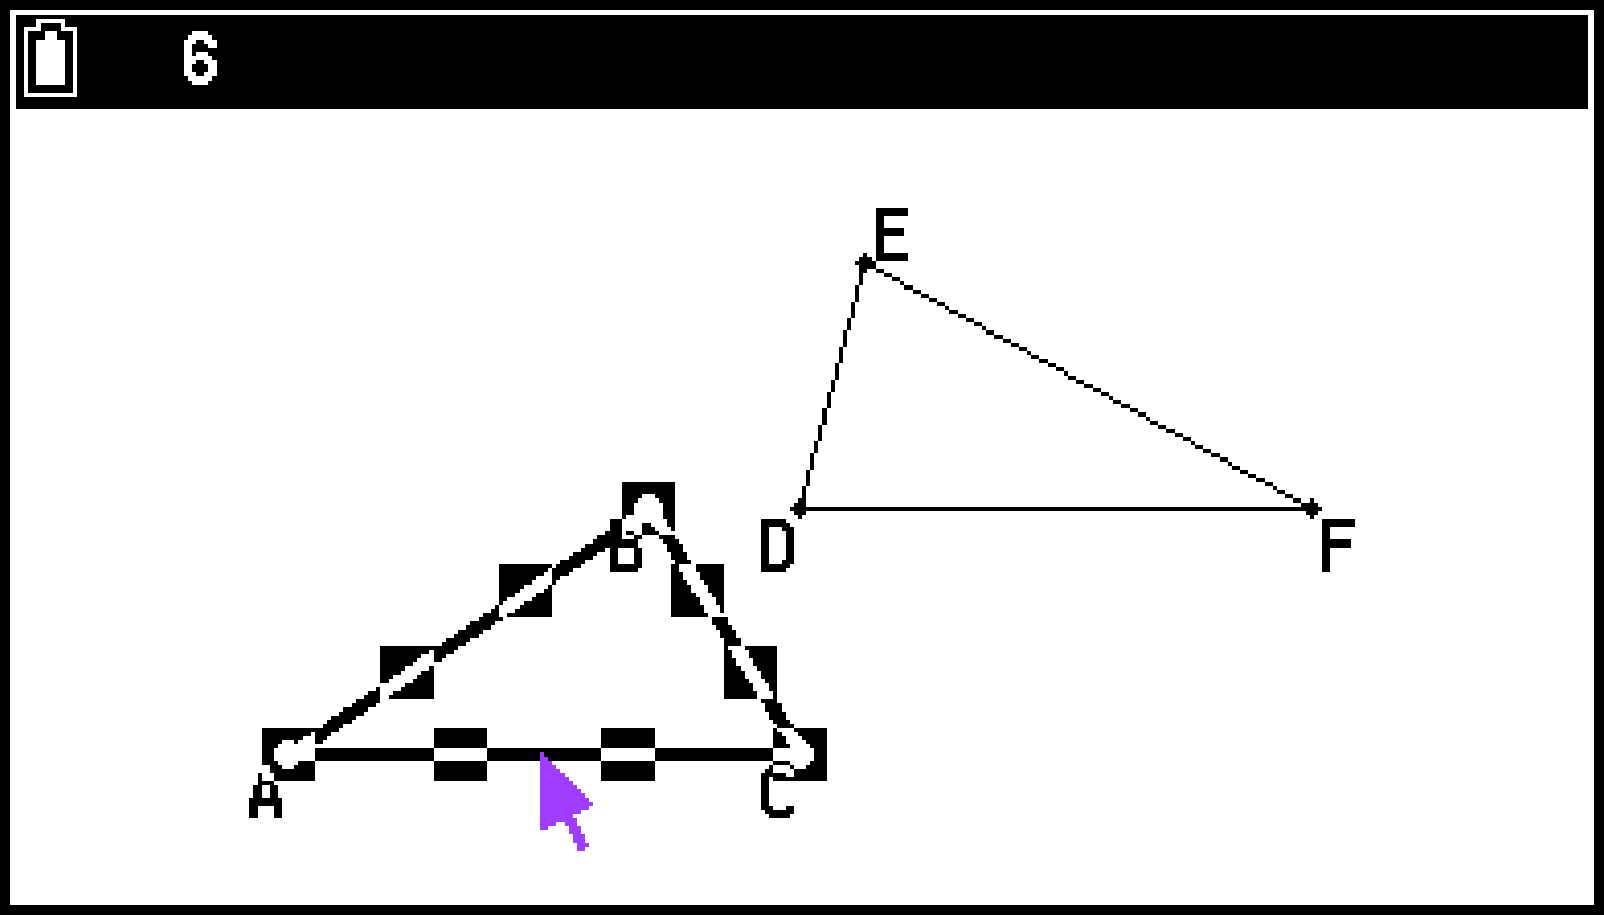 |
|
Select an entire semicircle |
You can use the same operation as that under “Select an entire polygon” above to select the semicircle. |
|
Select an entire circle |
This causes four This selects the entire circle. |
|
Deselect a particular object |
This causes the 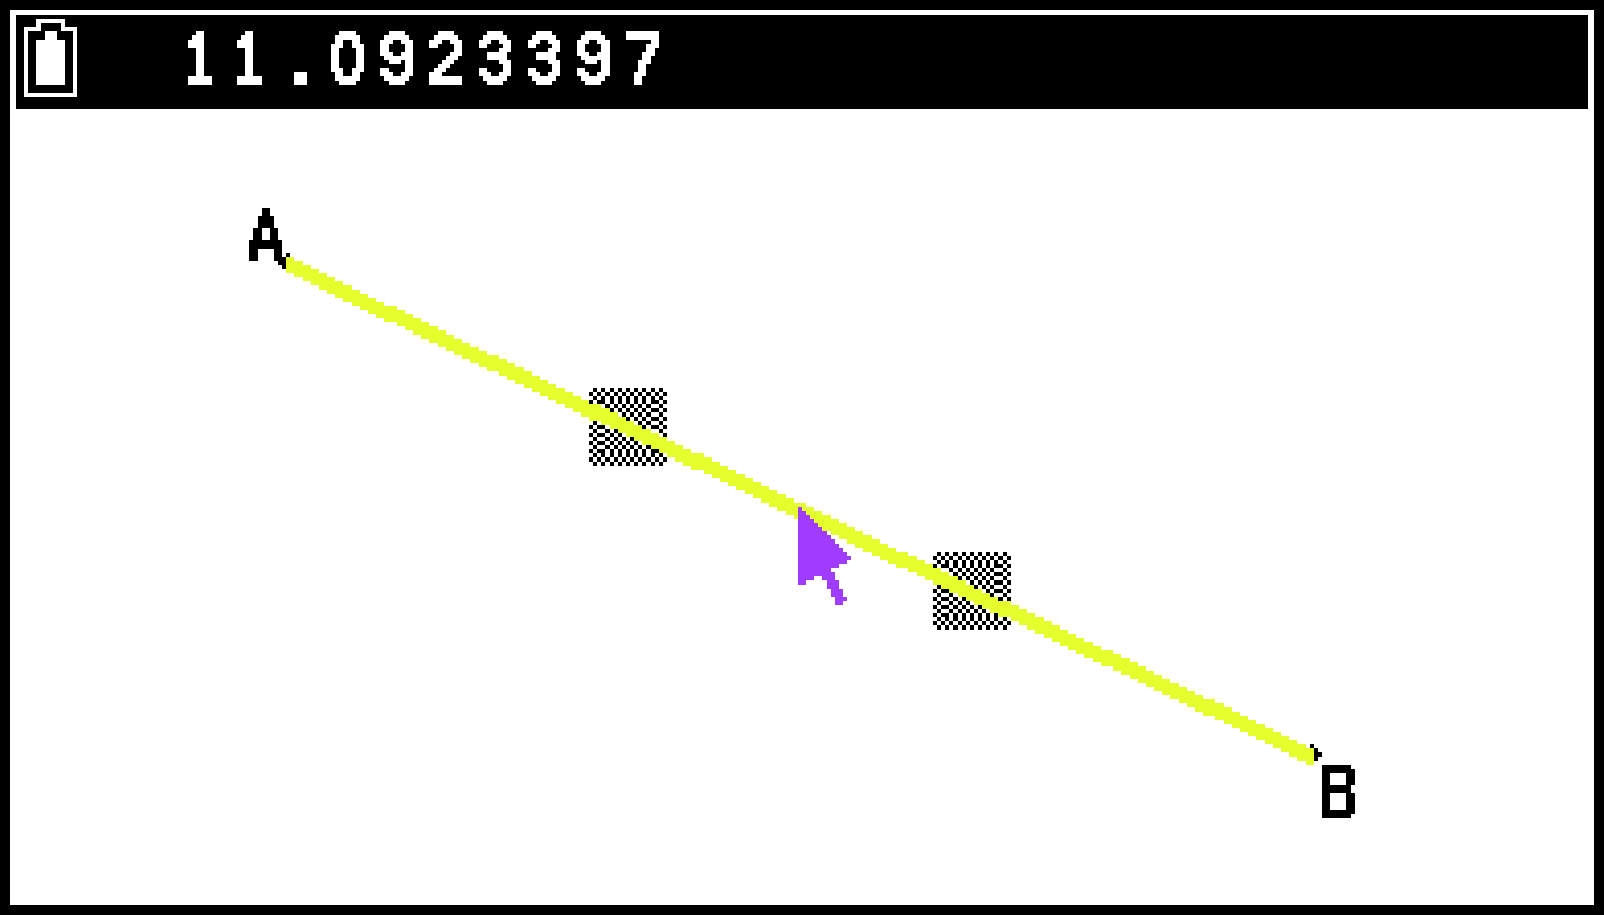 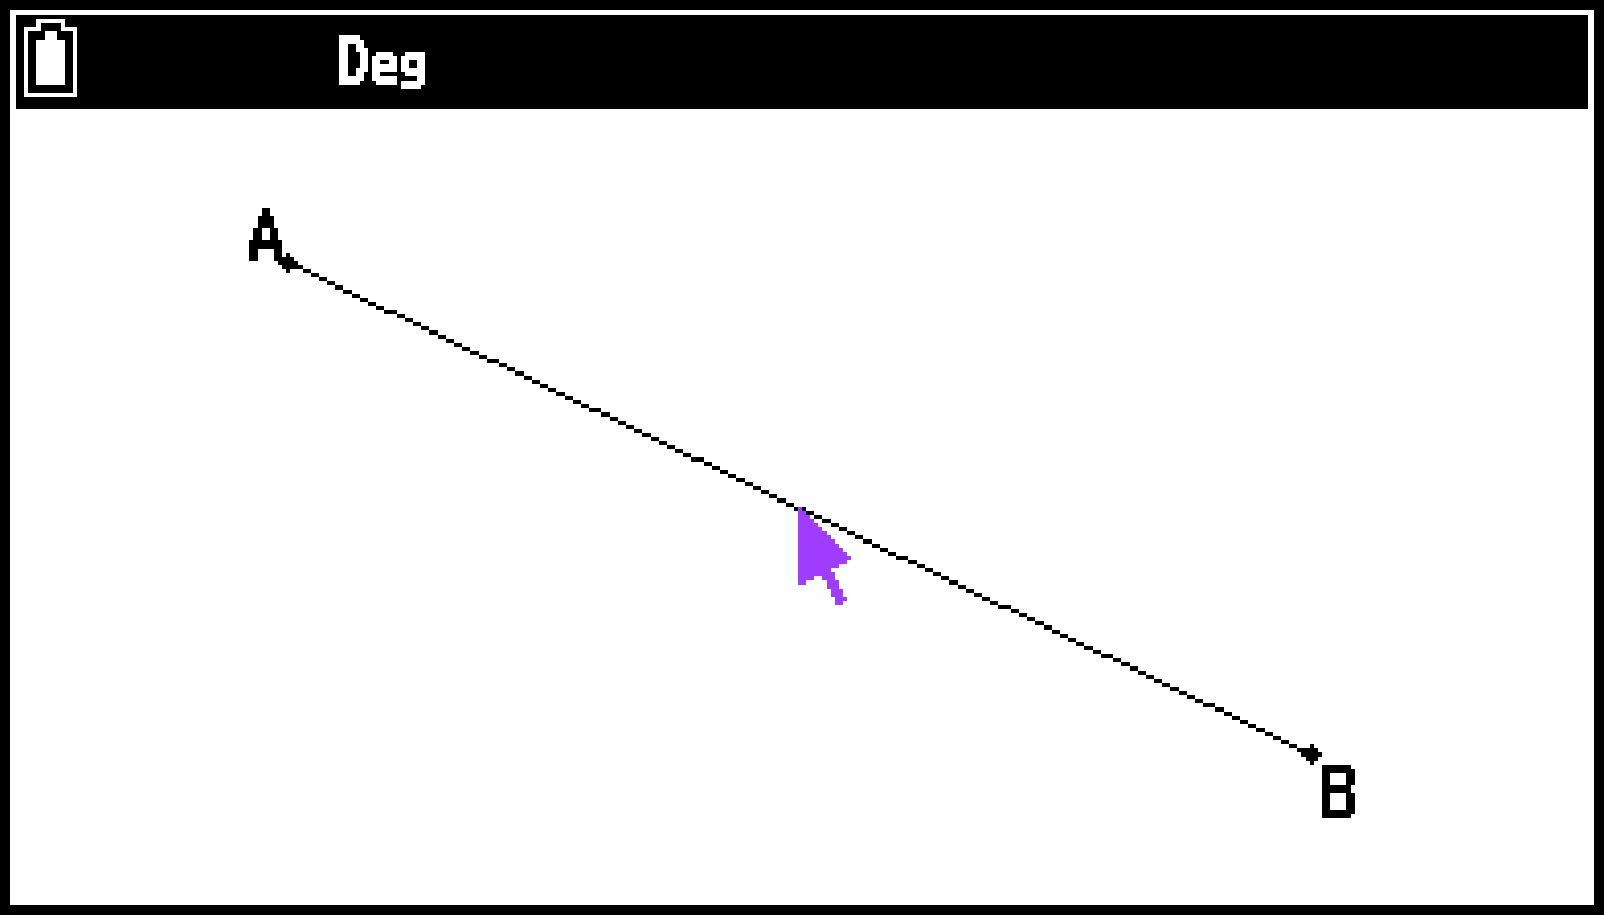 Note You can use the same operation as the one described above to deselect only a portion (vertex or side) of a polygon that is entirely selected. 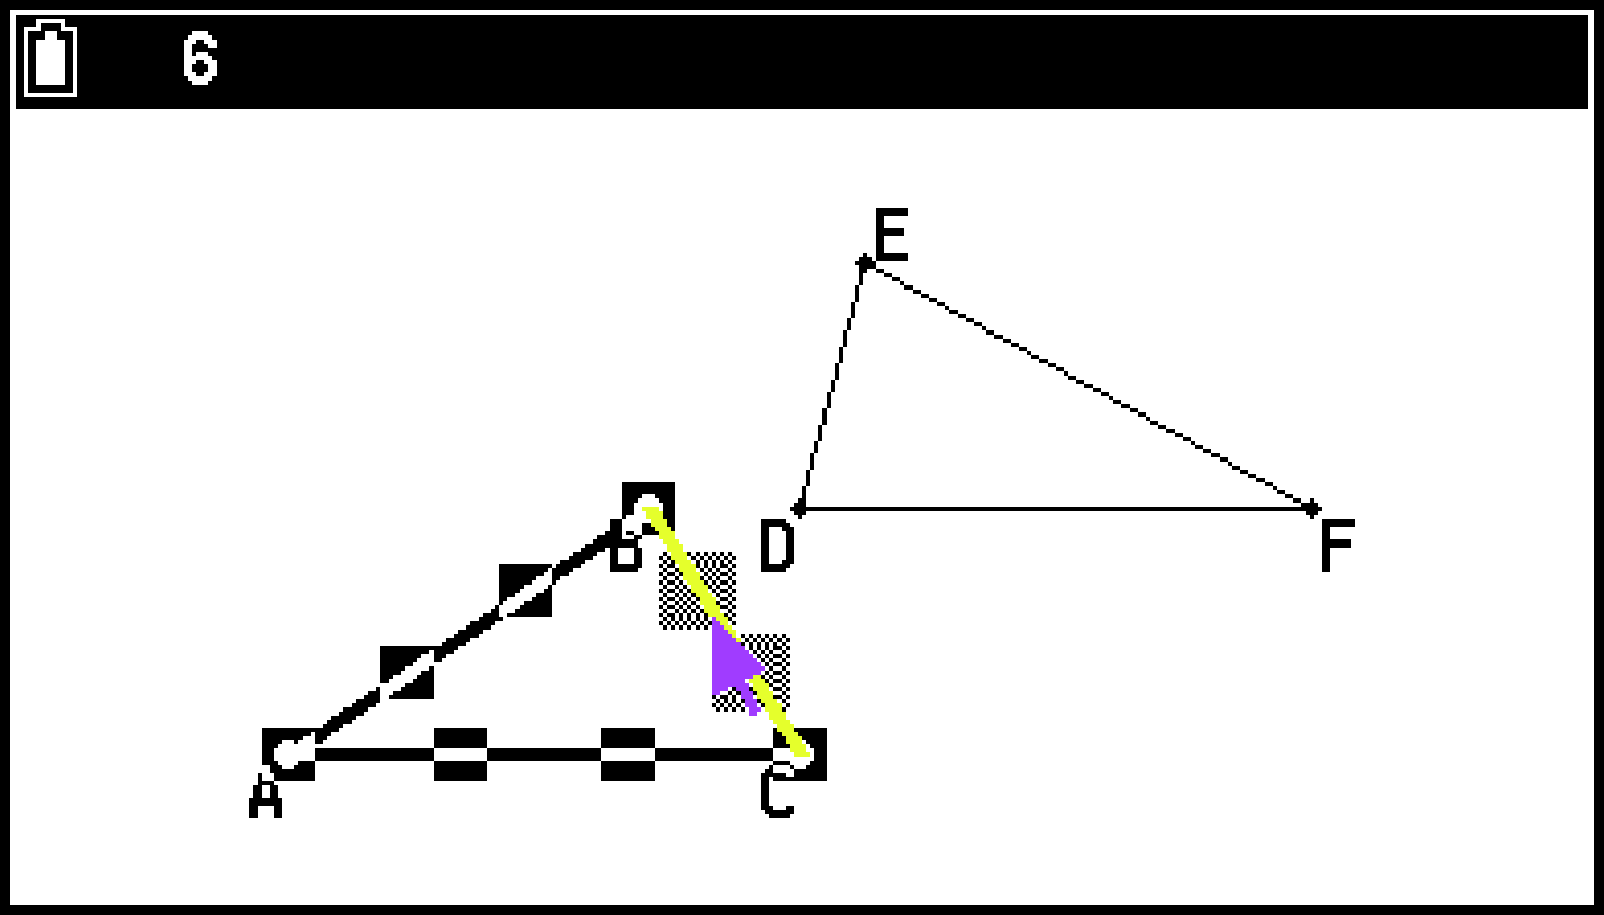 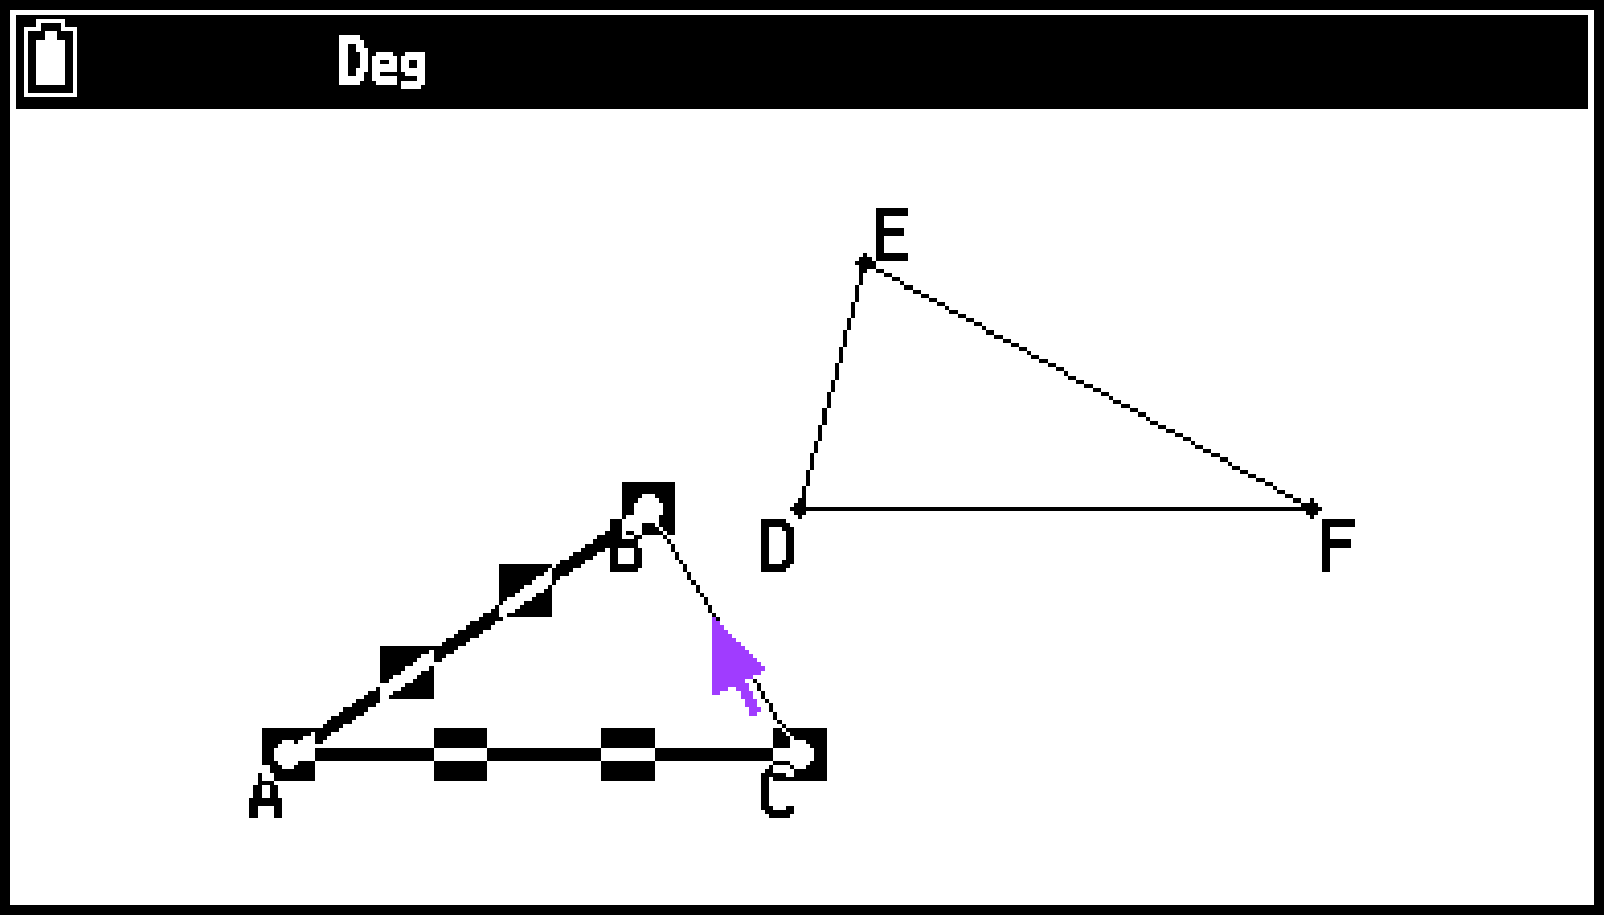 |
|
Select all objects on the screen |
Select T > [Edit] > [Select All]. |
|
Deselect all objects on the screen |
Press a or select T > [Edit] > [Deselect All]. |
Moving and Deleting an Object
To move an object
-
Select the object you want to move.
-
Press X.
-
Use the cursor keys to move the object in the direction you want.
-
To move the object to the current location of the rectangle, press O.
If you want to move only one of the vertices of a triangle for example, select the vertex. To move only one side of the triangle, select the side.
In each of the steps below, an example screenshot is shown when one side of a triangle is selected and moved.
This causes the ![]() icon to appear in the upper right corner of the screen and the pointer to change from
icon to appear in the upper right corner of the screen and the pointer to change from ![]() to
to ![]() . Also, a rectangle encloses the object that you selected in step 1.
. Also, a rectangle encloses the object that you selected in step 1.
Note
If you press X when nothing is selected on the screen, the pointer changes to ![]() , which you can use to pan (shift) the entire screen.
, which you can use to pan (shift) the entire screen.
Sometimes you may find that an object does not move the way you want it to. If this happens, press / to cancel the move and then do the following to try the move again.
Lock the part(s) of the object that you do not want to move (see Locking or Unlocking a Measurement of an Object)
Temporarily unlock all objects by selecting T > [Option] > [Clear Constraint]
To delete an object
-
Select the object you want to delete.
-
Press I or select T > [Edit] > [Delete].
If you want to delete only one of the vertices of a triangle for example, select the vertex. To delete only one side of the triangle, select the side.
This deletes the selected object.
To delete all objects on the screen
Important!
Performing the operation below deletes all the objects currently on the screen. This operation cannot be undone.
-
Select T > [Edit] > [Clear All].
-
In response to the confirmation dialog that appears, select [OK].
Note
You can also delete all objects by pressing a twice while nothing is selected on the screen.
Hiding and Showing Objects
To hide an object
-
Select the object you want to hide.
-
Select T > [Option] > [Hide].
This hides the selected objects.
To show all hidden objects
Select T > [Option] > [Show All]. This shows all currently hidden objects.
Changing the Display Priority of Objects
Objects you draw in the Geometry app are stacked in the order they are drawn (newest drawing on top). You can use the operations below to move a drawn object to the top or the bottom of the stack. You also can move all text to the front, if you want.
To move a particular object to the front, select T > [Properties] > [to the front].
To move a particular object to the back, select T > [Properties] > [to the back].
To move all text to the front, select T > [Properties] > [All Text].
Specifying an Object’s Color and Line Thickness
To specify text color
-
Select the text whose color you want to specify.
-
Select T > [Color Select] > [Char Color]. On the menu that appears, select the desired color.
-
To apply the settings you configure, press b.
To specify the text color of a label appended to a point (for example, the center point of a circle or the vertex of a polygon), select the point where the label is appended.
Press a to deselect all objects.
To specify the color and thickness of a line
-
Select the line whose color and thickness you want to specify.
-
Select T > [Color Select] > [Line Style]. On the menu that appears, select the desired line style.
-
Select T > [Color Select] > [Line Color]. On the menu that appears, select the desired color.
-
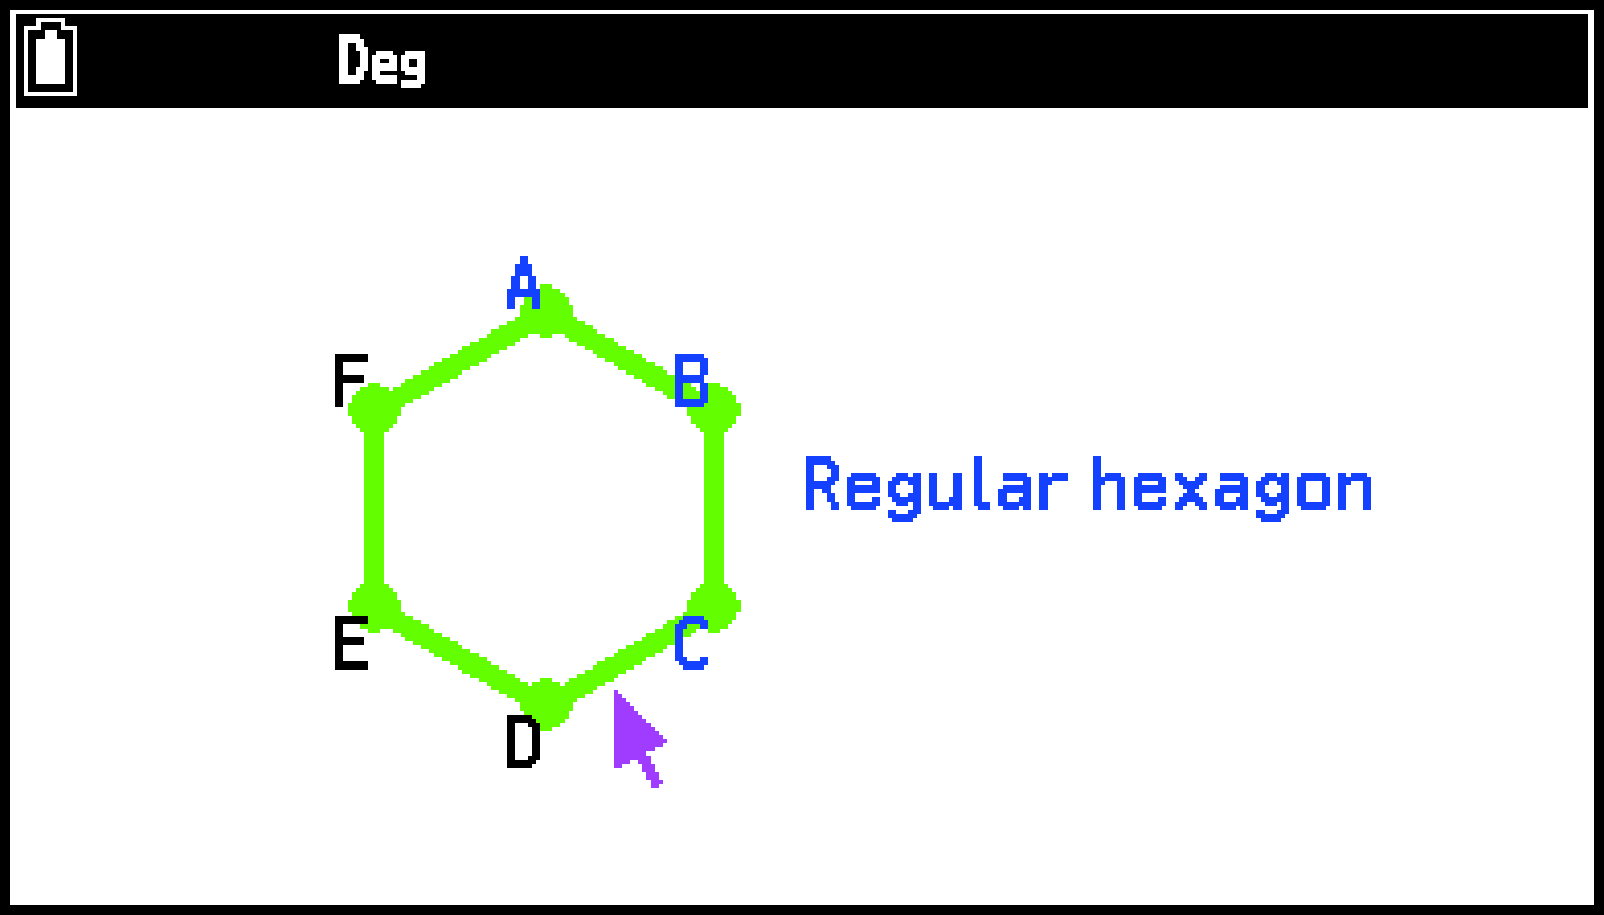
To apply the settings you configure, press b.
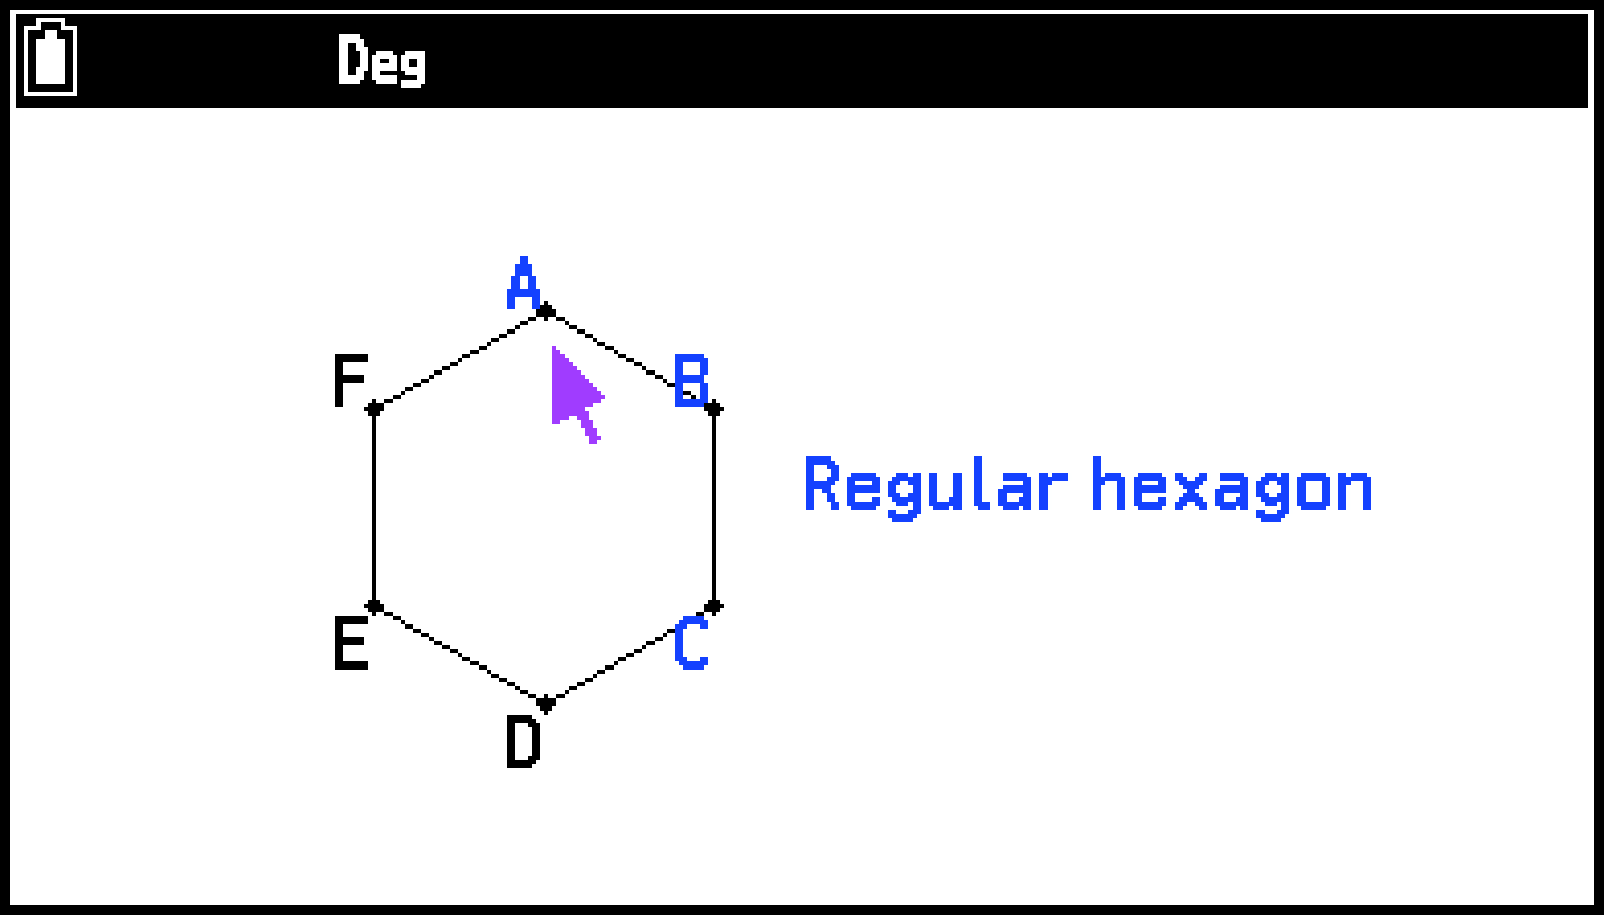
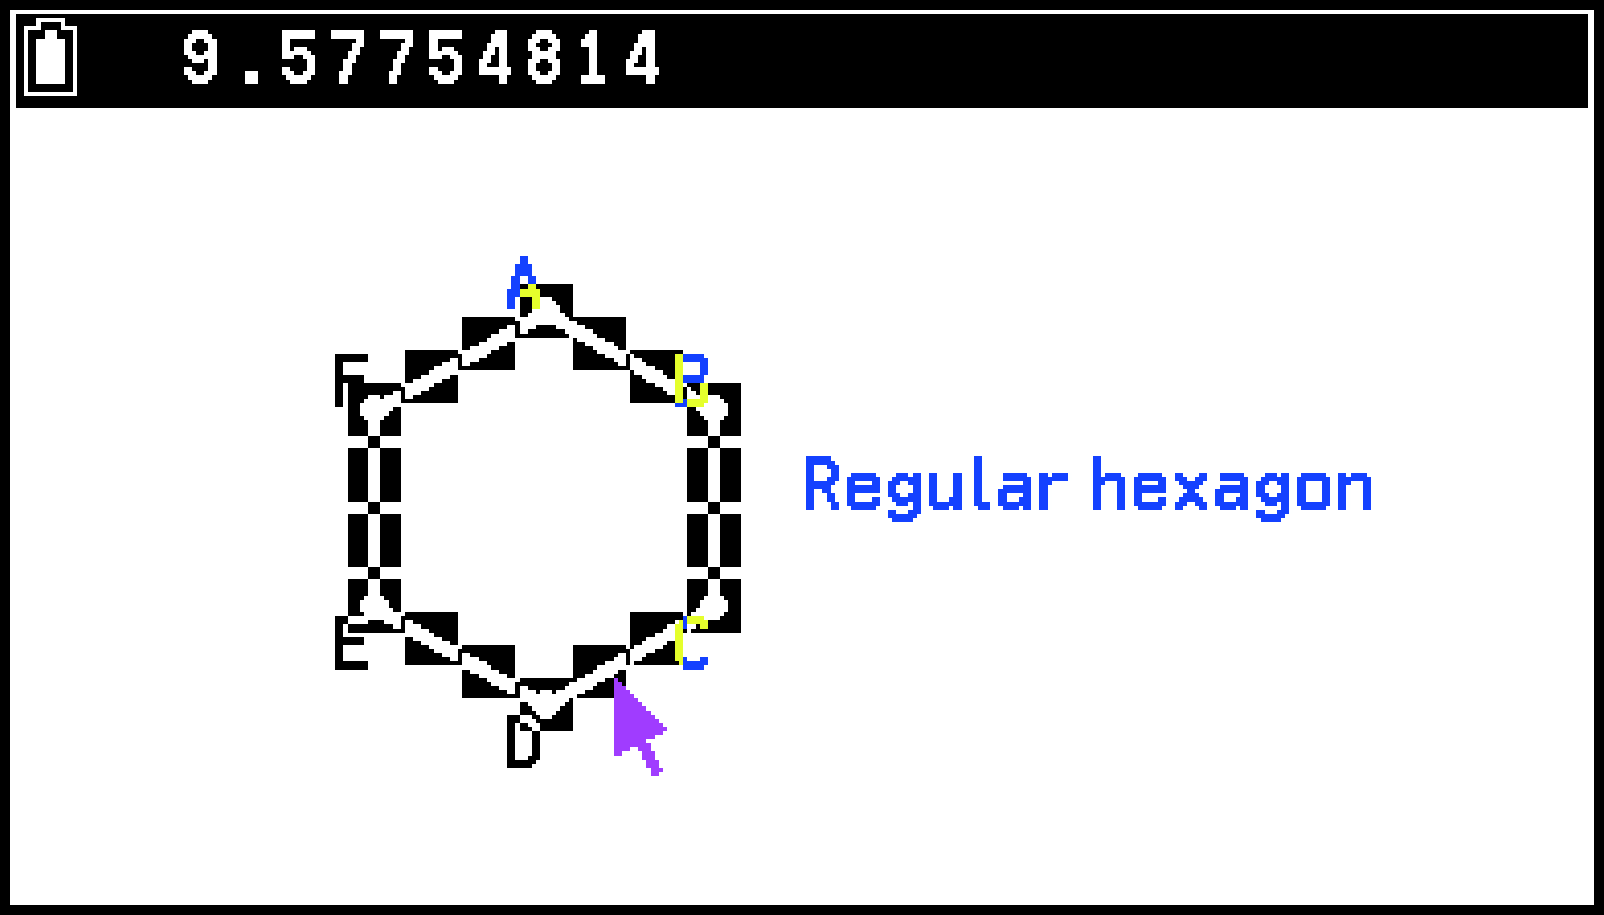
If you want to specify the color and thickness for all sides of a polygon simultaneously, press P to select the entire polygon (see “Select an entire polygon” under Selecting and Deselecting Objects).
Press a to deselect all objects.
To specify fill color and intensity of a closed figure (polygon, circle, etc.)
-
Select the closed figure whose fill color and intensity you want to specify.
-
Select T > [Color Select] > [Area Color]. On the menu that appears, select the desired color.
-
Select T > [Color Select] > [Paint Style]. On the menu that appears, select “Normal” or “Lighter”.
-
To apply the settings you configure, press b.
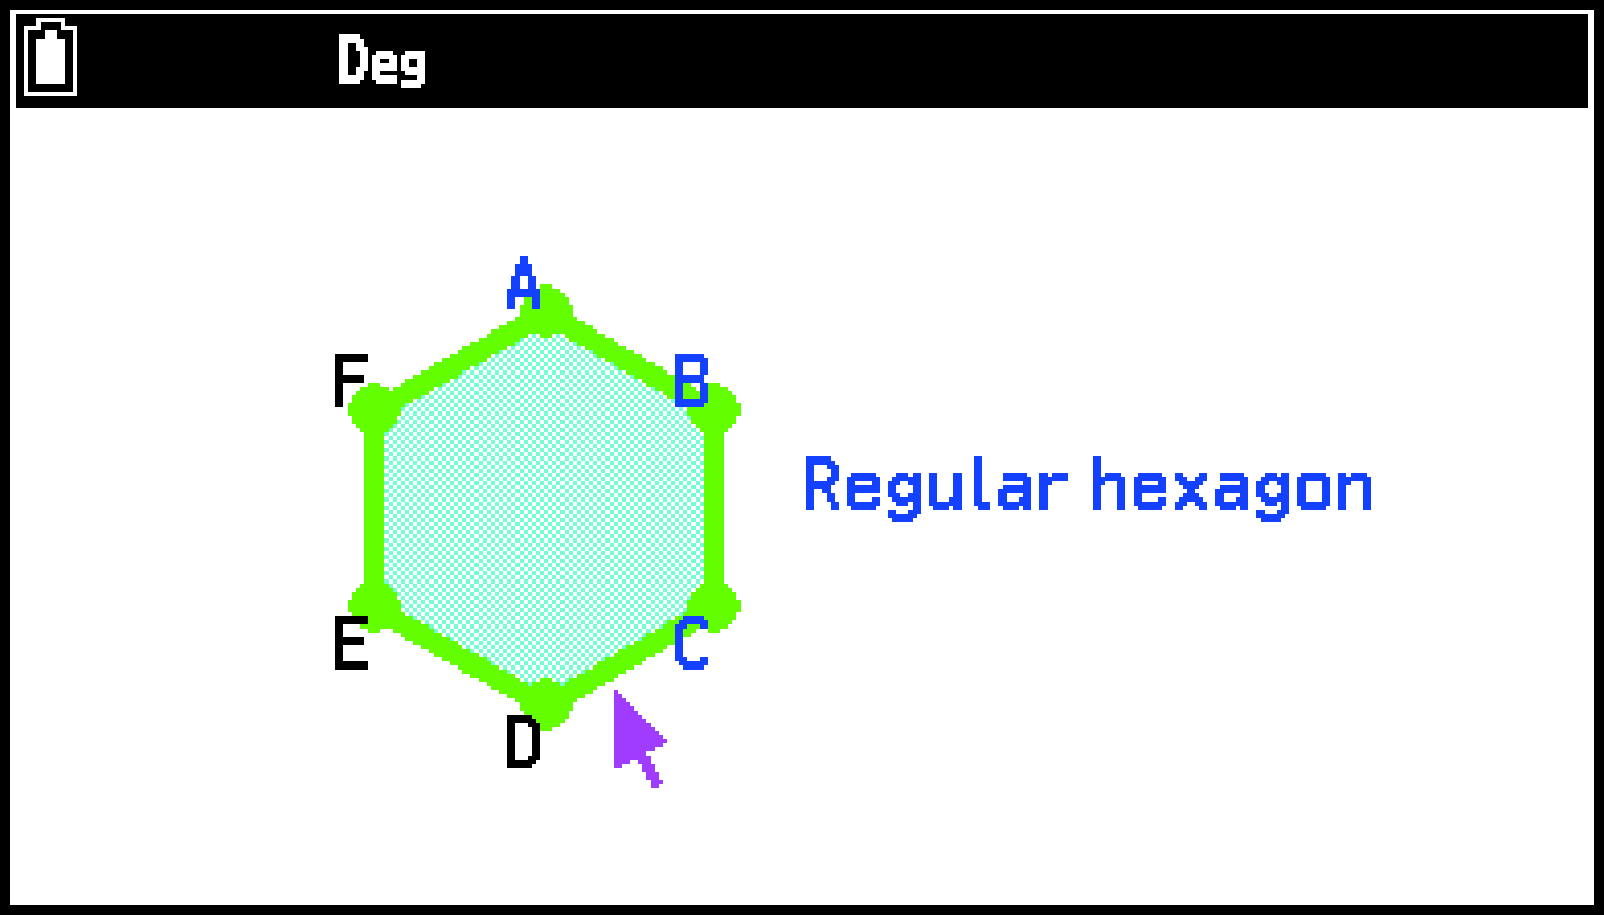
To fill a polygon or semicircle, press P to select the entire figure. To fill a circle, select its circumference.
Note
You can also select three arbitrary points (the vertices of a polygon, the center of a circle, the edge of a line segment, etc.) and specify the fill color and intensity of the area enclosed within the three points. Select the three points in step 1 above.
Note that this operation is possible only when three points are selected. This operation is not performed if four or more points are selected.
Using the File Menu
The table below shows the file operations that you can perform with the Geometry app.
|
To do this: |
Select this menu item: |
|---|---|
|
Clear the current drawing and create a new file |
T > [File] > [New] |
|
Clear the current drawing and open the Geometry app file stored in Main Memory |
T > [File] > [Open] > [Main Memory] |
|
Clear the current drawing and open an image file (.g4p or .g3p)*1 or Geometry app file (.g4p)*2 with the background image stored in Storage Memory |
T > [File] > [Open] > [Storage Memory] |
|
Name and save the current drawing |
T > [File] > [Save As] |
|
Delete the Geometry app file stored in Main Memory |
T > [File] > [Delete] > [Main Memory] |
|
Delete an image file (.g4p or .g3p)*1 or Geometry app file*2 (.g4p) with background image stored in Storage Memory |
T > [File] > [Delete] > [Storage Memory] |
You can open a g4p or g3p file and use it as a background image for a Geometry app drawing. Attempting to open a g4p or g3p file may cause the following message to appear: “View window value is not suitable. Set initial value? ”. To open the file using the Geometry app View Window initial default value, select [OK]. For information about g4p and g3p files, see Files Displayed on the Storage Memory Tab.
For details, see Displaying a Geometry App Screen Background Image.
Note
Each time a new file is created in the Geometry app, View Window settings are initialized. In addition, the Settings menu settings below are returned to their initial default settings (noted in parentheses).
Angle (Degree)
Angle Unit (On)
Length Unit (Off)
Grid (Off)
Grid Space (1)
Axes (Off)
Displaying a Geometry App Screen Background Image
In the Geometry app, you can open an image file (.g4p or .g3p) and use it as a background image for a Geometry app drawing. If you open a g4p or g3p file, draw something, and then save the result to a file, the file is saved in g4p format, along with the Geometry app data.
Note
You can edit the Geometry app data (objects drawn with the app) on the saved g4p file later. However, once you save the result to a g4p file, you cannot change the background image of the file or remove it.
To adjust the opacity of the background image (Fade I/O)
This operation can be performed only when a 16-bit color image is being used as the background image.
-
Select T > [Properties] > [Fade I/O].
-
Use l and r to adjust the opacity of the background image.
-
When the setting is the way you want, press O.
Using the View Menu
You can use the View menu to perform the operations below and adjust the viewing area of the drawing screen.
Specify the display range numerically or restore default settings (View Window)
Shift the display range up, down, left, right (Pan, Scroll)
Zoom the display range (Zoom Box, Zoom In, Zoom Out, Zoom to Fit)
Configuring View Window Settings
You can configure View Window settings to specify the coordinates of the screen’s left edge (X Minimum) and right edges (X Maximum). The length of the -axis is configured automatically using a ratio of 1:2 (-axis:-axis), but you can specify what part of the -axis is in the middle of the screen (Y Middle).
To configure View Window settings
-
Select T > [View] > [View Window].
-
Input values for X Minimum, X Maximum, Y Middle.
-
After all the settings are the way you want, select
 and then press O.
To display the View Window menu.
If you want to return these settings to their initial defaults, select [Pre-set Windows] > [Initialize].
To close the View Window menu without applying any of the settings you changed, press b instead of performing step 3.
Using Pan and Scroll to Shift the Display Image
To pan the screen
-
Select T > [View] > [Pan].
-
Move the pointer to the location on the screen you want to grab and then press O.
-
While the
 pointer is displayed, use the cursor keys to shift the screen in the direction you want.
 -
To exit the pan mode, press b.
This enters the pan mode, which is indicated by the ![]() icon in the upper right corner of the screen.
icon in the upper right corner of the screen.
This causes the pointer to change from ![]() to
to ![]() .
.
In the pan mode, each press of O toggles the shape of the pointer between ![]() and
and ![]() . While the
. While the ![]() pointer is displayed, you can use the cursor keys to move it to another location on the screen. Pressing the cursor keys while the
pointer is displayed, you can use the cursor keys to move it to another location on the screen. Pressing the cursor keys while the ![]() pointer is displayed shifts (pan) the screen contents.
pointer is displayed shifts (pan) the screen contents.
To scroll the screen
-
Press . or select T > [View] > [Scroll].
-
Use the cursor keys to scroll the screen in the direction you want.
-
To exit the scroll mode, press b.
This enters the scroll mode, which is indicated by the ![]() icon in the upper right corner of the screen. The pointer disappears from the screen at this time.
icon in the upper right corner of the screen. The pointer disappears from the screen at this time.
Zooming
To zoom using the zoom box
-
Select T > [View] > [Zoom Box].
-
Move the pointer to the location on the screen on one edge of the area you want to select as the zoom box area and then press O.
-
Move the pointer in the direction of the opposite edges of the zoom box area.
-
After selecting the zoom box area you want, press O.
This causes the ![]() icon to appear in the upper right corner of the screen.
icon to appear in the upper right corner of the screen.
As you do, the calculator displays a selection boundary that expands as you move the pointer.
The area within the zoom box area expands to fill the entire screen.
To zoom in and out
To double the size of the displayed image, press + or select T > [View] > [Zoom In].
To halve the size of the displayed image, press - or select T > [View] > [Zoom Out].
To zoom the screen image to fit the window area
Press F or select T > [View] > [Zoom to Fit].
This enlarges or reduces the currently display image so it fills the screen.
Note
The above operation does not apply in the case of a graph drawn using T > [Draw Special] > [Function f()].
Using the Construct Menu
You can use the Construct menu to create a drawing based on a previously drawn figure, as described in the table below.
|
To construct this: |
Select one or two of the following geometric elements: |
Select T > [Construct] and then select this: |
|---|---|---|
|
A perpendicular bisector |
A line segment, a side of a polygon, or two points*1 |
[Perpendicular Bisector] |
 |
 |
|
|
A perpendicular line |
One point*1 plus one of the following geometric elements: A line segment, a straight line, a side of a polygon |
[Perpendicular Line] |
 |
 |
|
|
A midpoint |
A line segment, a side of a polygon, or two points*1 |
[Midpoint] |
 |
 |
|
|
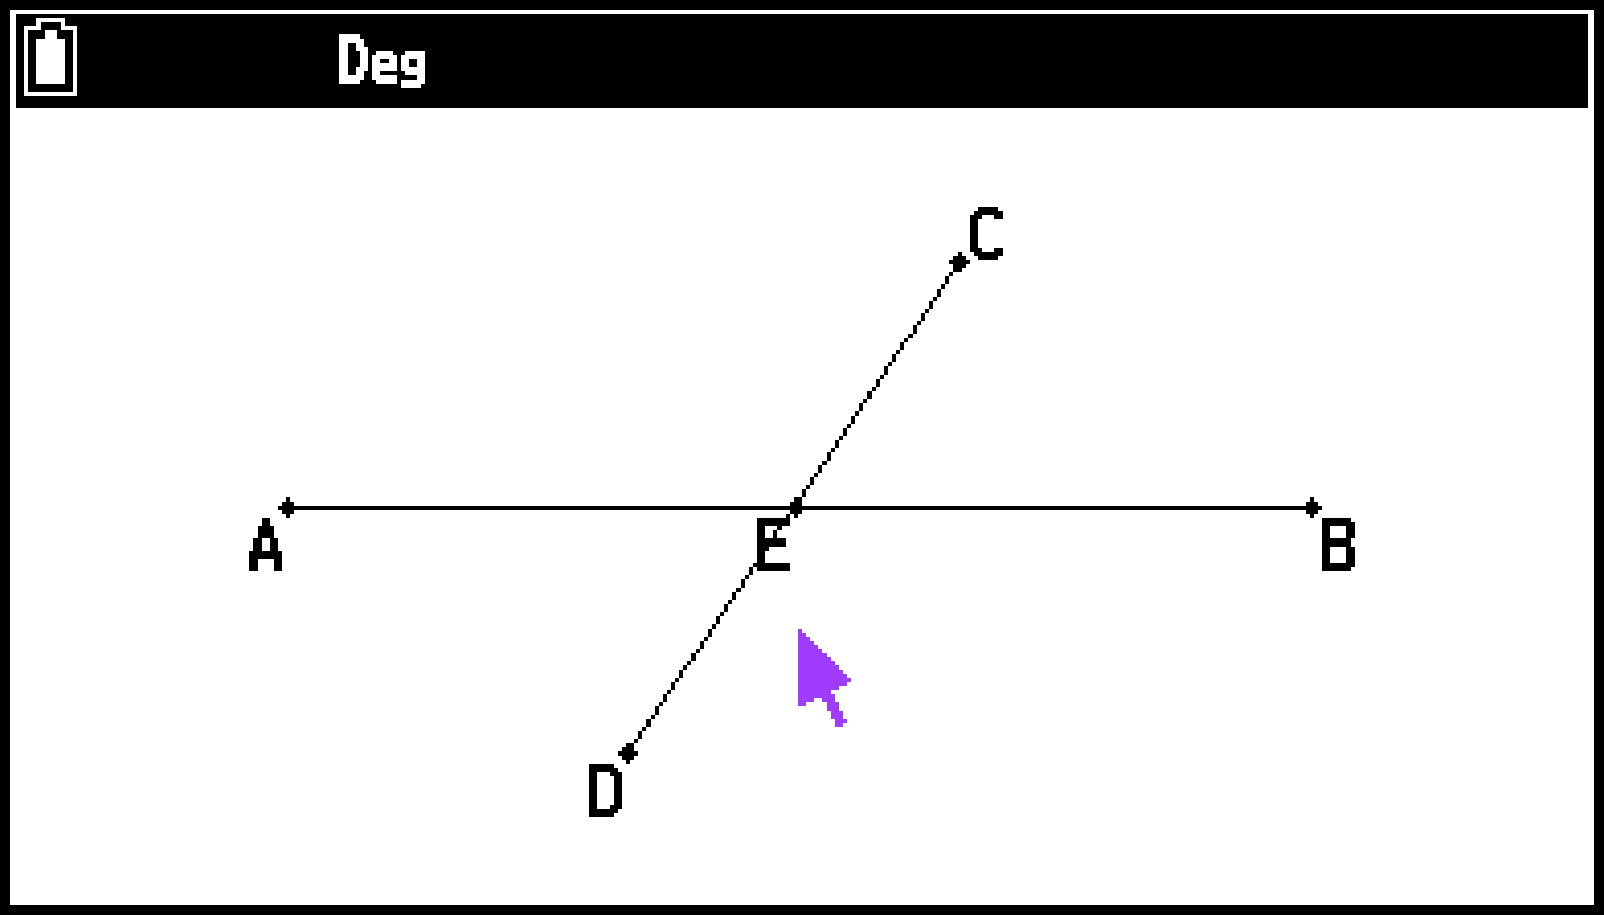
An intersection point |
Any two of the following (or two of the same) geometric elements: line segment,*2 straight line, ray, vector, side of a polygon, circle, arc |
[Intersection Point] |
 |
 |
|
|
An angle bisector |
Any two of the following (or two of the same) geometric elements: line segment, straight line, ray, vector, side of a polygon |
[Angle Bisector] |
 |
 |
|
|
A parallel line |
A single point*1 plus one of the following geometric elements: line segment, straight line, ray, vector, side of a polygon |
[Parallel Line] |
 |
 |
|
|
A tangent |
A single circle, semi circle, arc, or function graph*4 |
[Tangent] |
 |
 |
The vertices of a polygon, the center point of a circle, or any other point that constitutes a figure.
If two line segments with no points of intersection are selected, an intersection point is created at the location where the two line segments eventually intersect when extended.
A symbol (>) indicating parallelism appears or both one ends of the selected line segment, line, ray, or polygon and the drawn parallel line.
In the case of drawing a tangent, you don’t need to select a figure first. After selecting T > [Construct] > [Tangent], move the pointer to a point on the figure to which you want to draw a tangent line, and then press O.
Attaching an Angle Measurement to a Figure
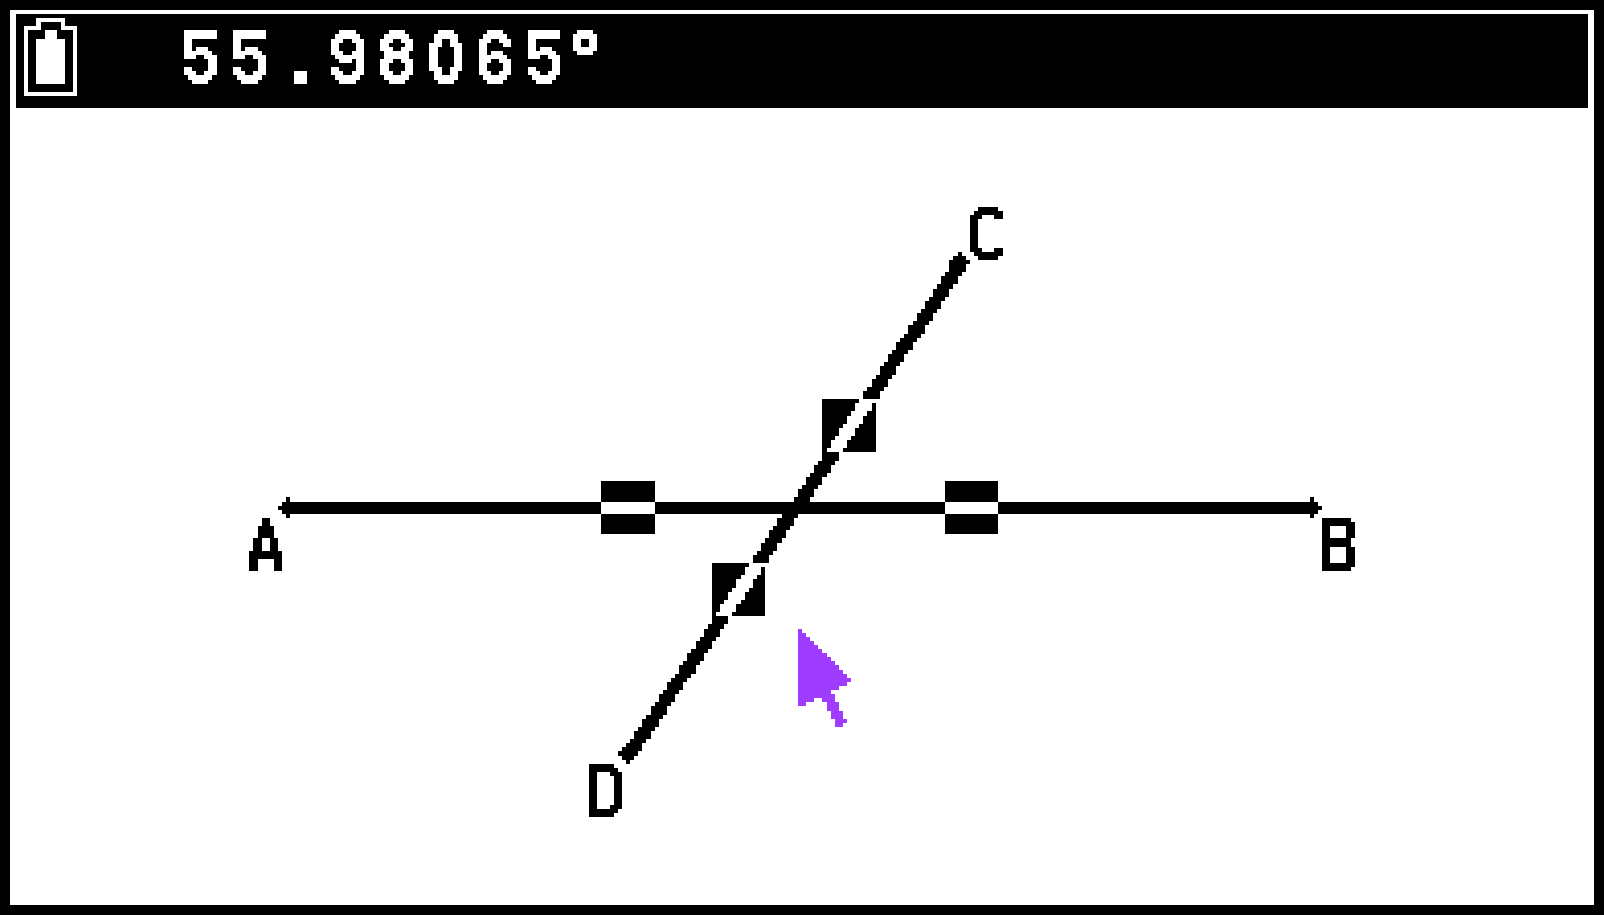
You can select two line segments or two sides of a polygon and attach an angle value to them.
Example: To select two sides of a polygon and append an angle value
-
Draw a triangle and select two of its sides.
-
Select T > [Construct] > [Attached Angle].
-
To determine the display location of an angle measurement, press O.
This attaches the angle measurement to the figure.
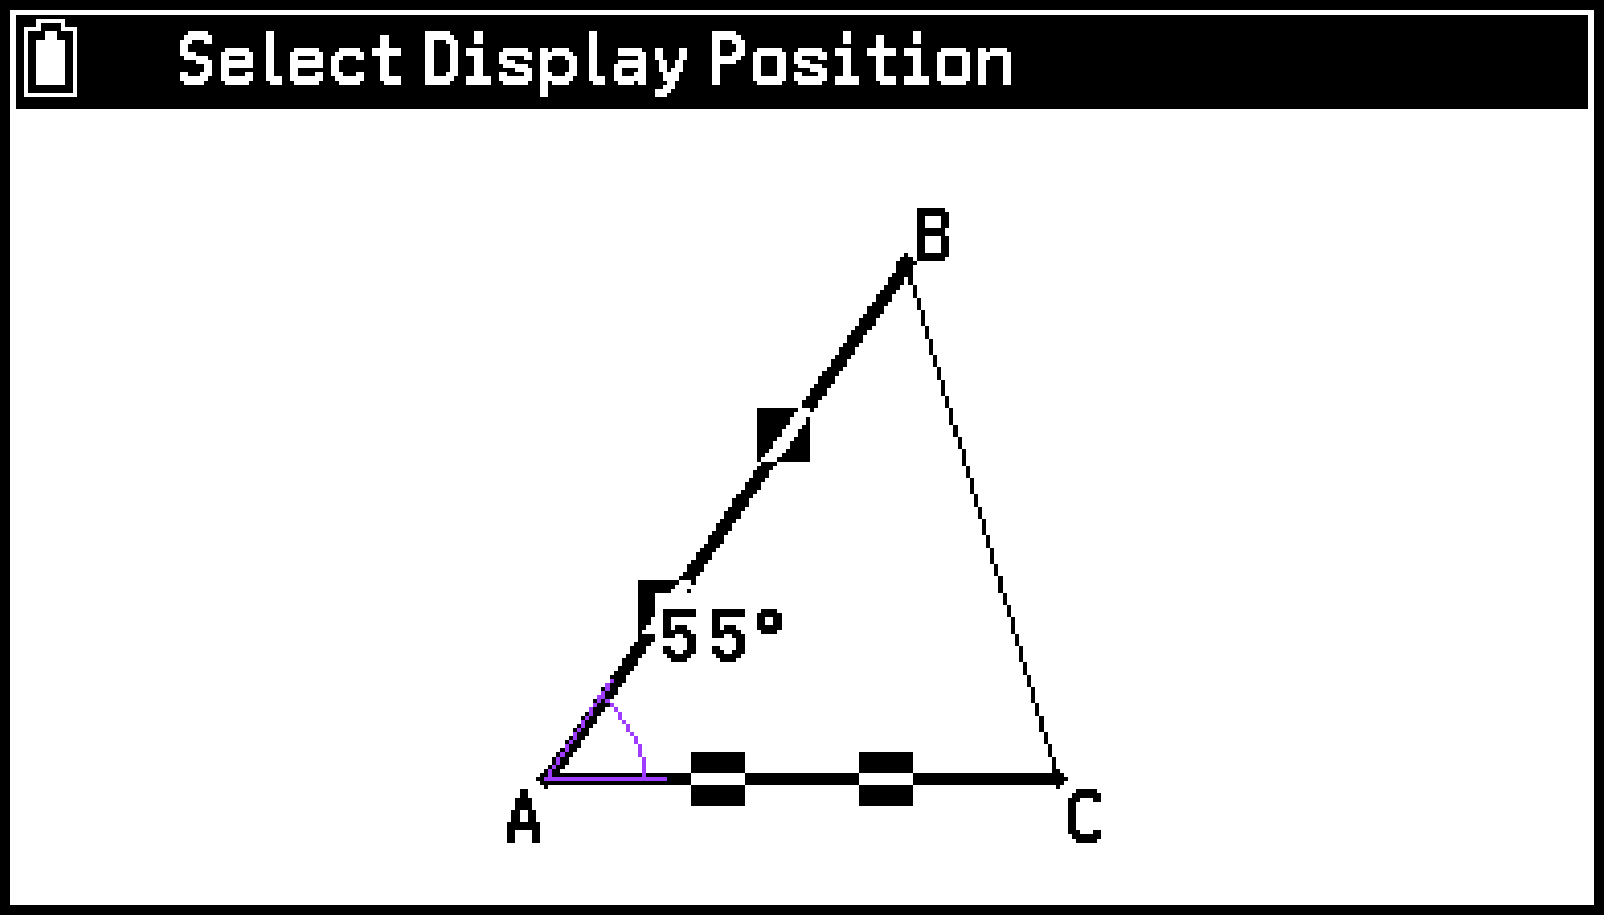
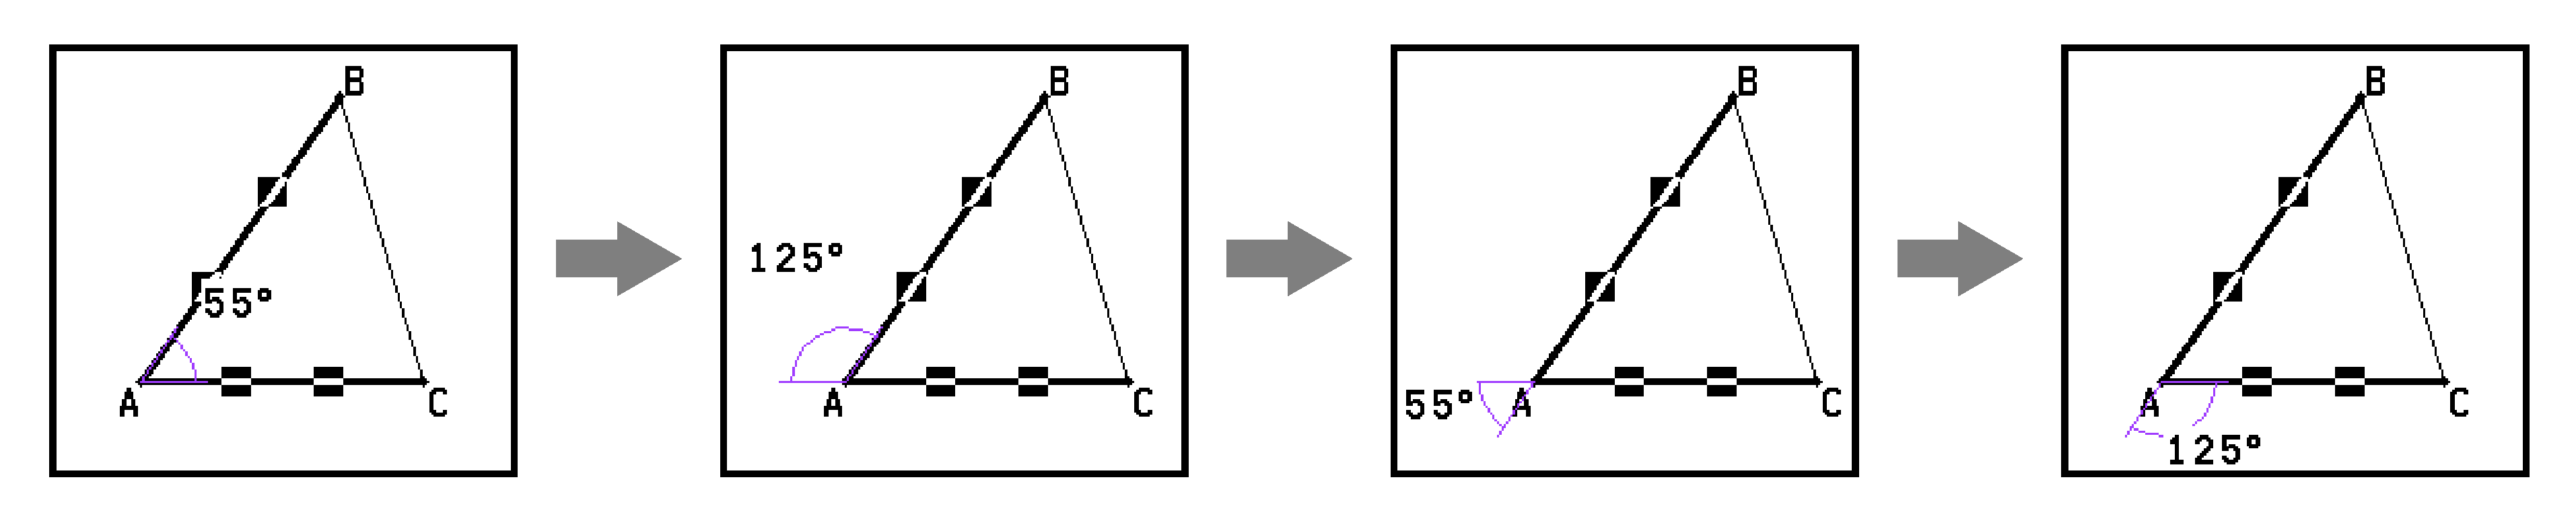
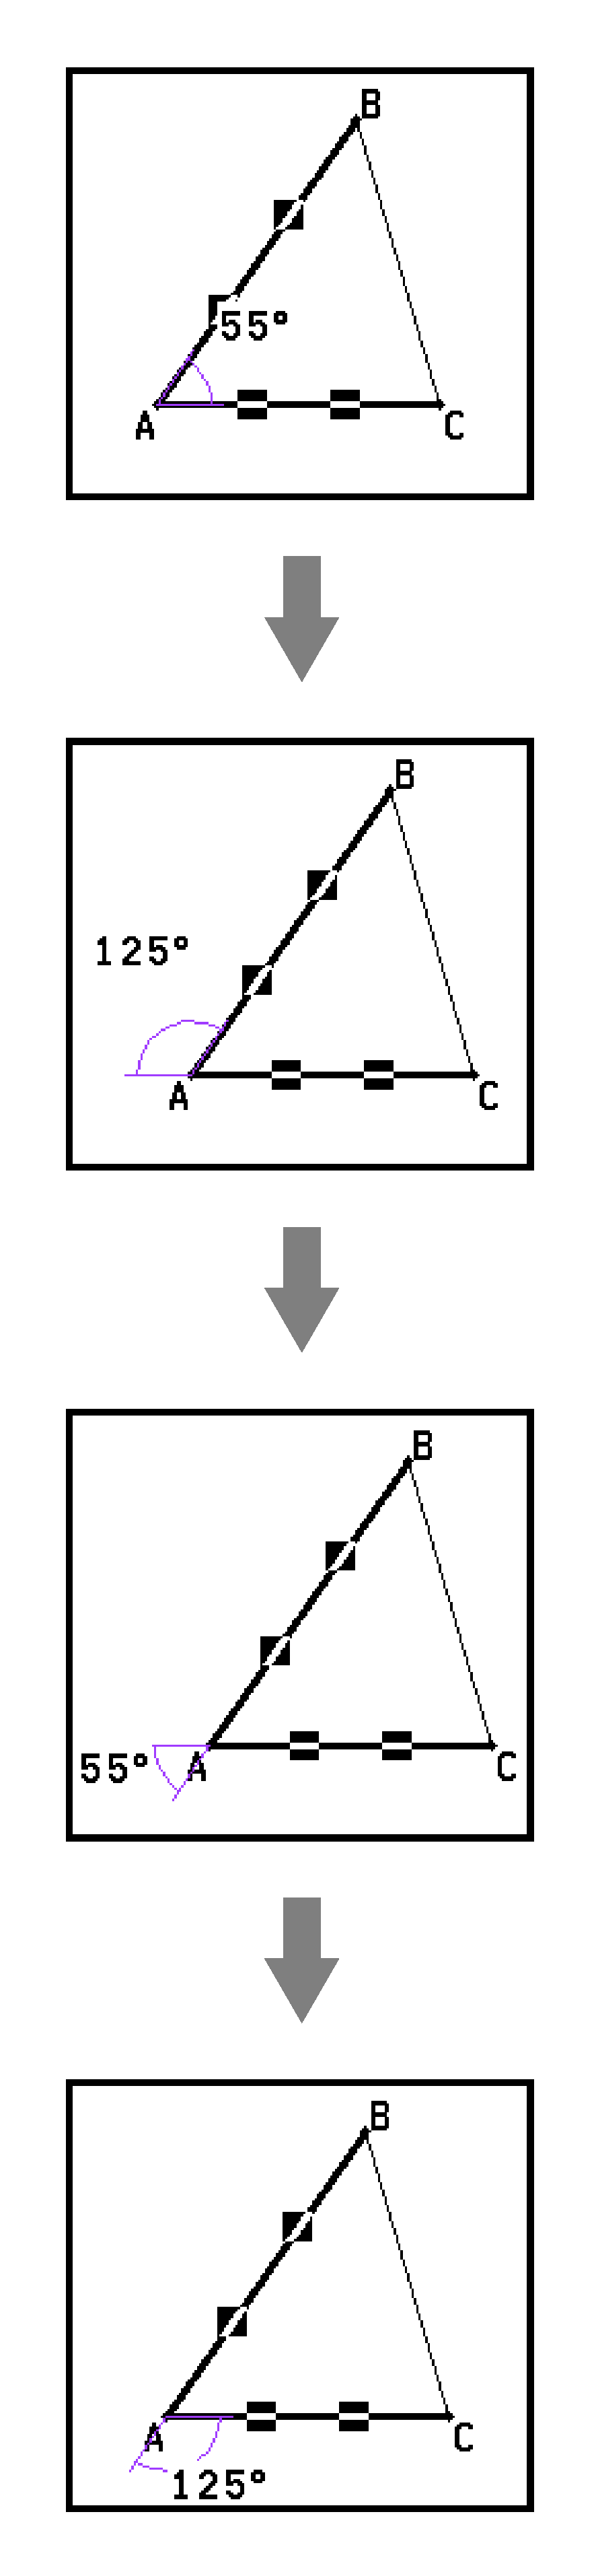
While the “Select Display Position” message is displayed, you can use the cursor keys to specify which angle measurement is displayed for the two selected sides.
Using the Transformations Menu
You can use the Transformations menu to perform various transform operations, such as object reflection, object rotation, etc.
Reflecting an Object
You can specify a line segment, line, ray, one side of a polygon, or the -axis or -axis as the axis of reflection.
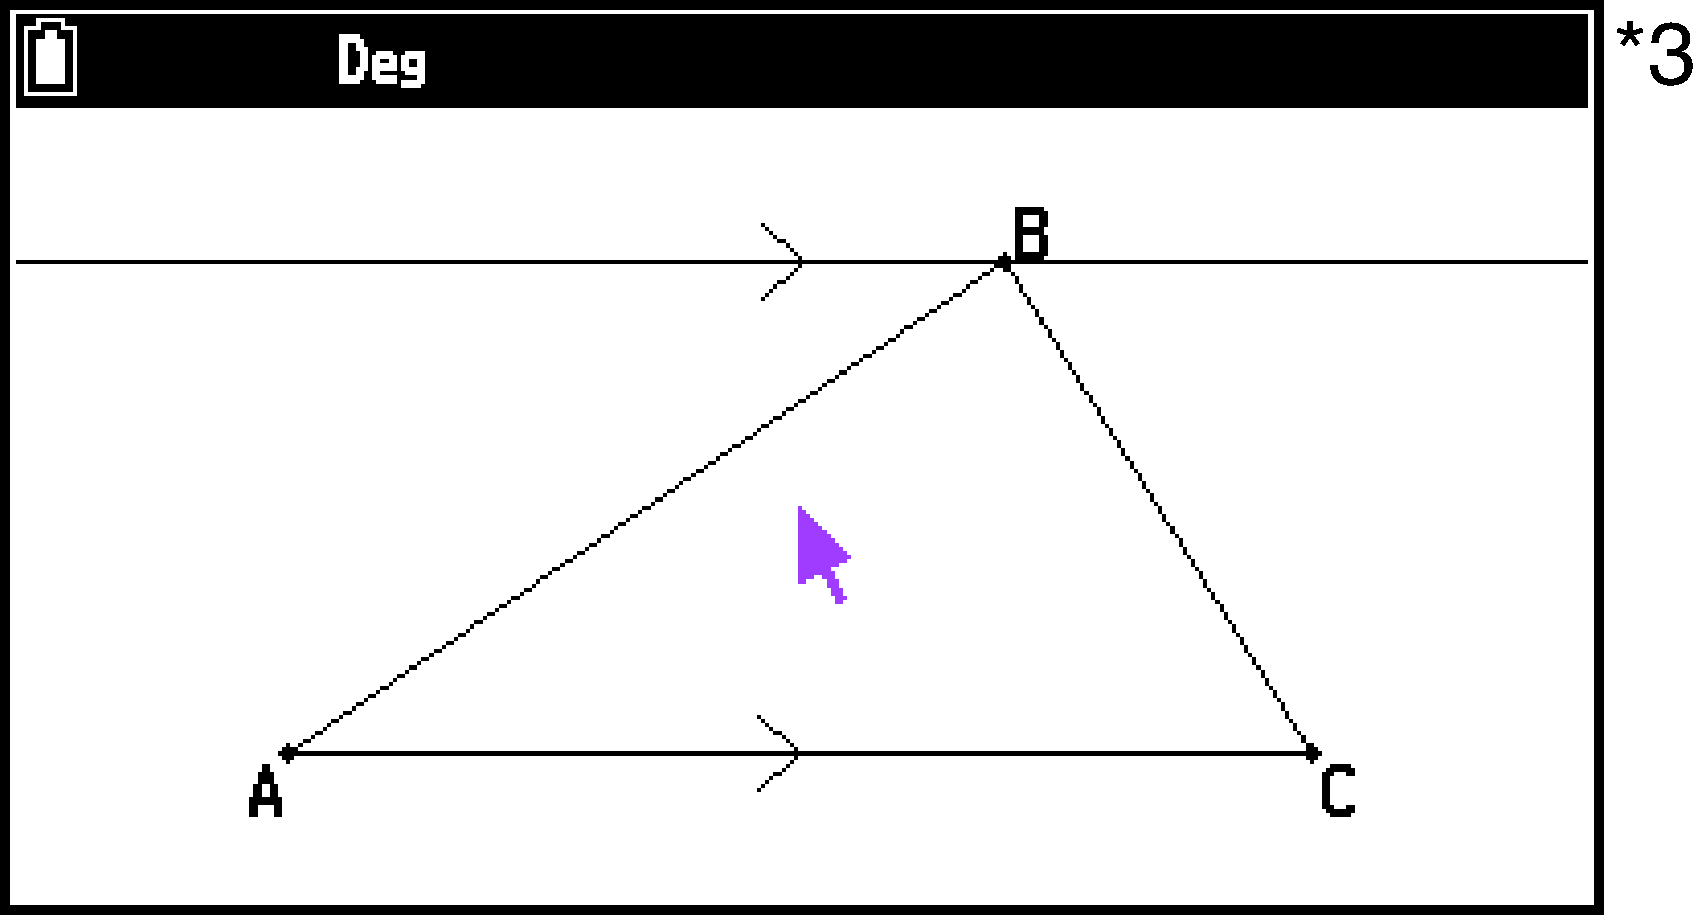
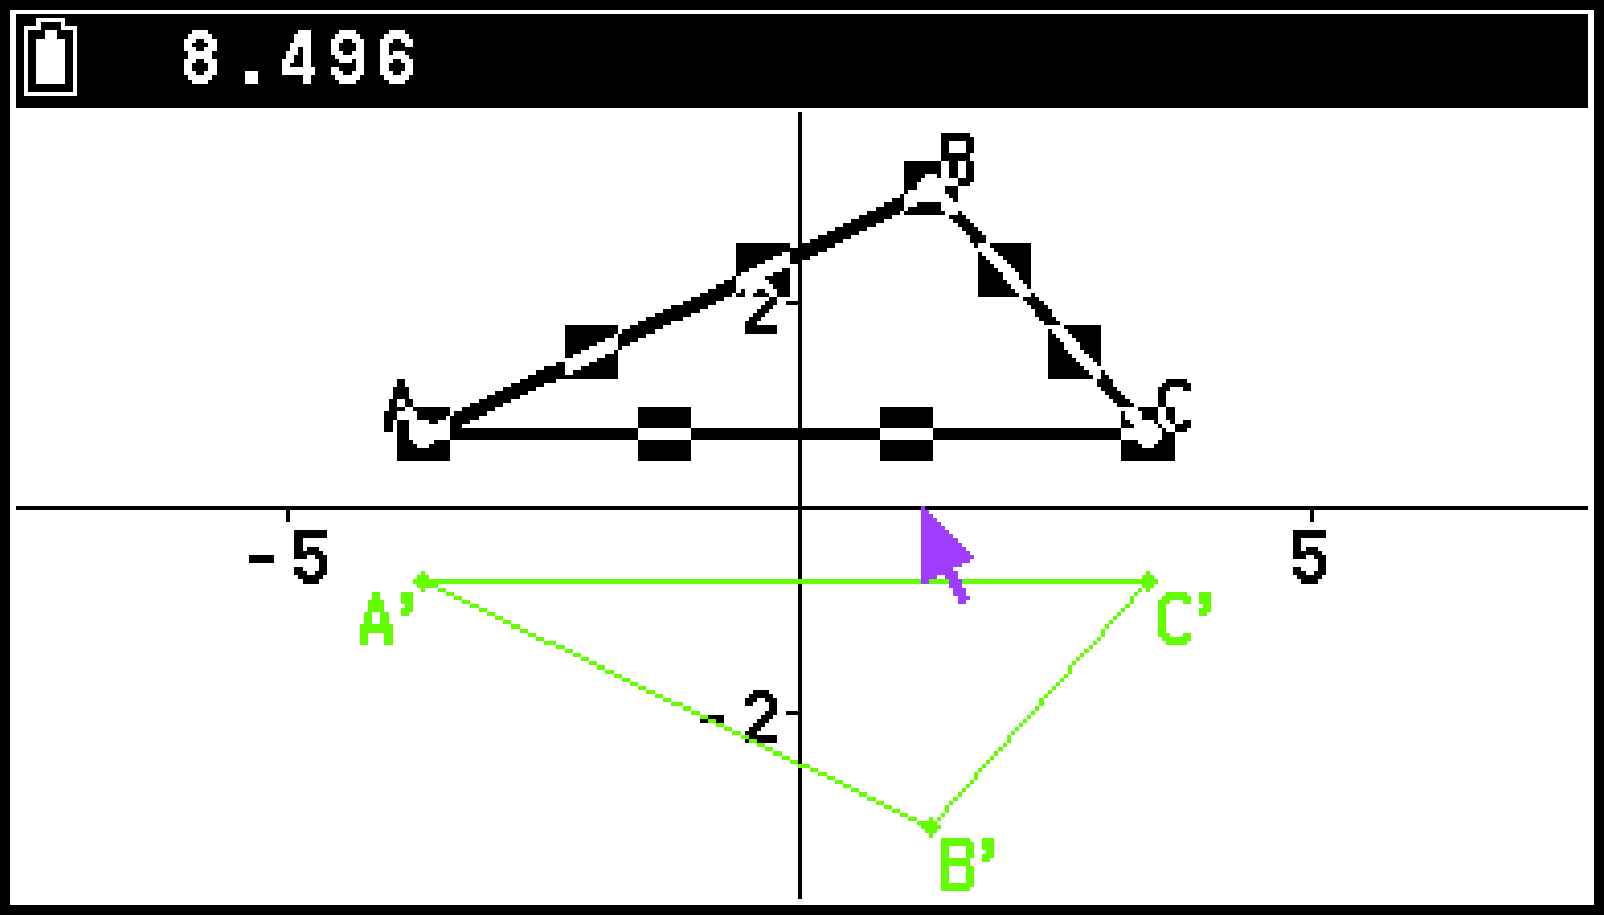
Example: To draw a triangle shifted symmetrically along the -axis
-
Select S > [Axes] > [Scale].
-
Draw a triangle and then use the P key to select the entire triangle.
-
Select T > [Transformations] > [Reflection].
-
Move the pointer to a location where the tip is touching the -axis.
-
Press O.
This displays the -axis and -axis with a scale.
For more information about how to select the triangle, see Select an entire polygon.
This causes the message “Select Axis” to appear.
Move the pointer to a location on the -axis away from the origin.
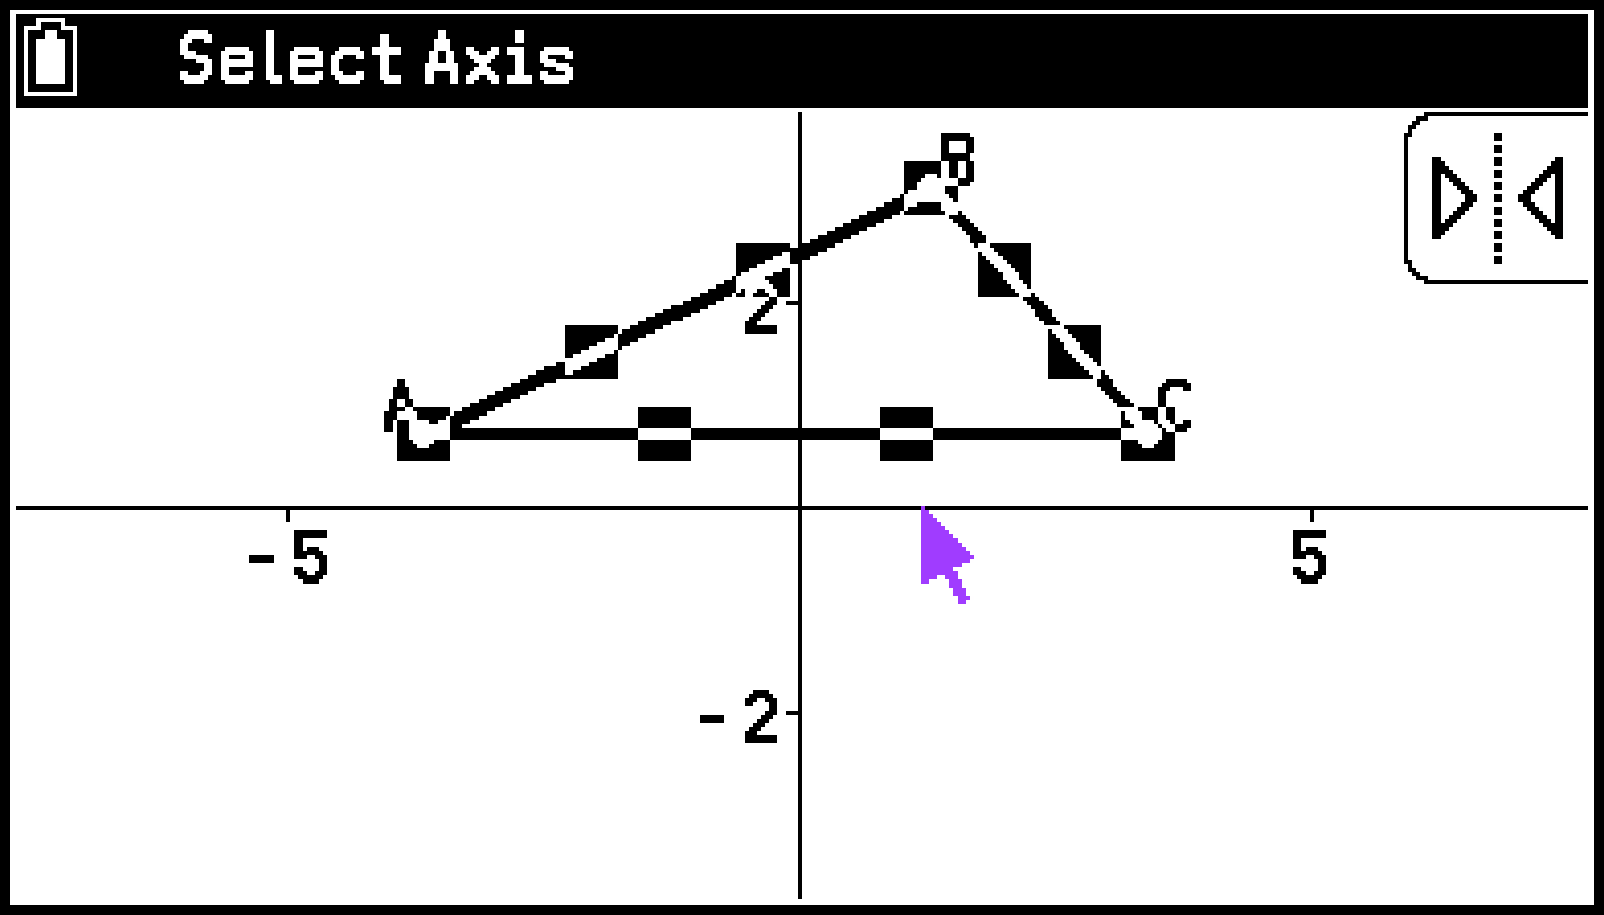
This draws the triangle by shifting it symmetrically on the -axis.
Translating an Object Using an Existing Vector
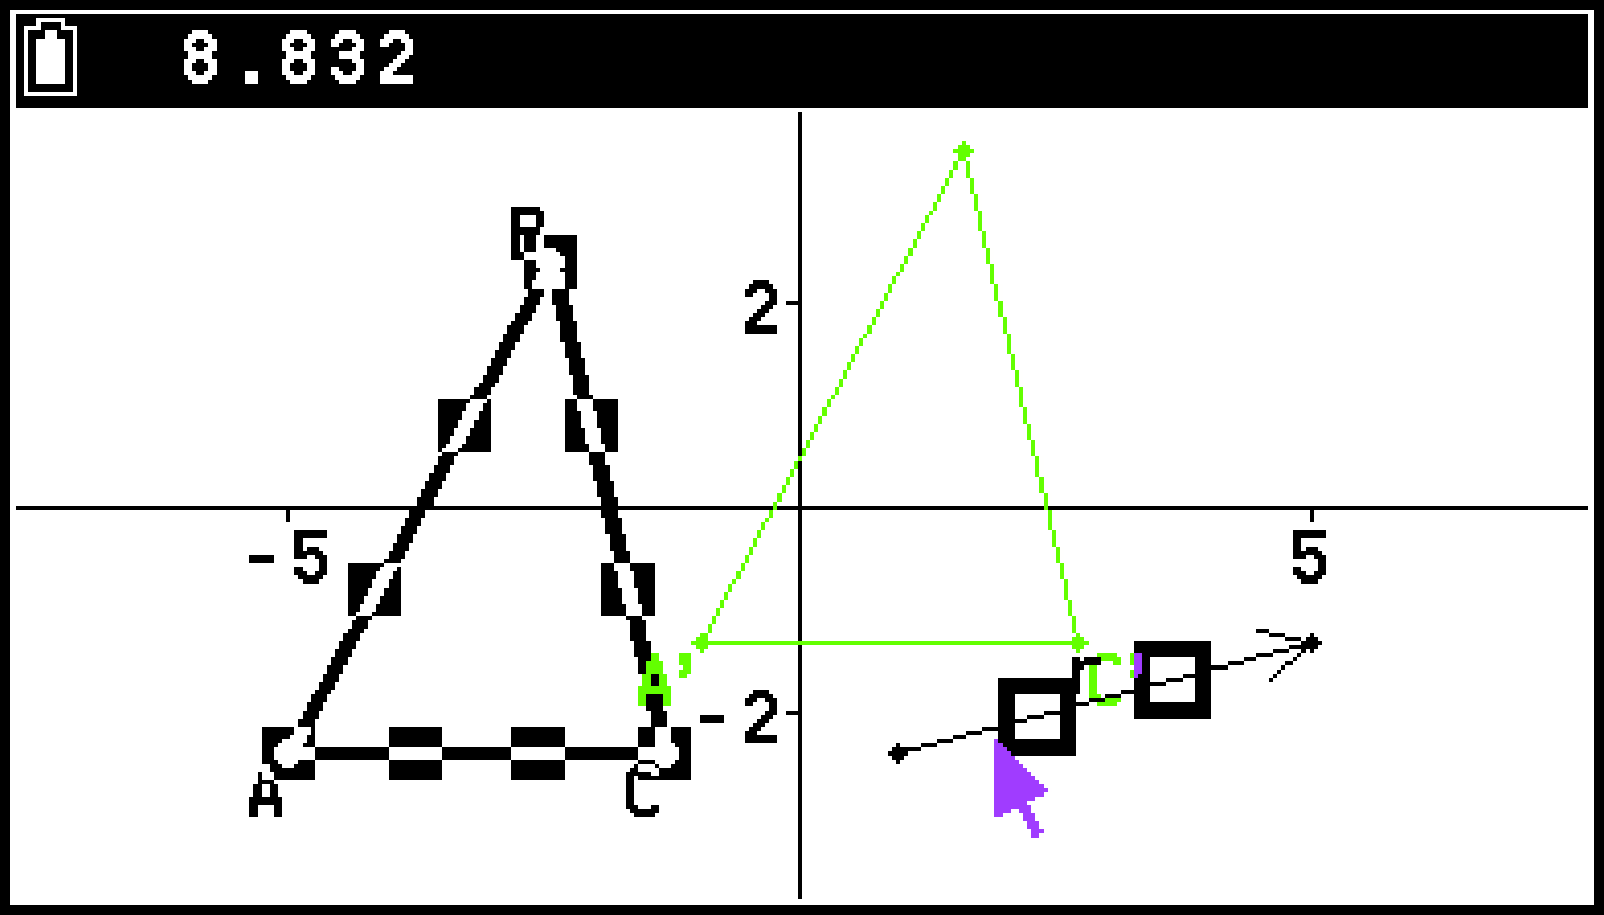
Example: To translate a triangle according to a vector direction and magnitude
-
Daw a triangle, and then draw a vector for translation.
-
Use P to select the entire triangle. For more information about how to select the triangle, see Select an entire polygon.
-
Select T > [Transformations] > [Translation (Select Vector)].
-
Move the pointer close to the vector until
 marks appear on it.
 -
Press O.
This causes the message “Select Vector” to appear.
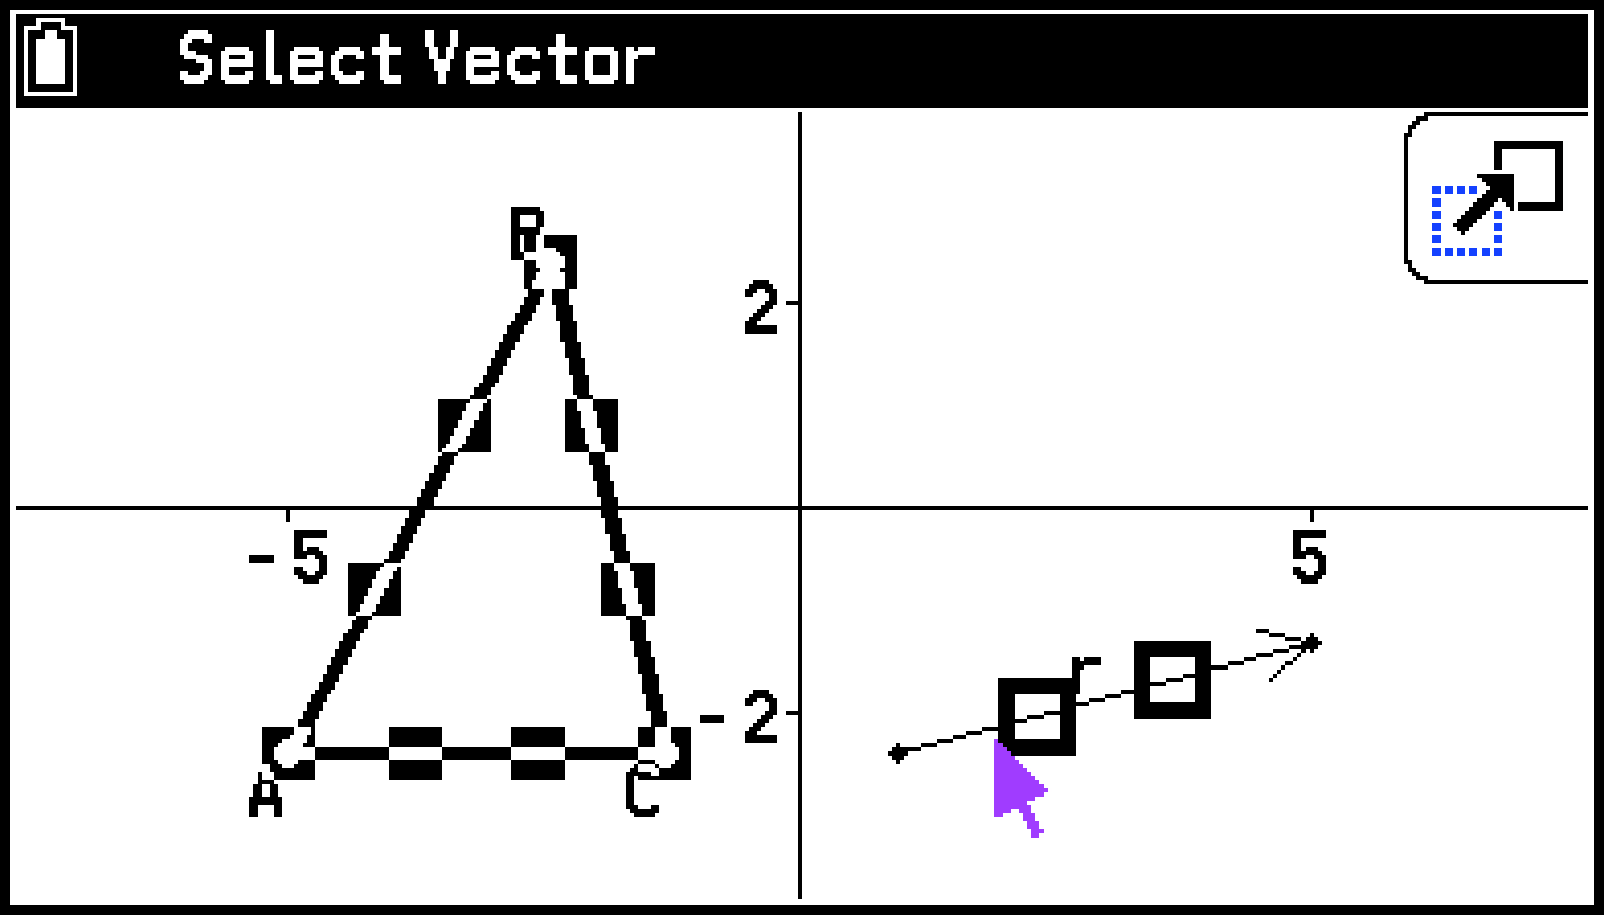
The triangle is translated according to the selected vector.
Note
If you select only part of an object before performing step 3 of the above procedure, only the selected part is translated.
Other Transformation Operations
Before starting any of the operations shown in the table below, draw the figure you want to transform and then select the entire figure. If you select only part of an object, only the selected part is transformed.
|
To do this: |
Select this menu item: |
And then perform this operation: |
|---|---|---|
|
Translate an object by specified values |
T > [Transformations] > [Translation (Enter Vector)] |
|
|
Rotate an object |
T > [Transformations] > [Rotation] |
|
|
Dilate an object |
T > [Transformations] > [Dilation] |
See the figure in the Note below for details about the meanings of the terms used during the dilation operation. |
|
Rotate an object 180 degrees on a specified point |
T > [Transformations] > [Point Reflection] |
While the message “Select Center Point” is displayed, move the pointer to the location you want to specify as the center of rotation, and then press O. This draws the figure rotated 180 degrees on the selected point. In addition, a point is plotted at the center point. |
Note
The following figure illustrates the meanings of the terms used in the dilation procedure above.
Center of Dilation
Original Object
Scale: -1
Scale: 0.5
Scale: 2
Using the Measurement Box
Pressing V displays a measurement box at the bottom of the screen. Press b twice to hide the measurement box.
You can use the measurement box to view the measurements of an object, to specify a measurement of an object, to lock a measurement of an object, or to name an object.
Viewing the Measurements of an Object
The type of information that can be displayed in the measurement box depends on the object currently selected on the screen. The nearby screen shows an example when a circle is selected.
You can change the display information type by highlighting the up arrow button to the left of the measurement box, pressing O, and then using the cursor keys to highlight the appropriate icon on the icon palette that appears.

The table below describes the information that appears in the measurement box when you select each icon and explains when each icon is available for selection.
Measurement Icon Table
|
Icon*1 |
This icon is available for selection when: |
Selecting this icon displays: |
|
|---|---|---|---|
|
|
( |
A single point is selected. |
Coordinates of the point |
|
|
( |
Two points are selected, or a single line segment or vector is selected. |
Distance between two points, length of a line segment or vector |
|
|
( |
A single line, ray, line segment, or vector is selected. |
Slope of the line, ray, line segment, or vector |
|
|
( |
Two of the following line elements in any combination are selected: lines, line segments, rays, or vectors.*2 |
Angle and its supplement formed by the two objects |
|
|
( |
||
|
|
( |
A single circle, semicircle, or arc is selected. |
Radius of circle, semicircle, or arc |
|
|
( |
A single circle, semicircle, or arc is selected. |
Length of the circumference |
|
|
|
A single polygon is selected. |
Sum of the lengths of the sides |
|
|
( |
A single circle, semicircle, arc, or polygon is selected, or any three points are selected. |
Area*4 |
|
|
|
A single line or line segment, ray, circle, semicircle, arc, or function graph is selected. |
Function of the object (using rectangular coordinates) |
|
|
( |
A single vector is selected. |
Vector components |
|
|
( |
Two circles, two arcs, a line and circle, or a line and arc are selected. |
Whether the two items are tangent |
|
|
( |
Two line segments are selected. |
Whether the line segments are the same length |
|
|
( |
A point and line, a point and arc, a point and circle, or a point and vector are selected. |
Whether the point is on the line/curve |
|
|
|
Two points created by the Rotation command are selected. |
Angle of rotation |
|
|
|
Two points created by the Dilation command are selected. |
Scale of dilation |
|
|
|
A point or pasted measurement*5 that has a label or an object that can be named is selected. |
Label text |
|
|
|
A single expression is selected (“EXPR=” object). |
Calculation expression |
“![]() ” to the right of the icon indicates that the measurement is lockable. See Locking or Unlocking a Measurement of an Object for information about lock operations.
” to the right of the icon indicates that the measurement is lockable. See Locking or Unlocking a Measurement of an Object for information about lock operations.
When two vectors are selected, the angle that is displayed in the measurement box does not mean the angle formed mathematically by the two vectors. It merely indicates the simple angle that would be formed if the vectors were two lines.
Circumference and area measurements are lockable only when a circle is selected.
A value that shows the area of an object whose lines intersect is indicated by double asterisks (![]() ) to the left of the value. This indicates that the value may not indicate the correct area.
) to the left of the value. This indicates that the value may not indicate the correct area.
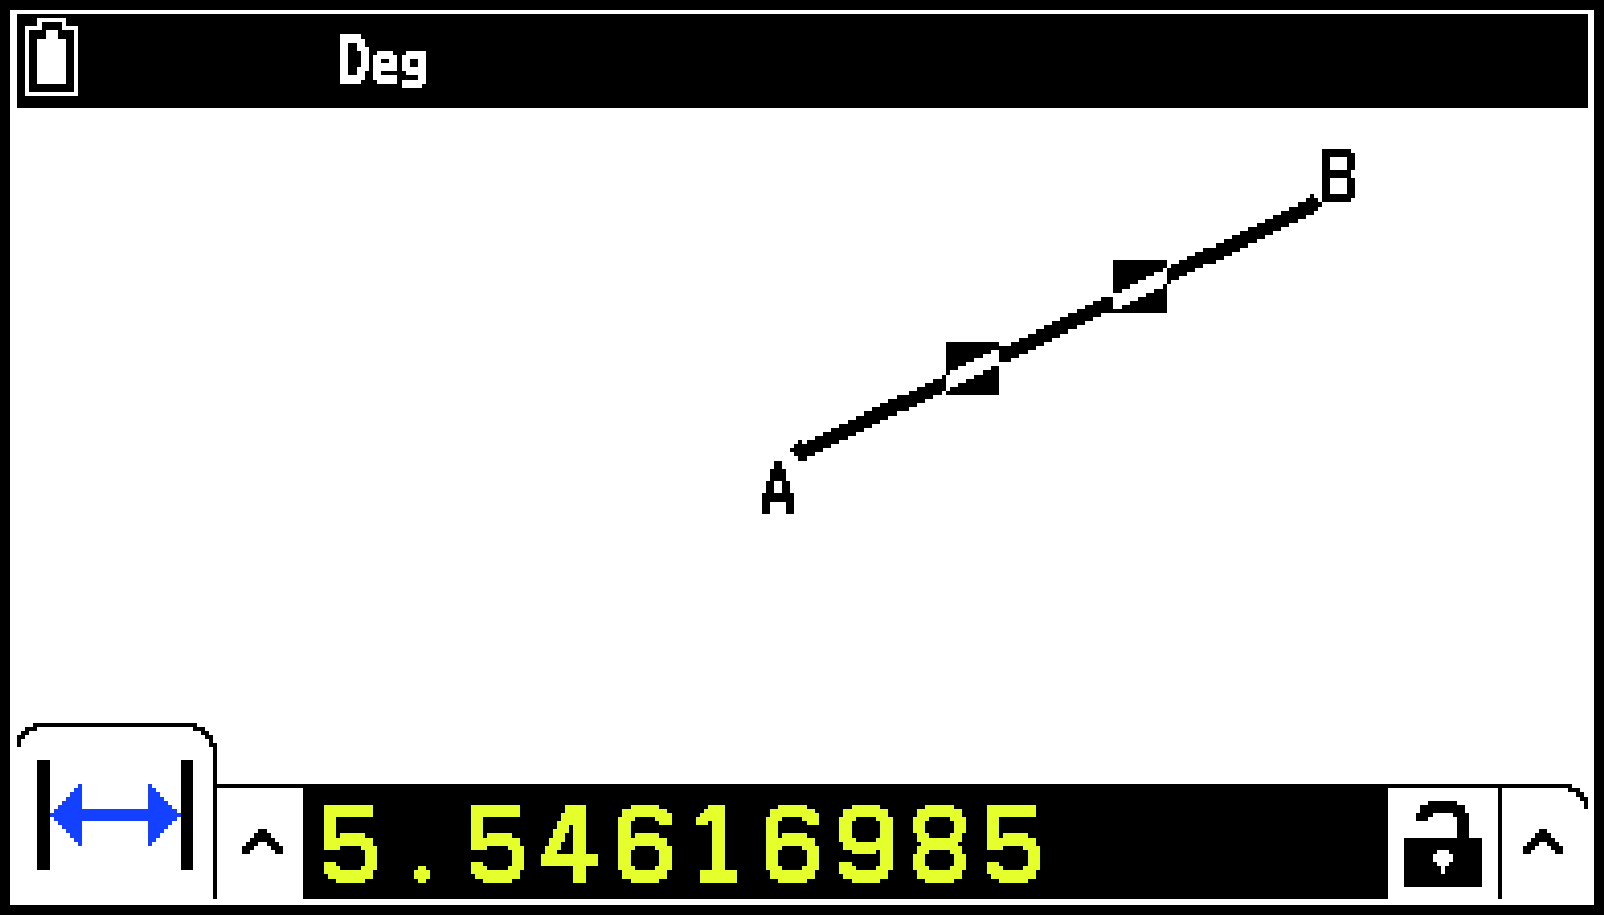
To view the measurements of a line segment
-
Draw a line segment and select it.
-
Press V to display the measurement box.
-
Press l to highlight the up arrow button to the left of the measurement box and then press O.
-
Select the icons on the icon palette to display other measurements.
-
To close the measurement box, press b twice.
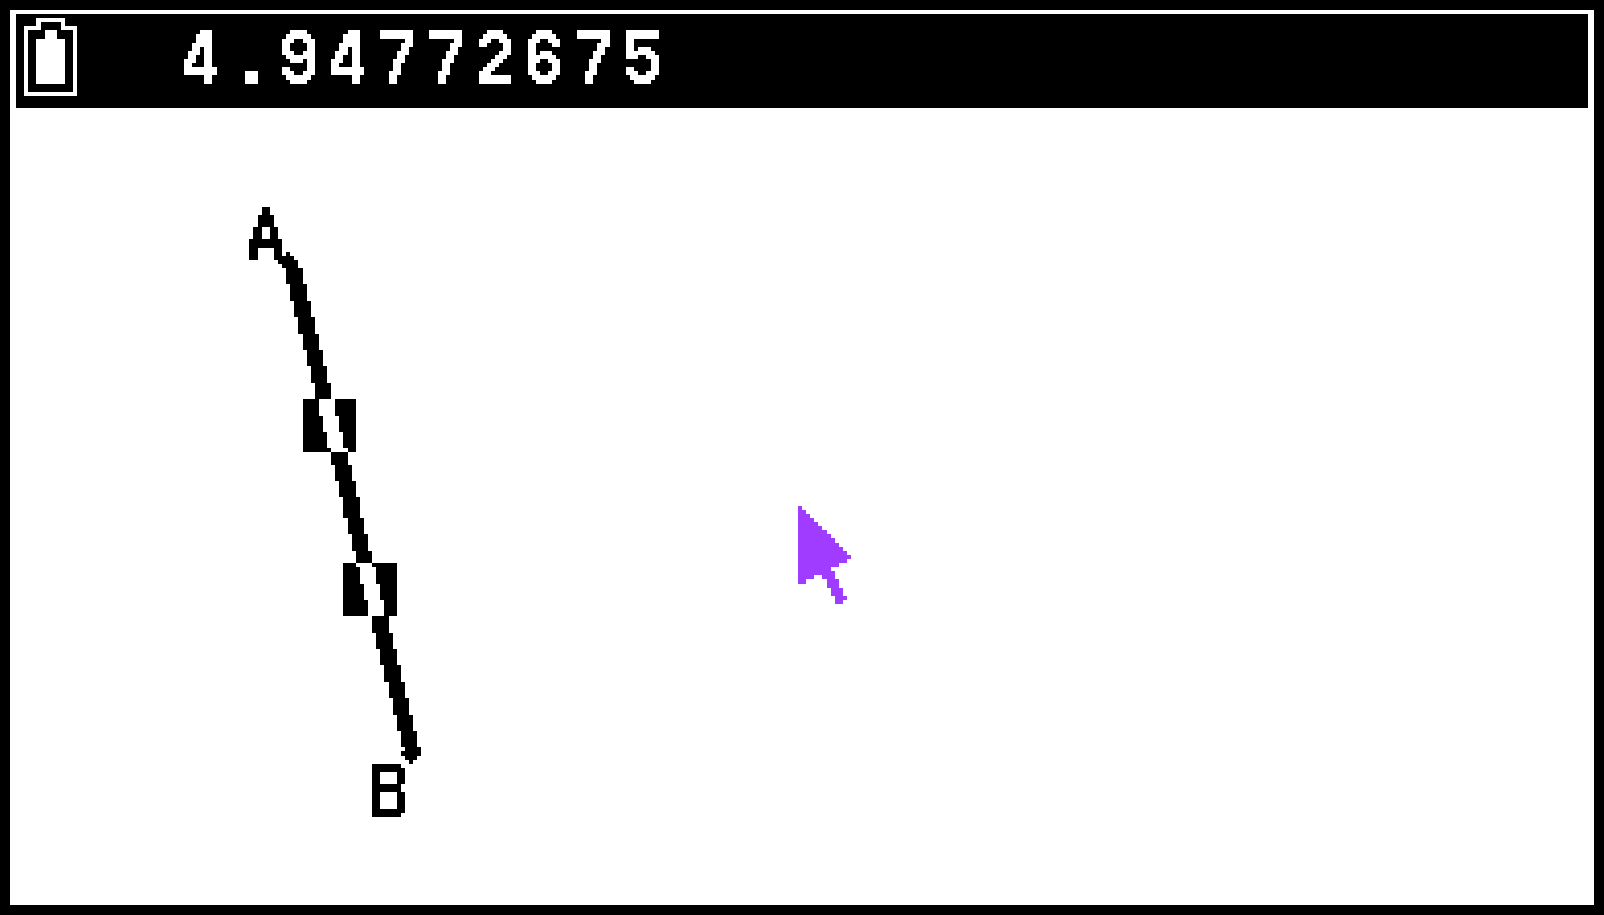
This displays the length of the line segment.
This displays an icon palette.
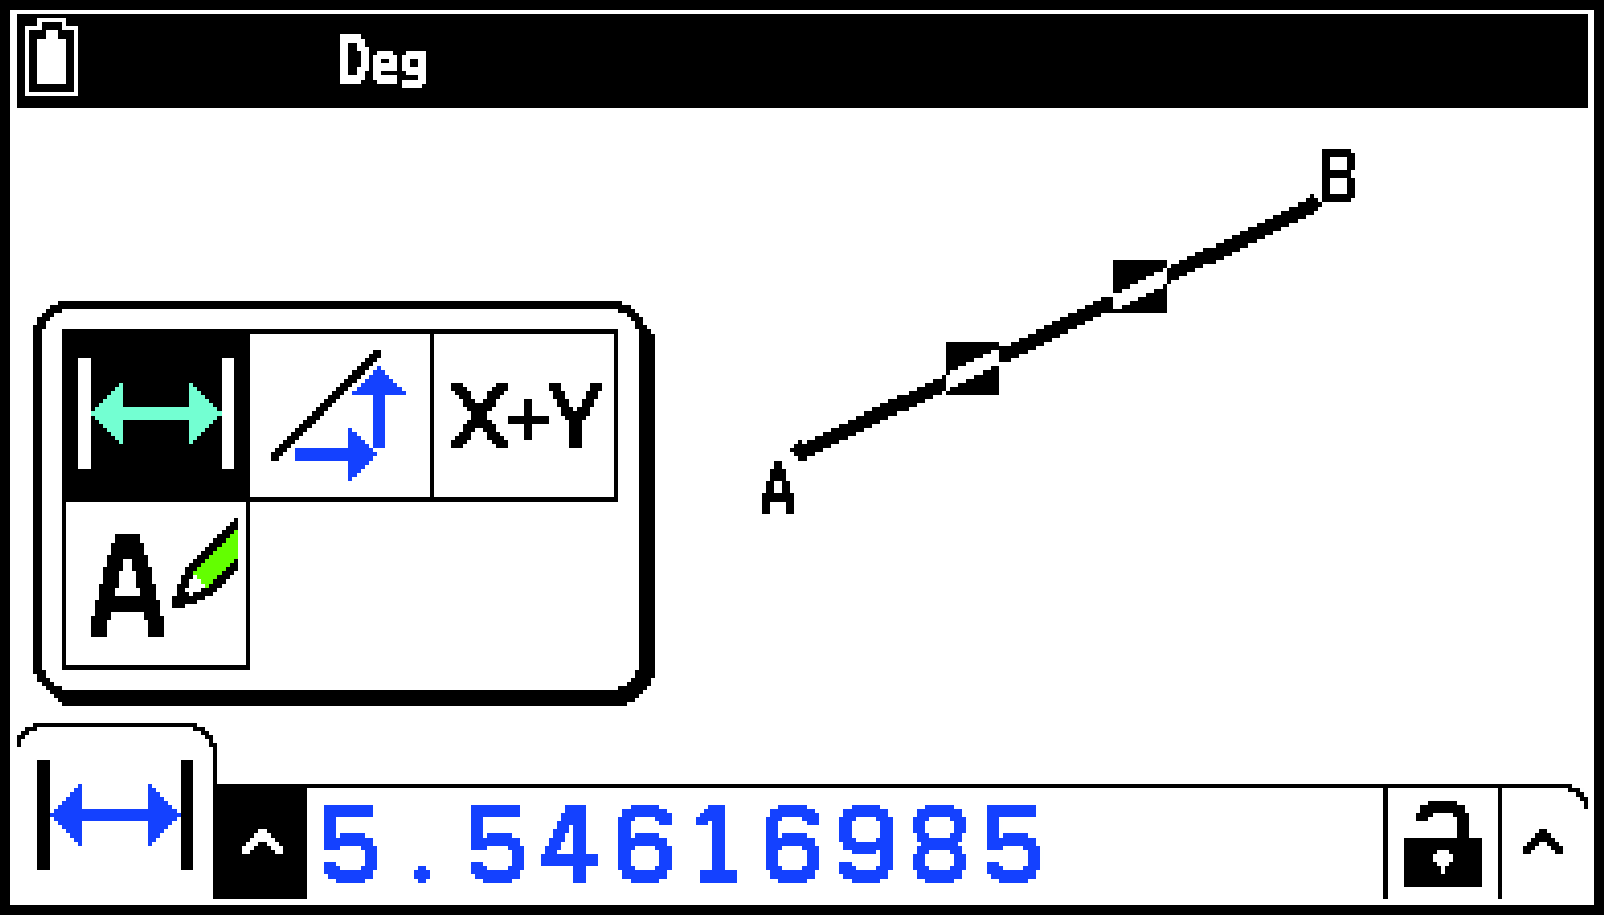
In the case of the line segment, for example, you can view its length, slope, and equation.
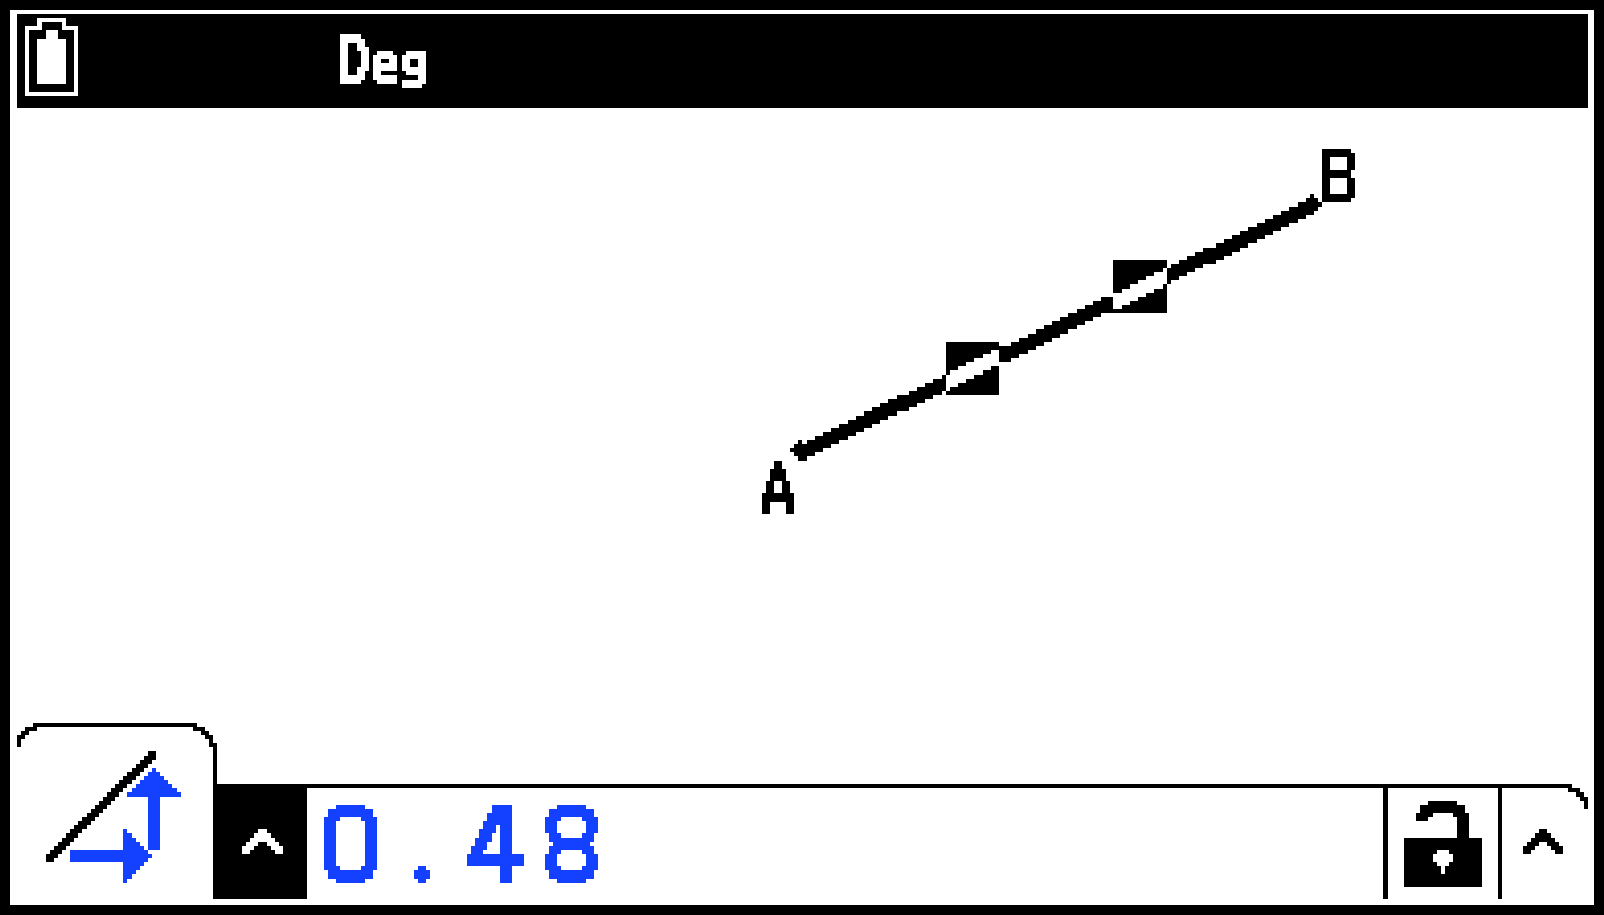
Slope
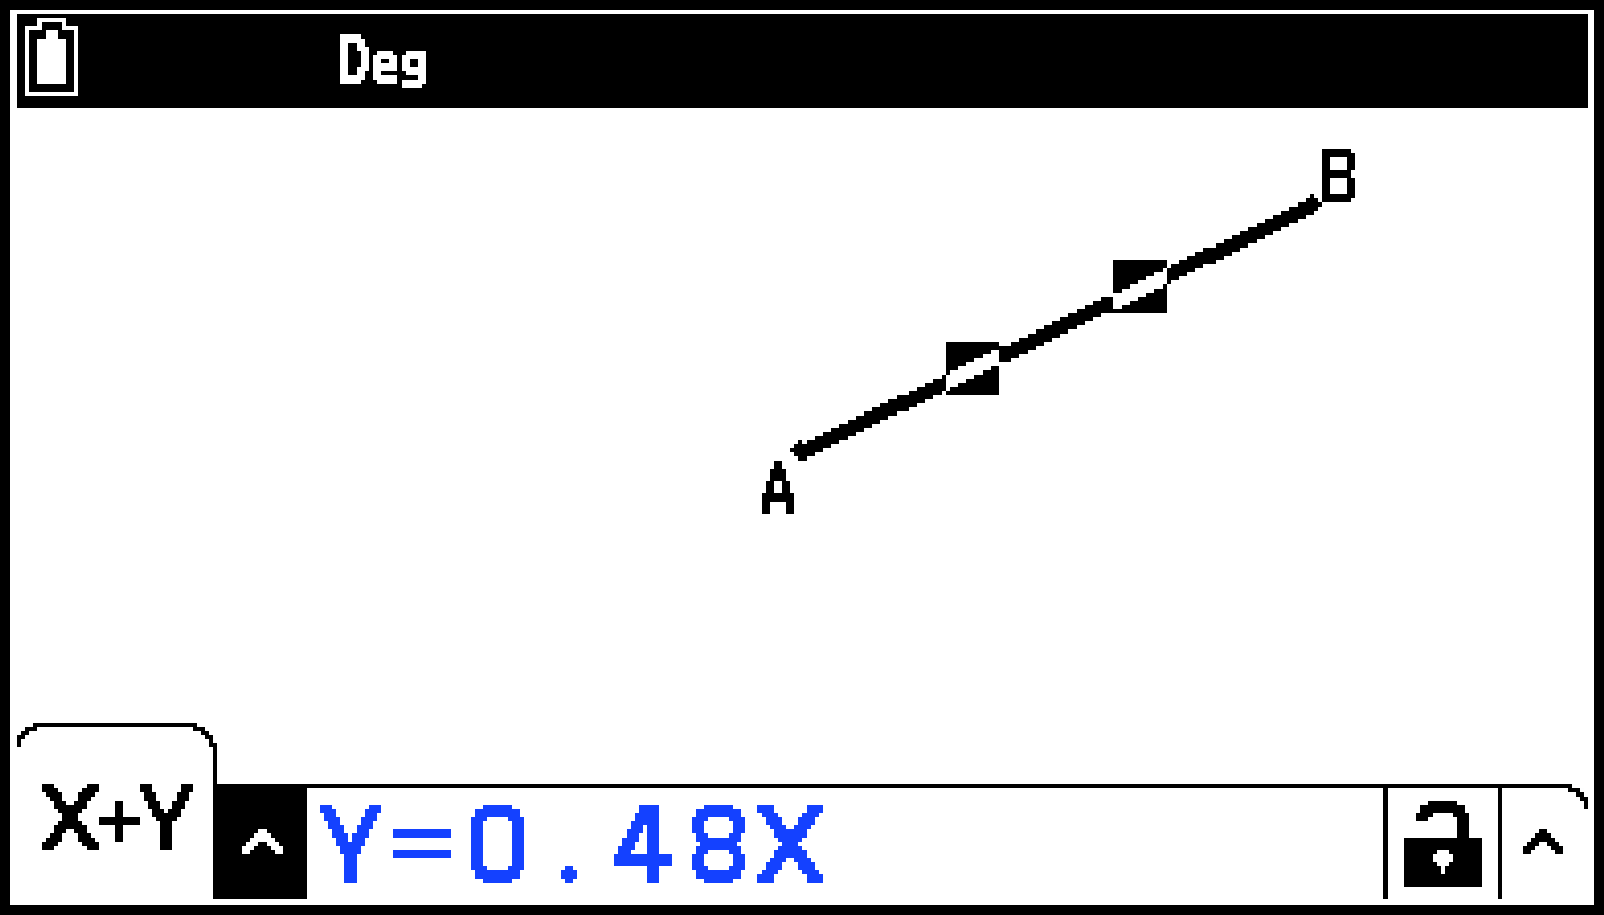
Equation
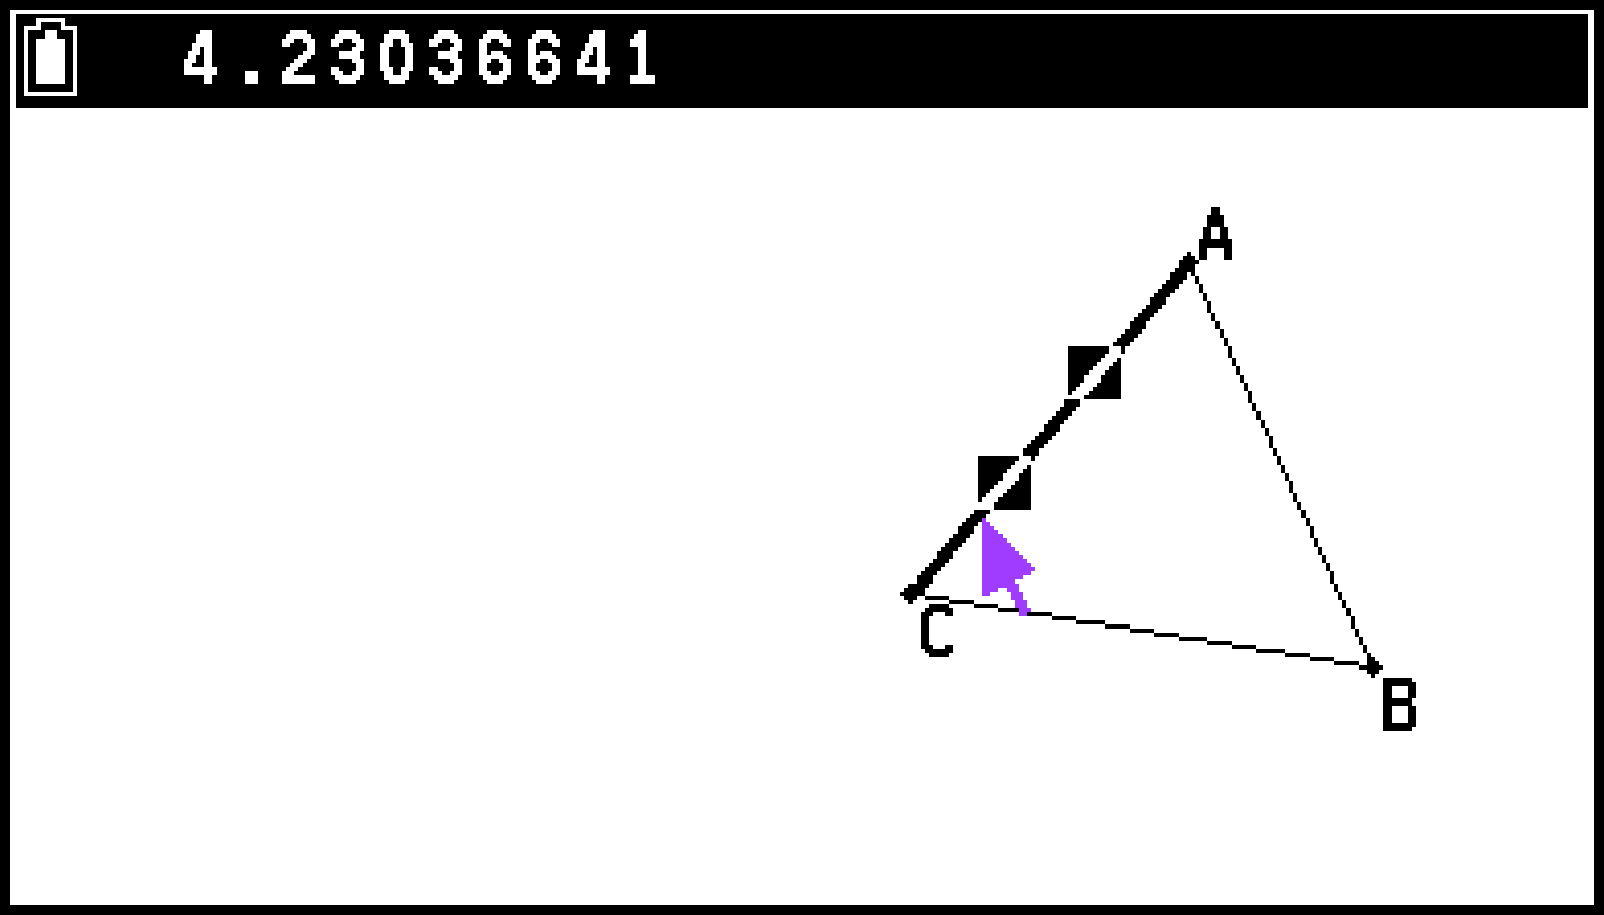
Specifying and Locking a Measurement of an Object
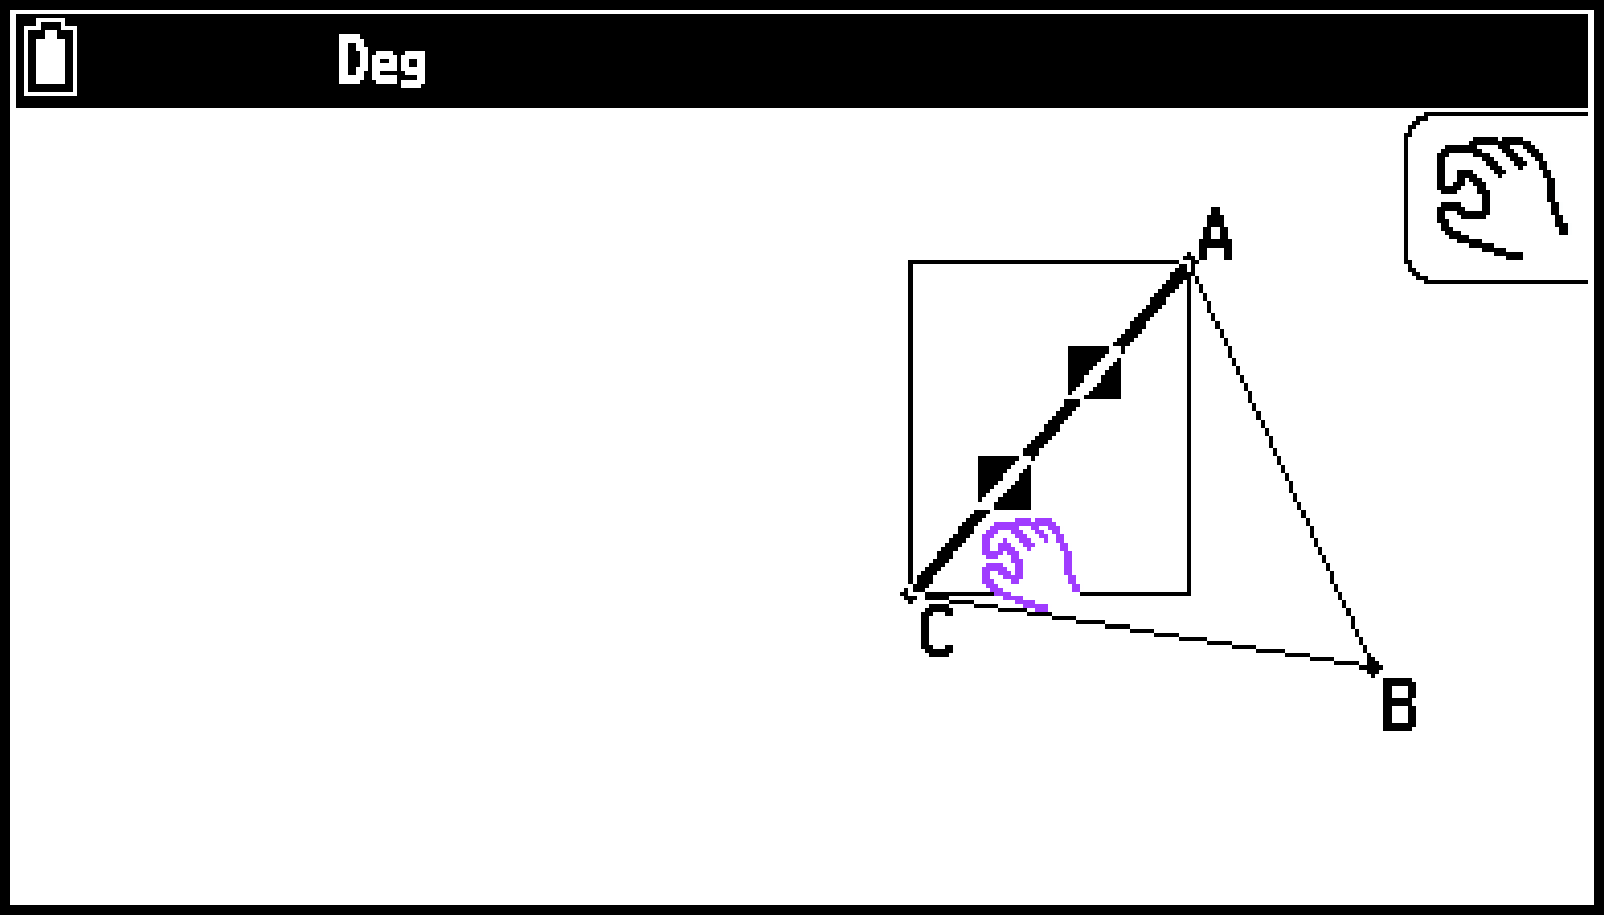
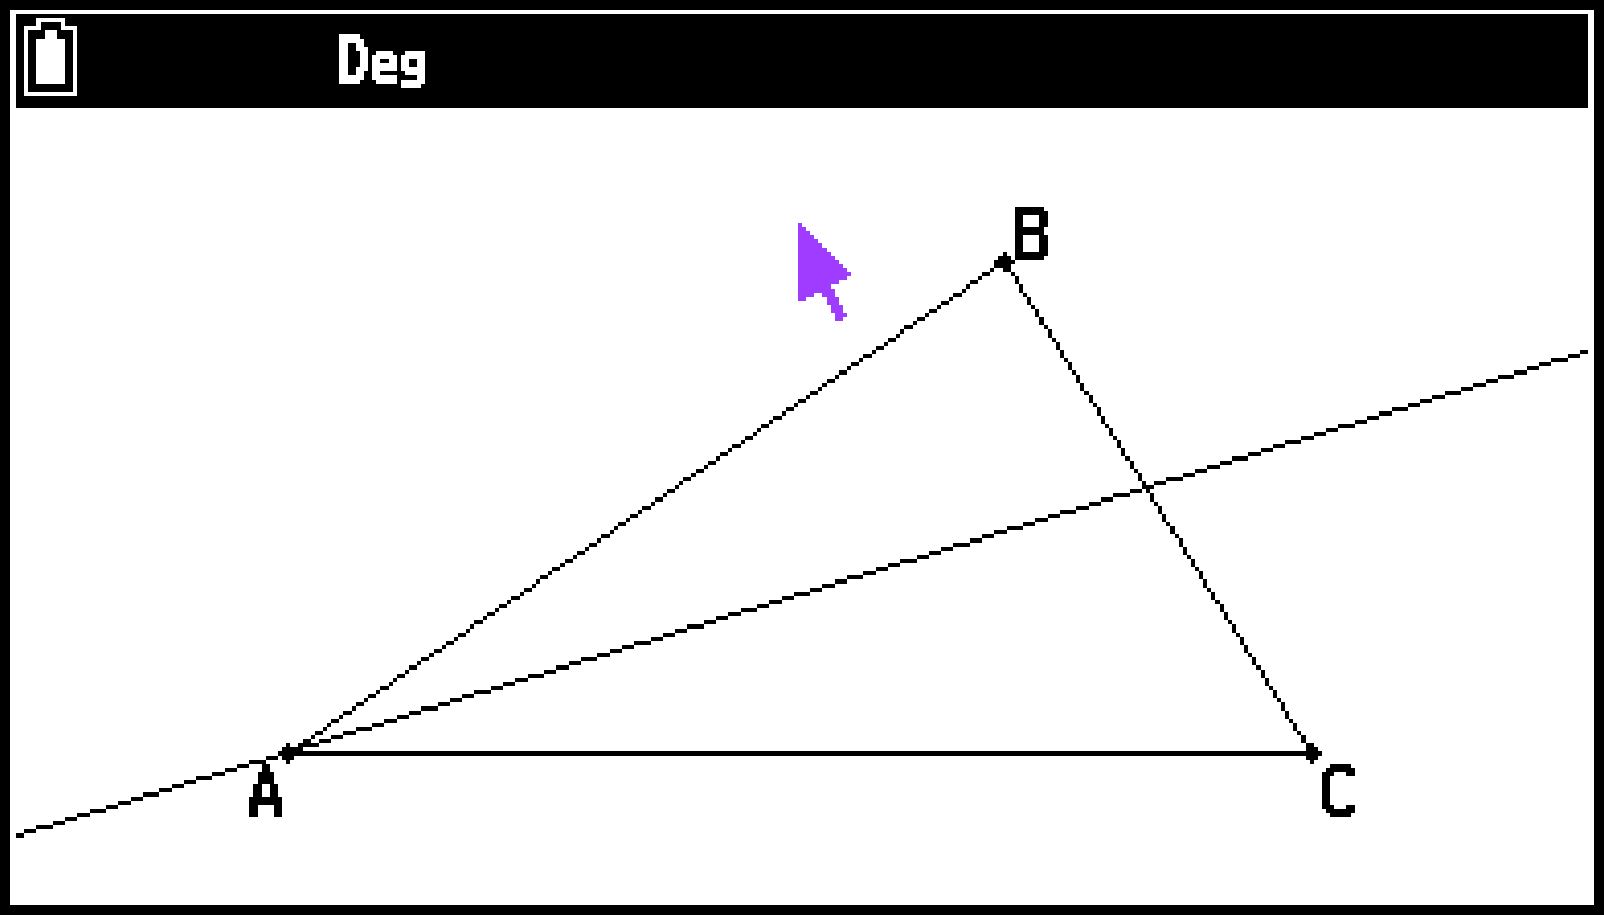
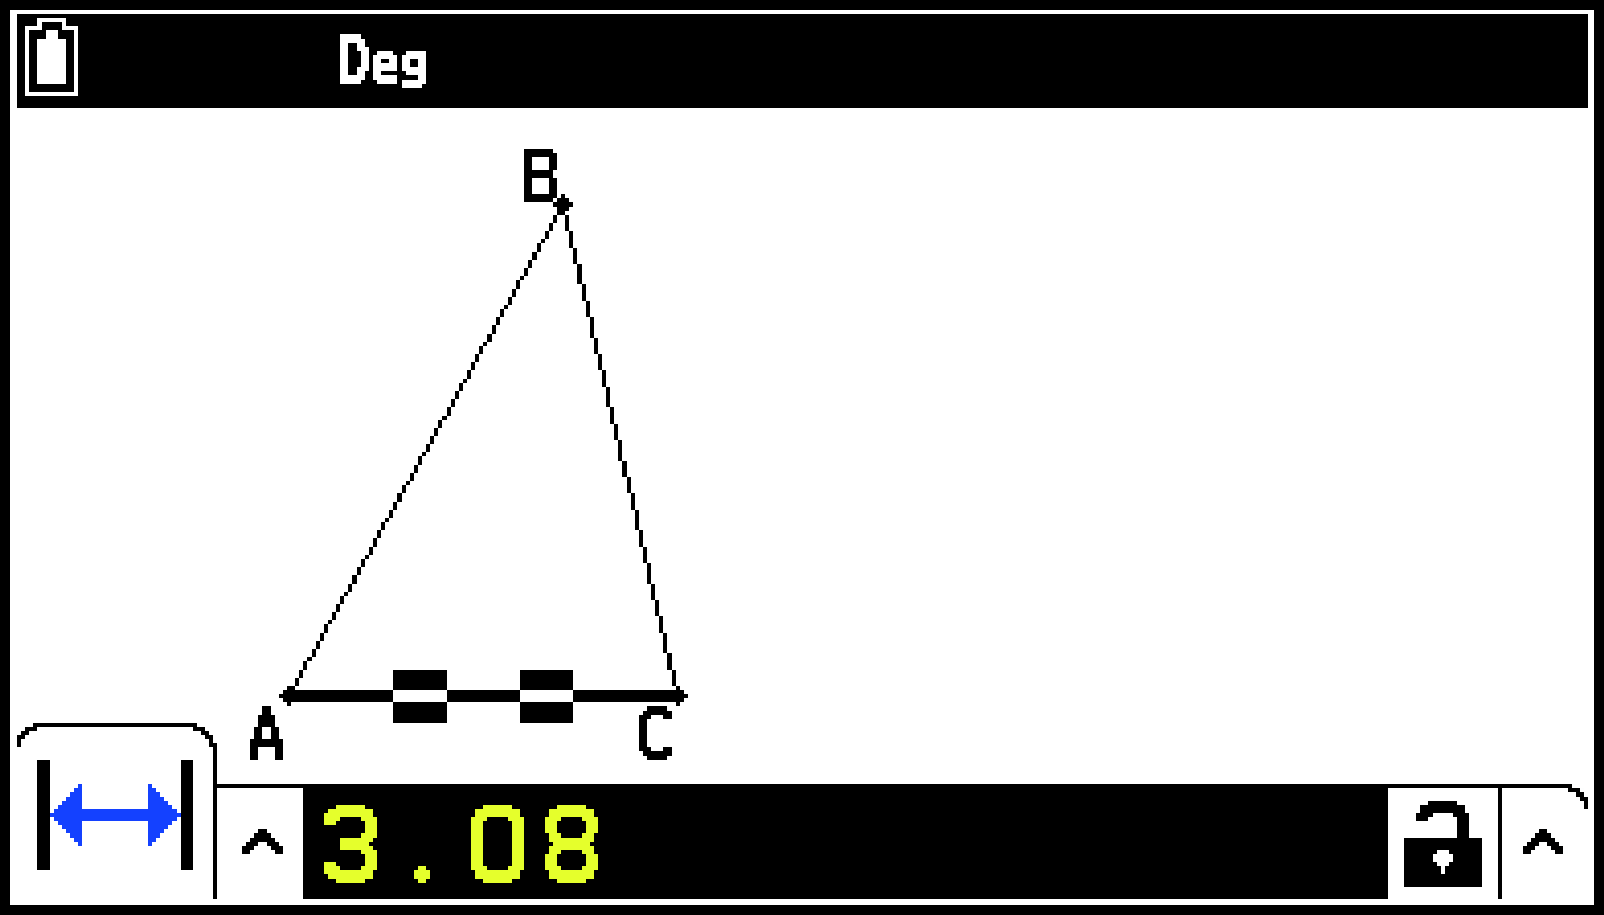
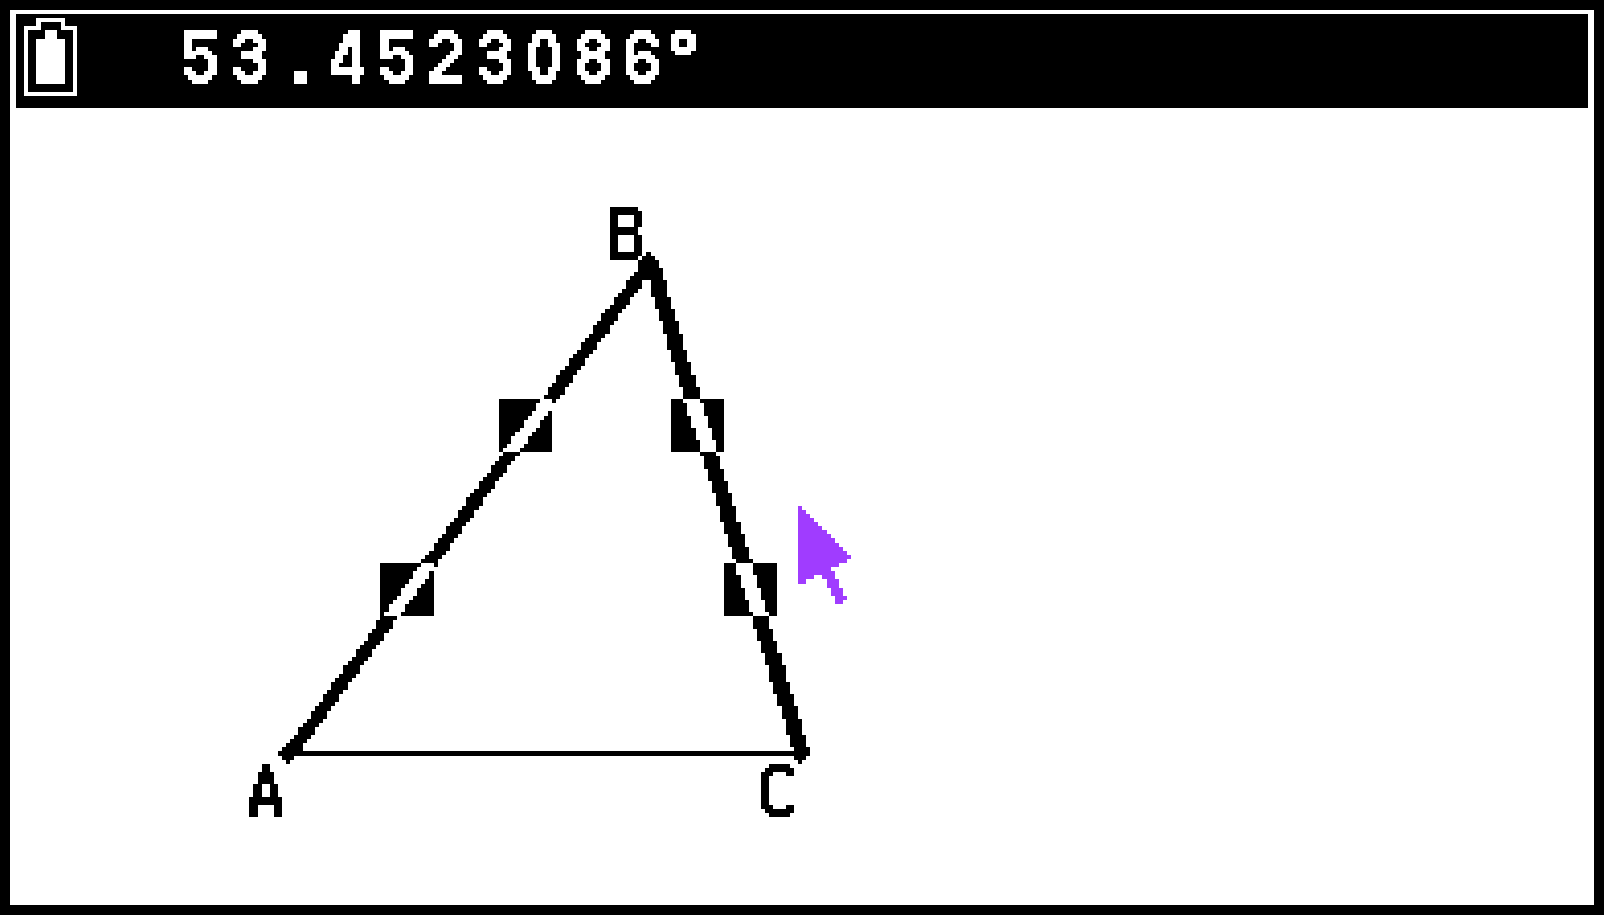
The following example shows how to specify and lock an angle of a triangle. For example, locking ∠ACB of △ABC at 90 degrees causes ∠ACB to remain at 90 degrees regardless of where the vertex is moved. In the example below, the S > [Angle] setting is set to “Degree”.
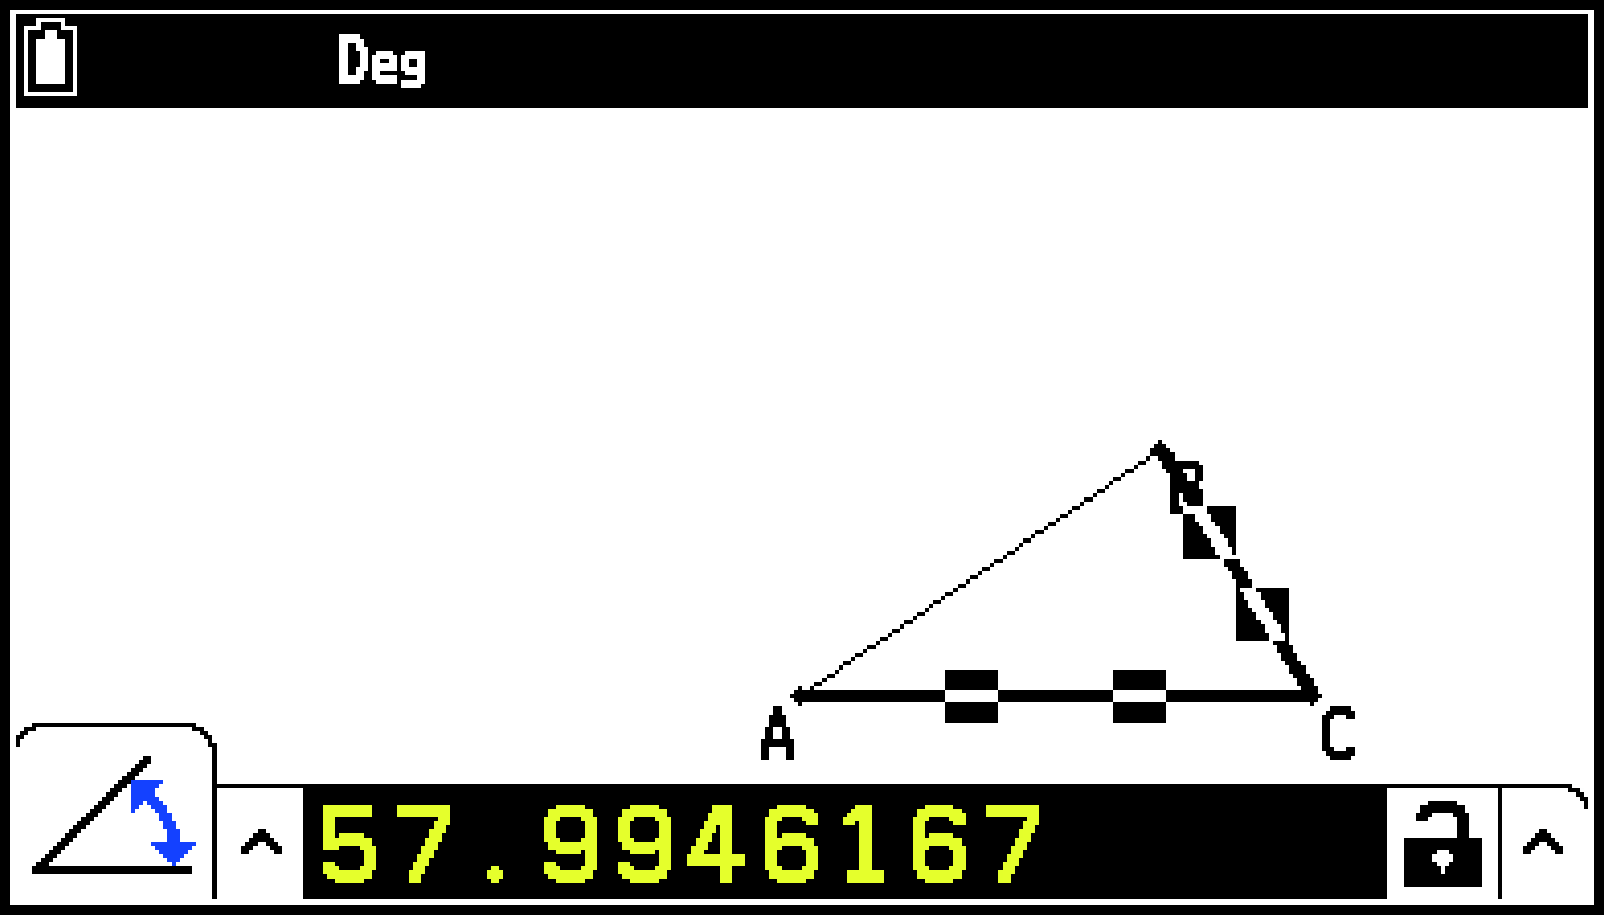
To specify and lock the measure of an angle of a triangle
-
Draw a triangle, and then select its side AC and side BC.
-
Press V to display the measurement box.
-
Input 90 into the measurement box and press E.
-
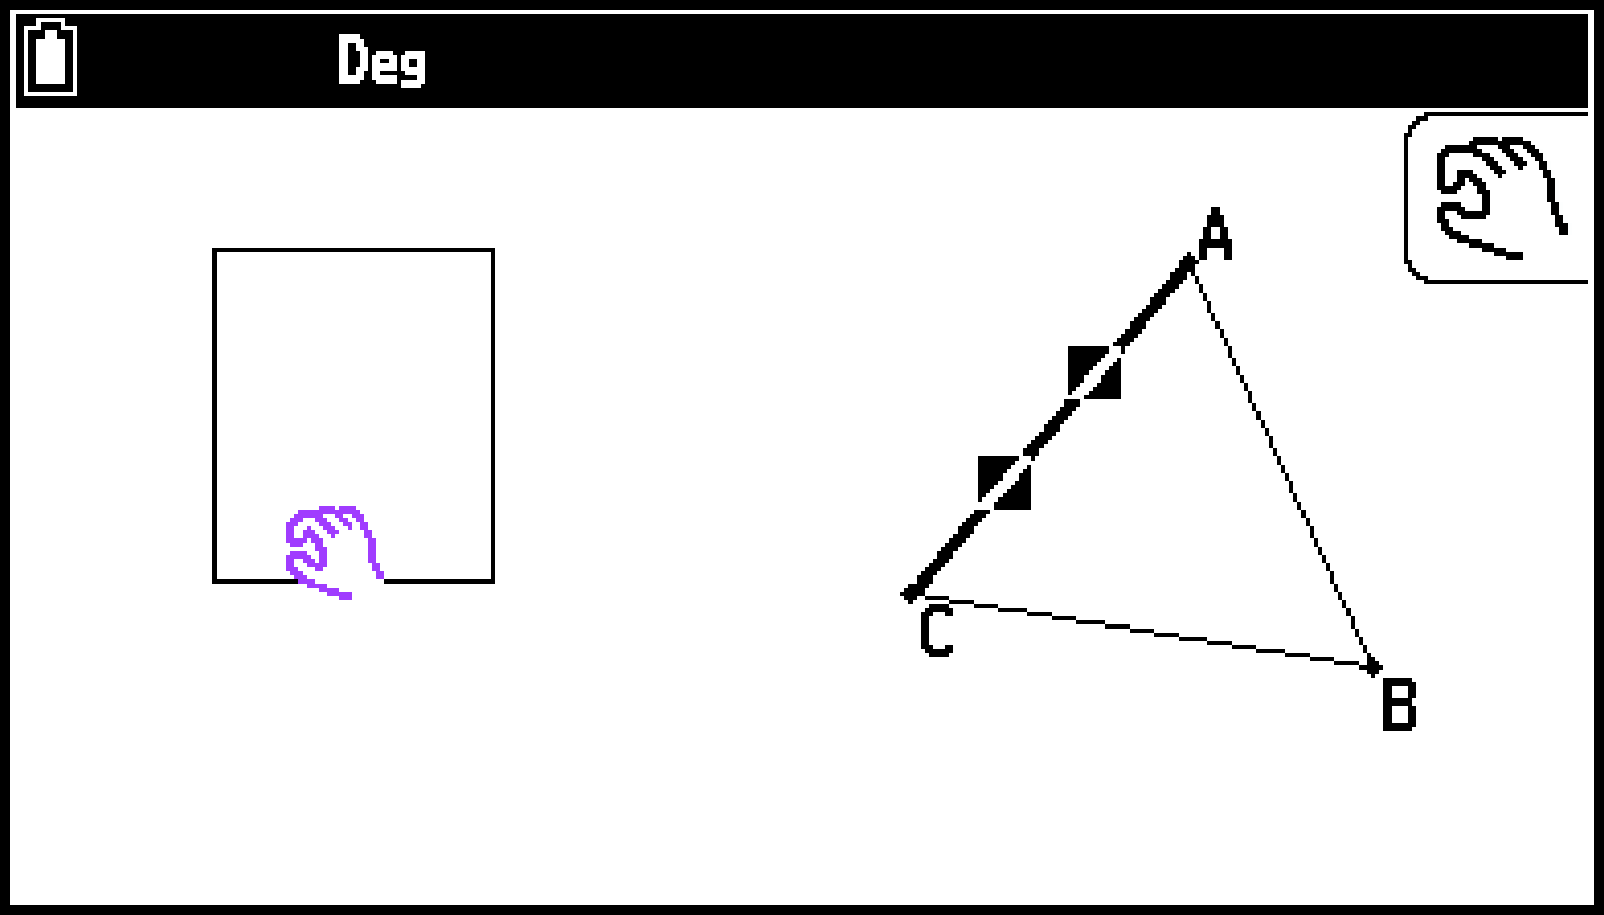
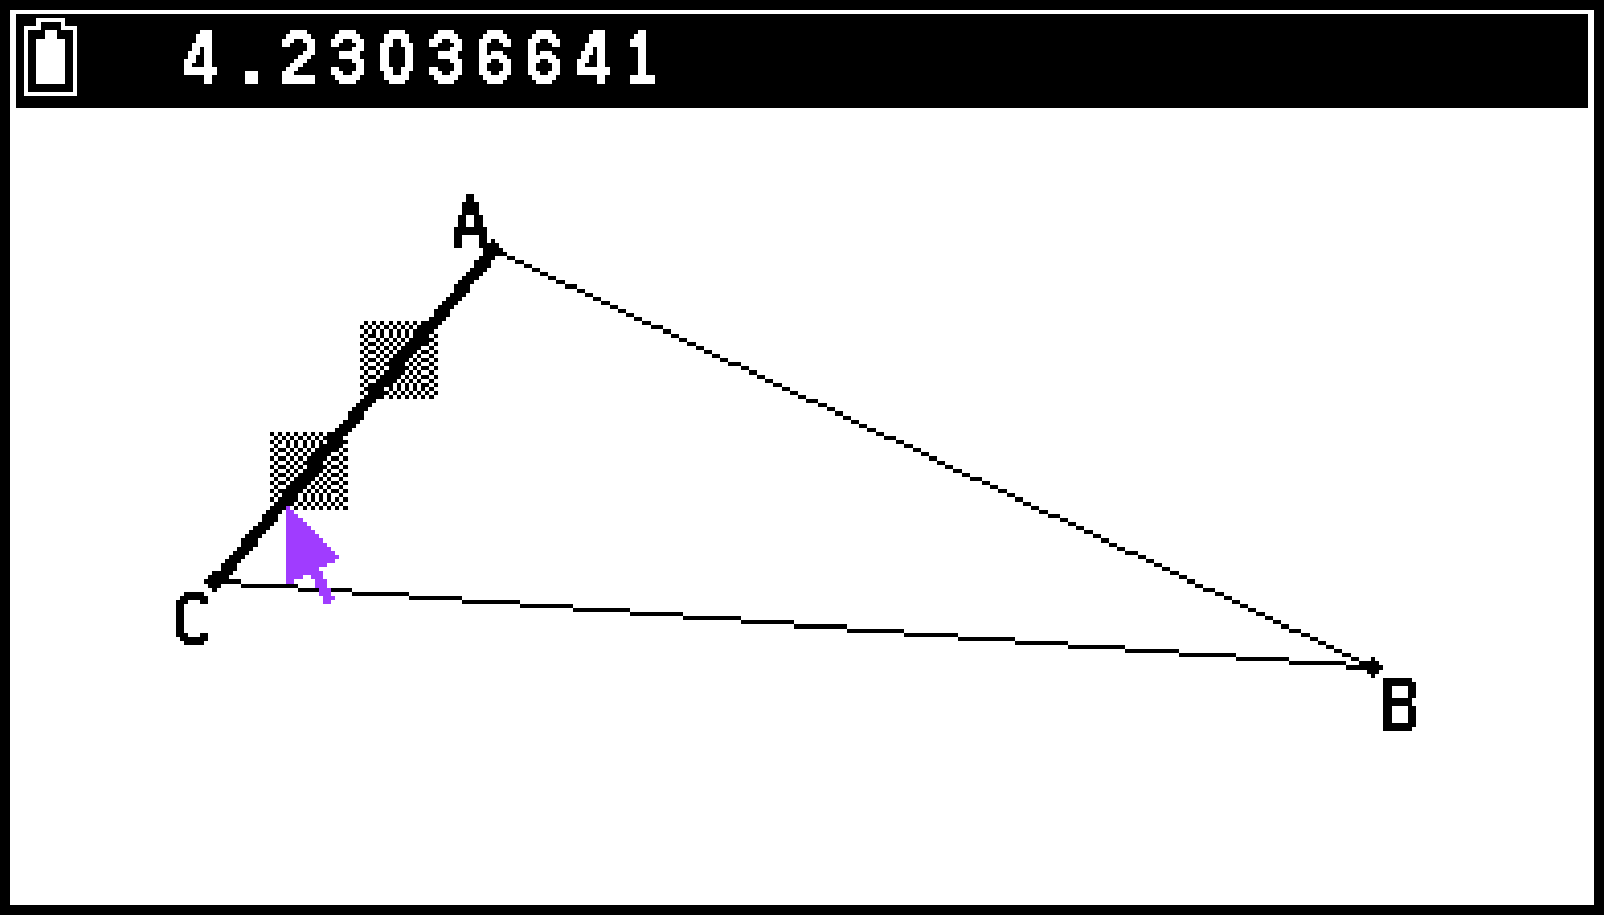
Try moving vertex B (make sure ∠ACB is locked at 90 degrees).
-
Press b twice to hide the measurement box.
-
Press a to deselect all objects.
-
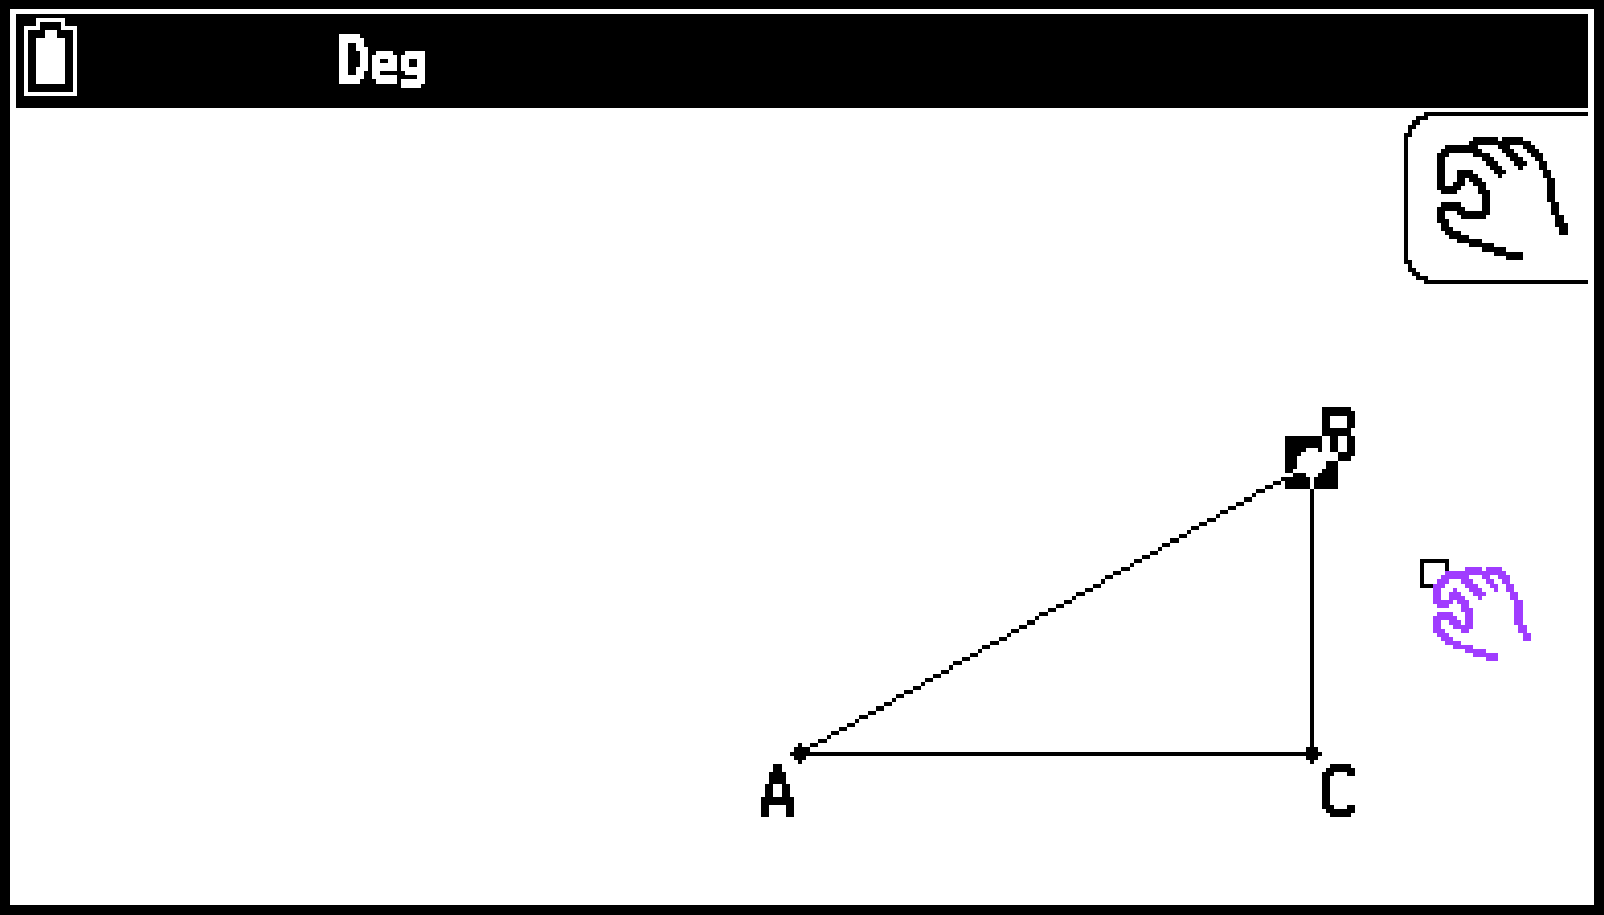
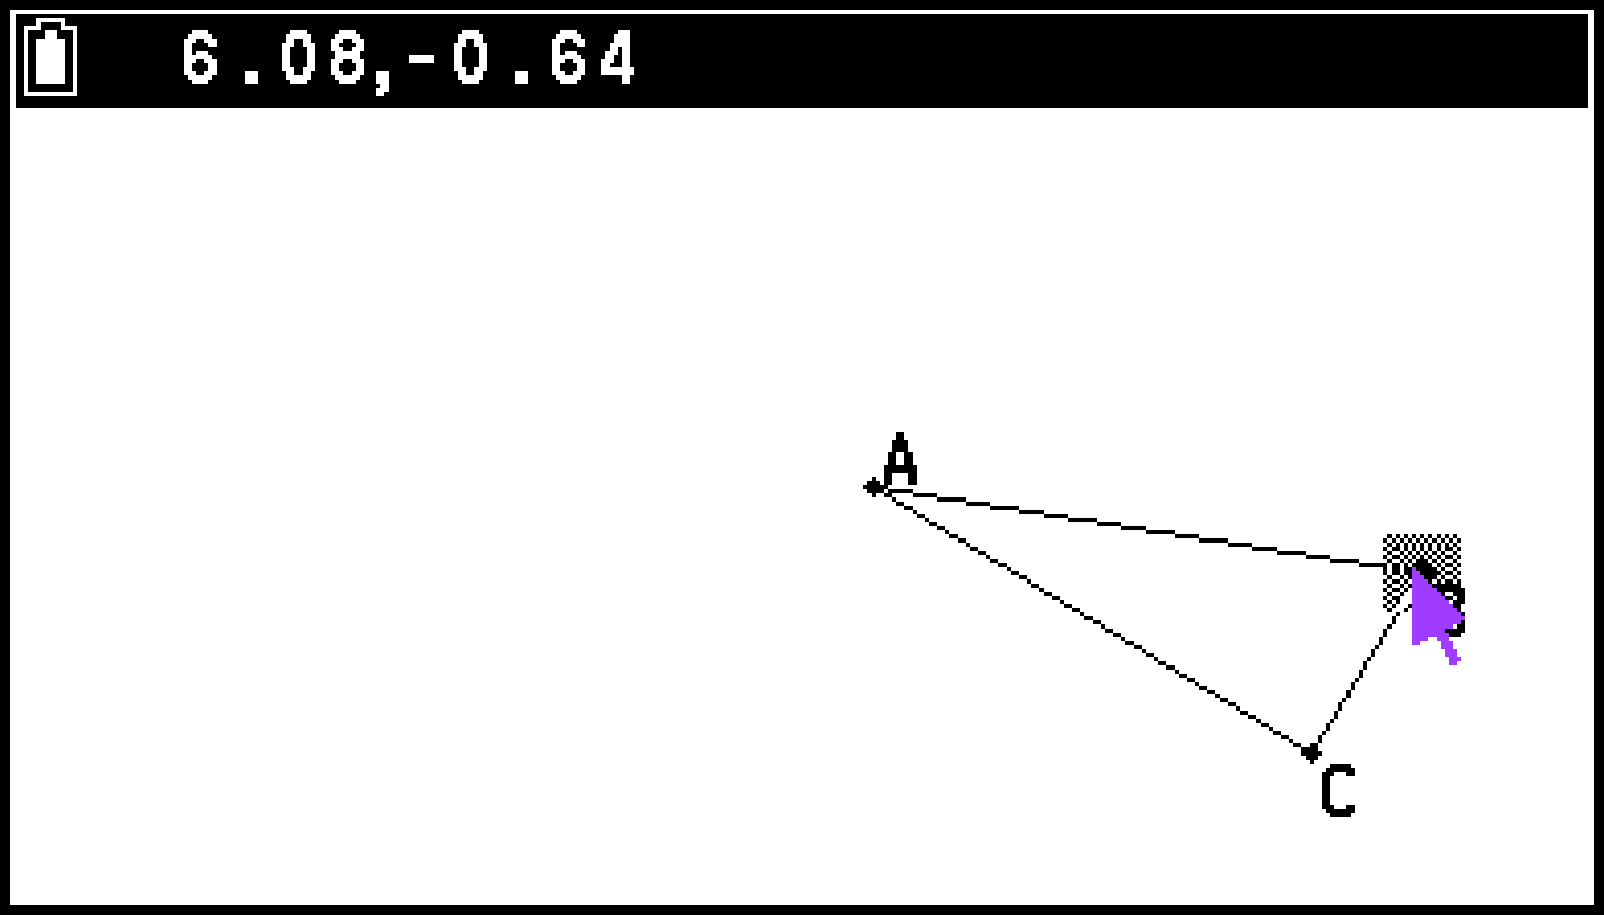
Move the pointer to vertex B and then press X. See To move an object for more information.
-
Use the cursor keys to move vertex B to the location you want and press O.
This displays the measure of ∠ACB in the measurement box.
At this time, the icon to the right of the measurement box is ![]() (unlocked).
(unlocked).
This specifies and locks the measure of ∠ACB at 90 degrees.
This causes the icon to the right of the measurement box to change to ![]() (locked), indicating that the angle is locked.
(locked), indicating that the angle is locked.
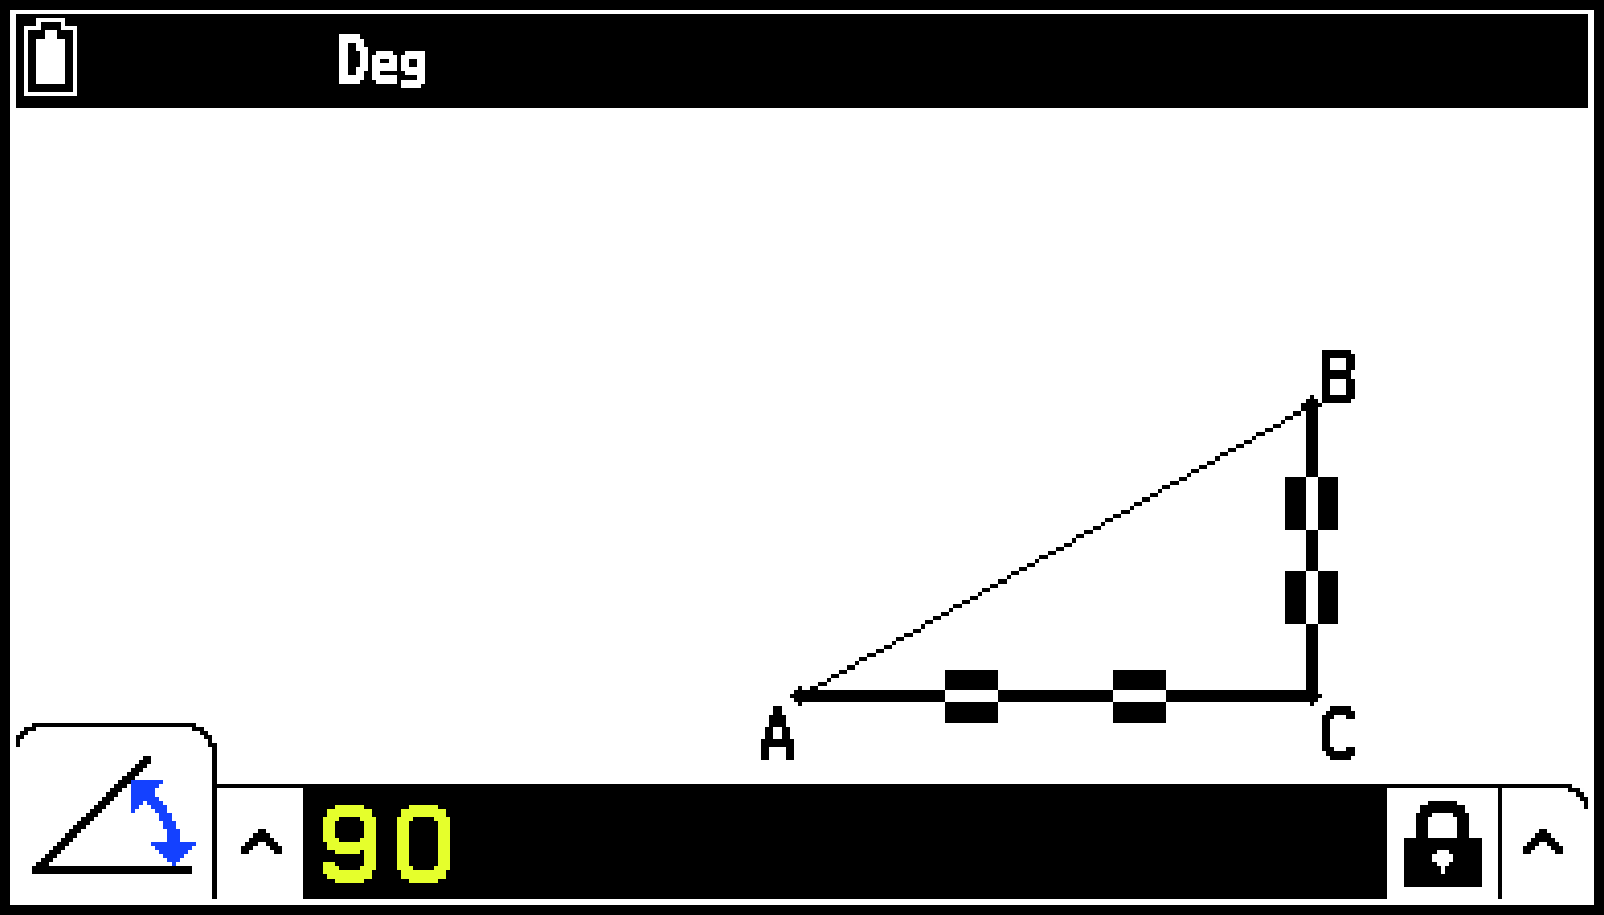
Vertex A moves so ∠ACB maintains 90 degrees.
Note
Specifying any one of the following measurements for the first time in the file you are editing (or immediately after an all-clear operation (T > [Edit] > [Clear All]) causes the resulting object to be resized so it fits within the display area.
Length of one side of a triangle
Length of a line segment or vector
Length of one side of a rectangle, square, polygon, or regular n-gon
Circumference of a circle or length of an arc
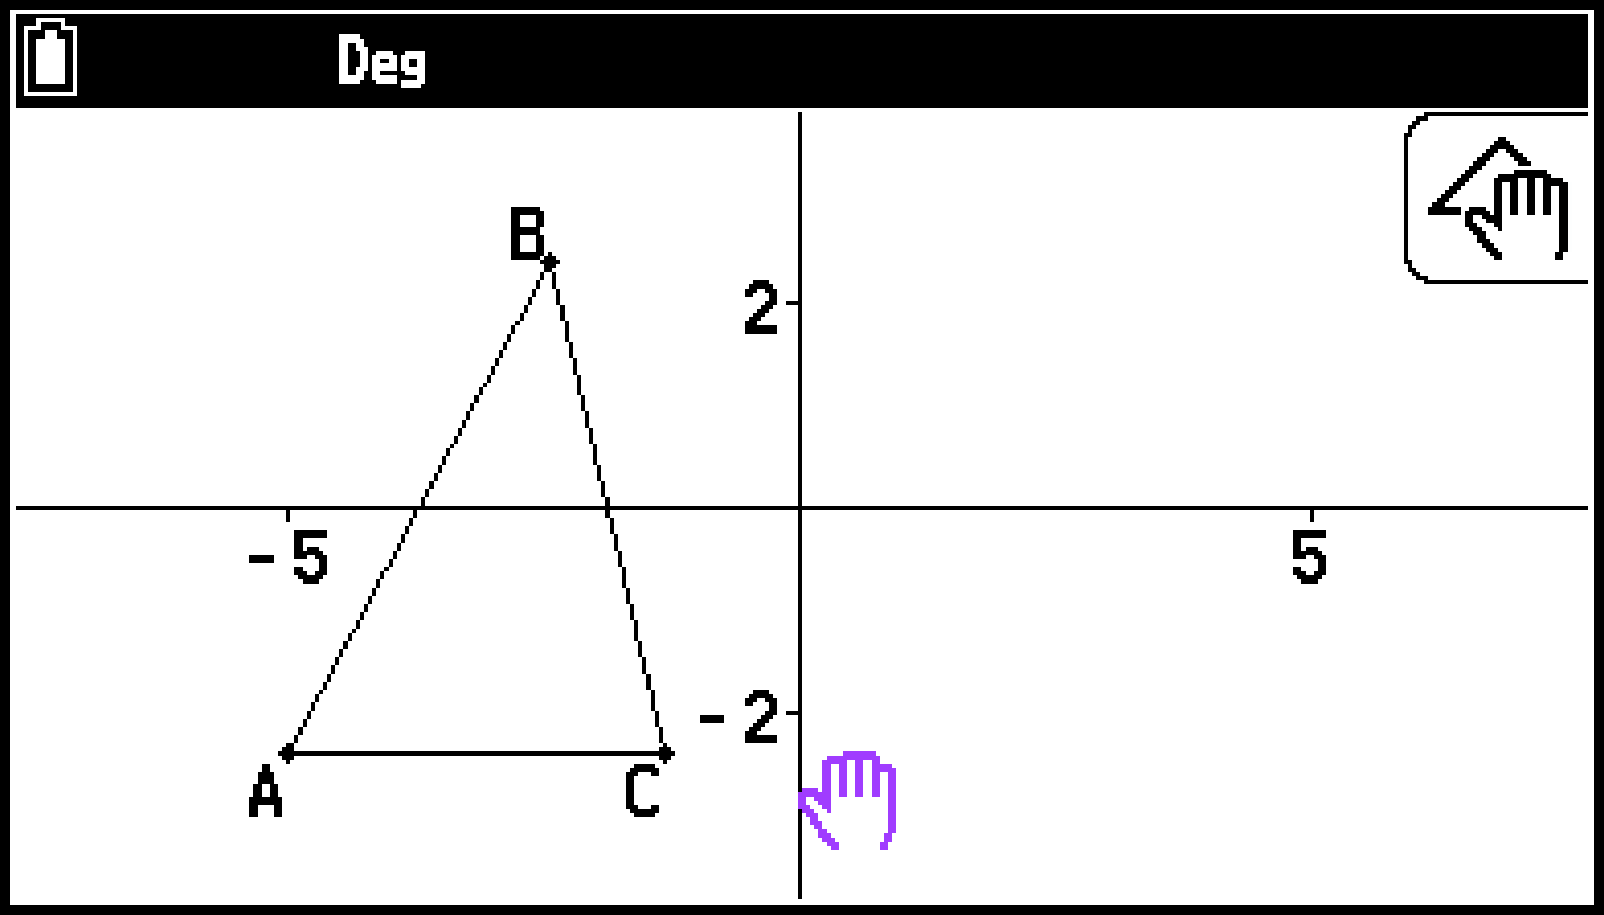
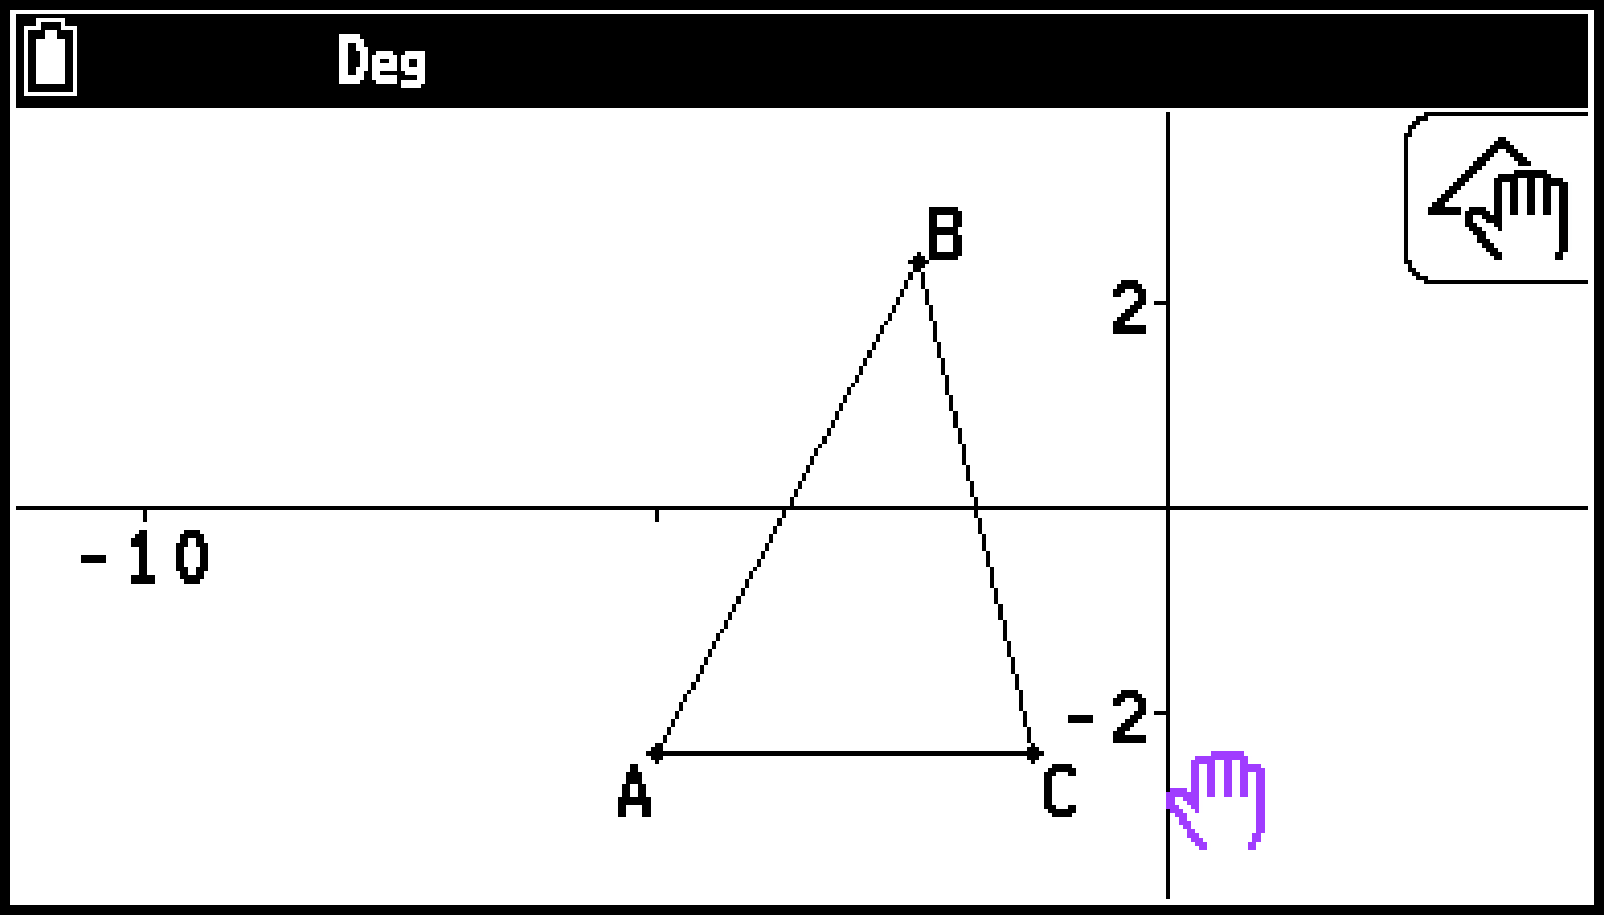
View Window settings are reconfigured automatically so the size of the object on the display may not appear to change very much. The following example shows what happens when the length of the base of a triangle drawn with the initial default View Window settings (with a screen width of 10) is changed to 50.
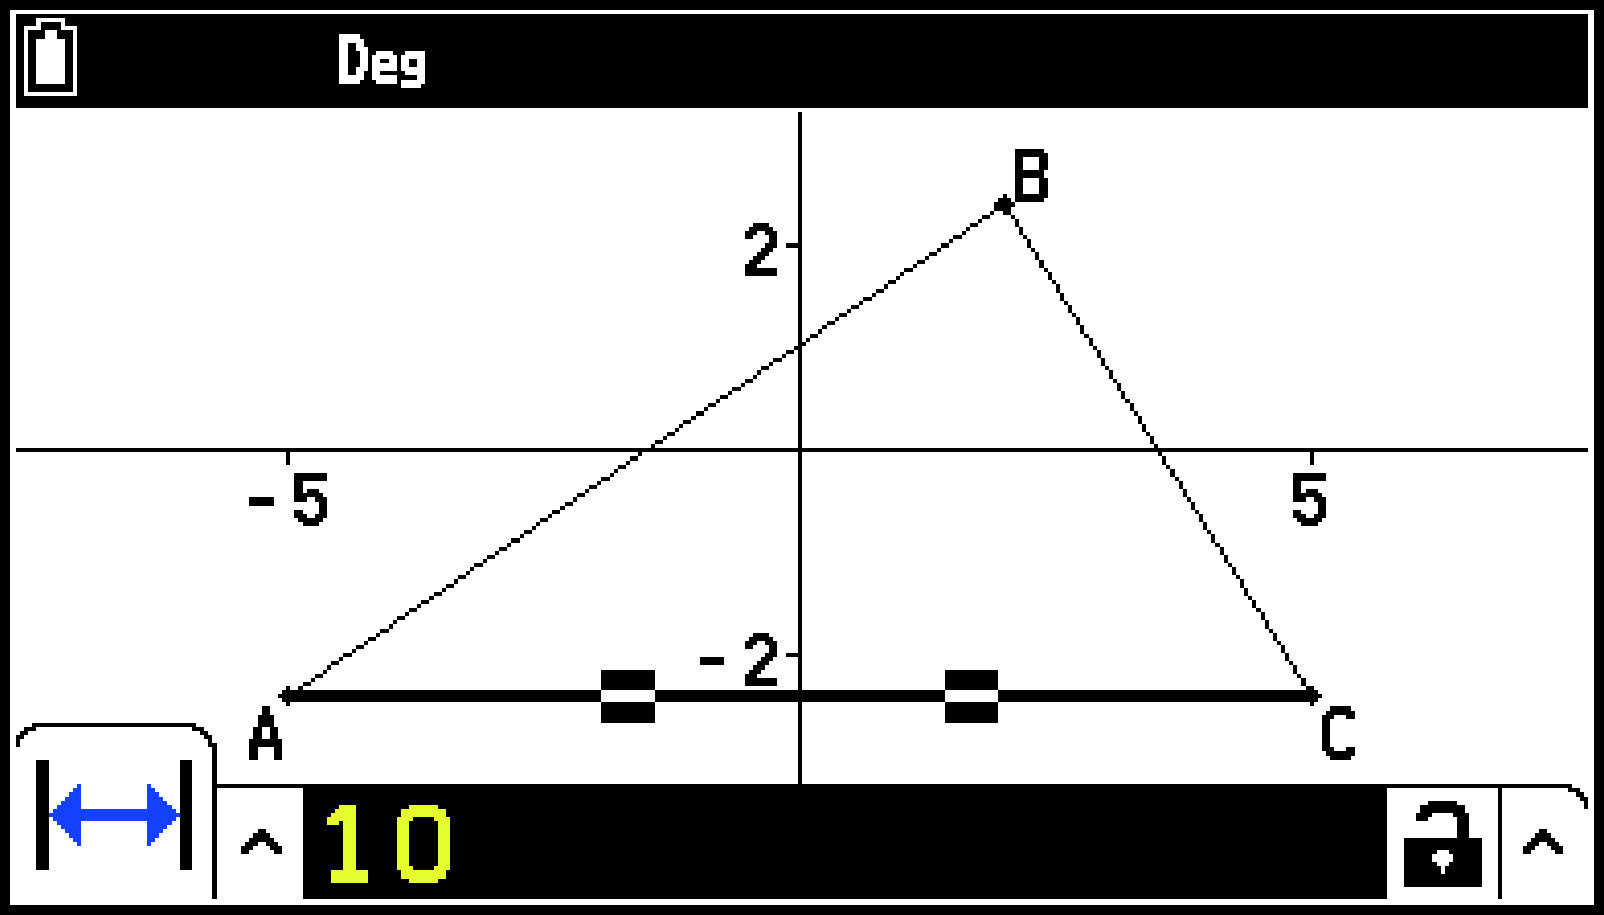
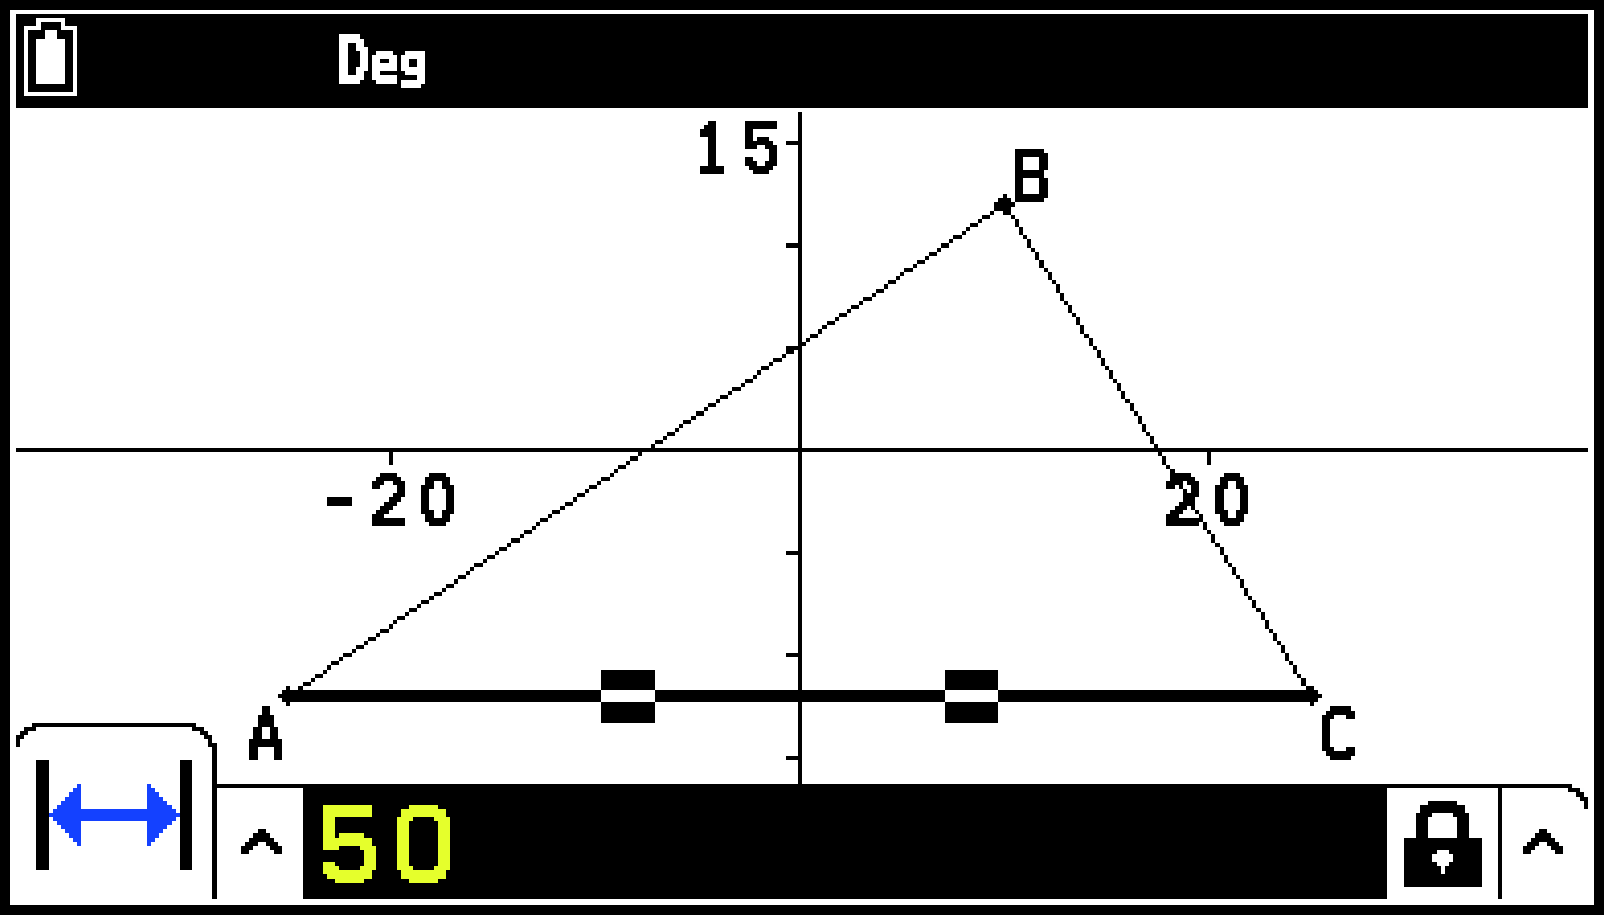
View Window settings are reconfigured in order to ensure that specifying a measurement of an object does not make it too big to fit on the screen or too small to see.
Note that all other objects currently on the screen also are resized by the same amount as the object whose measurement you are specifying.
Once you specify one measurement of an object, it is not resized further if you specify another of its measurements.
Locking or Unlocking a Measurement of an Object
As described in Specifying and Locking a Measurement of an Object, a measurement is automatically locked as soon as it is specified numerically. This section describes how to lock or unlock a measurement without specifying a numeric value.
Note
Only some measurements of an object can be locked. For information about which measurements can be locked, see the Measurement Icon Table.
To lock a particular measurement
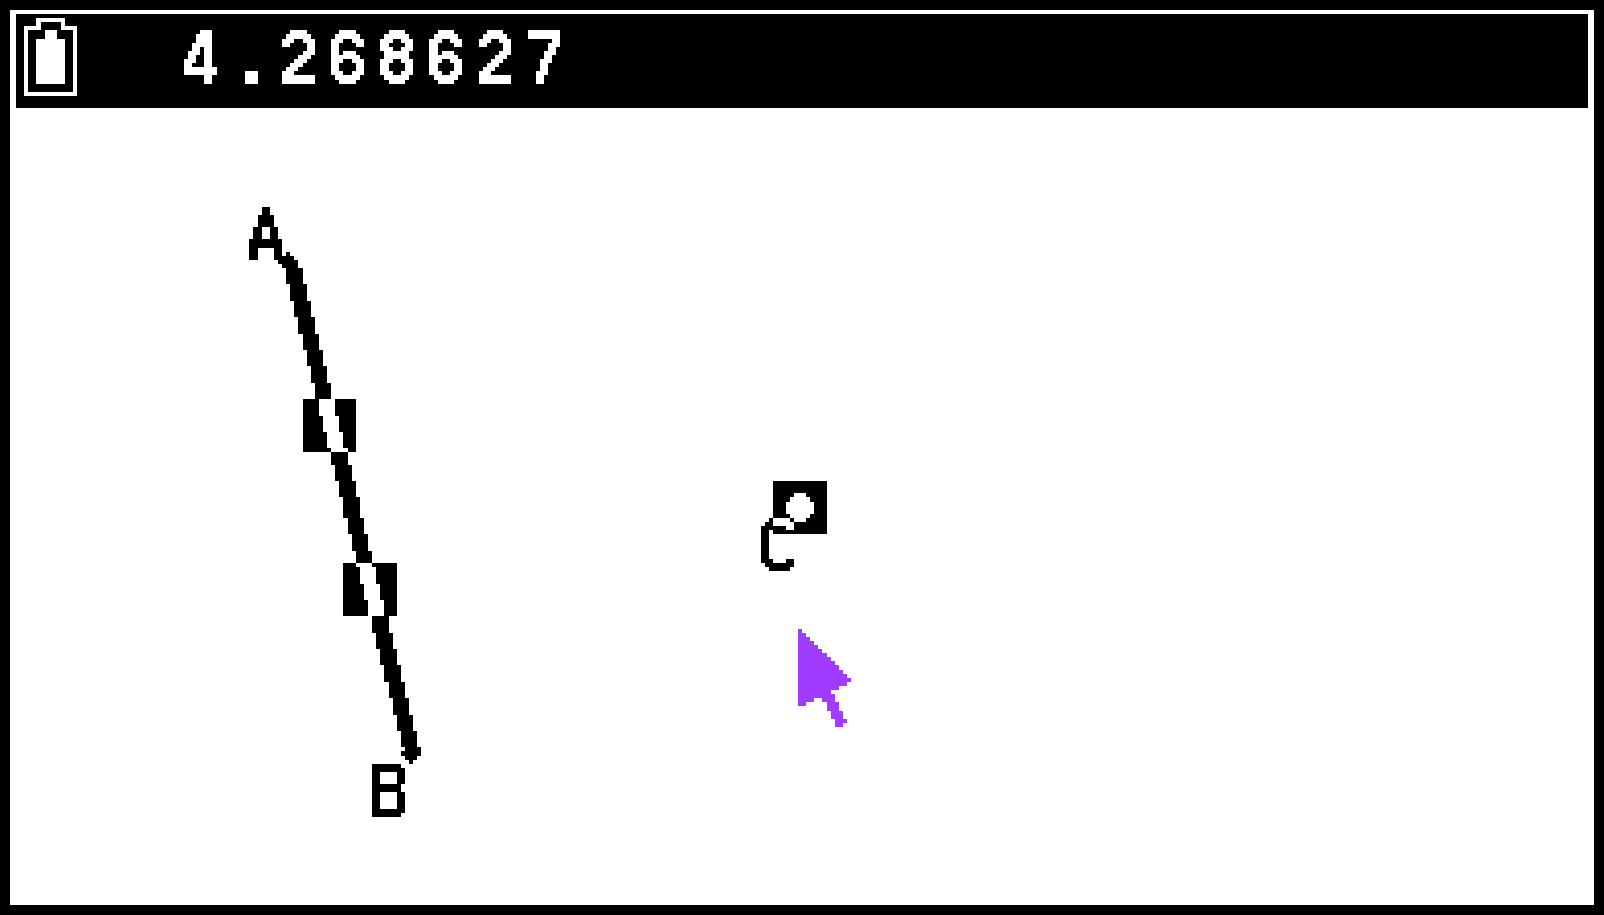
Example 1: To lock the length or slope of a line segment
-
Draw a line segment and select it.
-
Press V to display the measurement box.
-
Press l to highlight the up arrow button to the left of the measurement box and then press O.
-
On the icon palette that appears, highlight the icon (
 or
or  ) of the measurement you want to lock and then press O.
 -
Use r to highlight the
 icon and press O.*
The icon changes to ![]() , indicating that the measurement is locked.
, indicating that the measurement is locked.
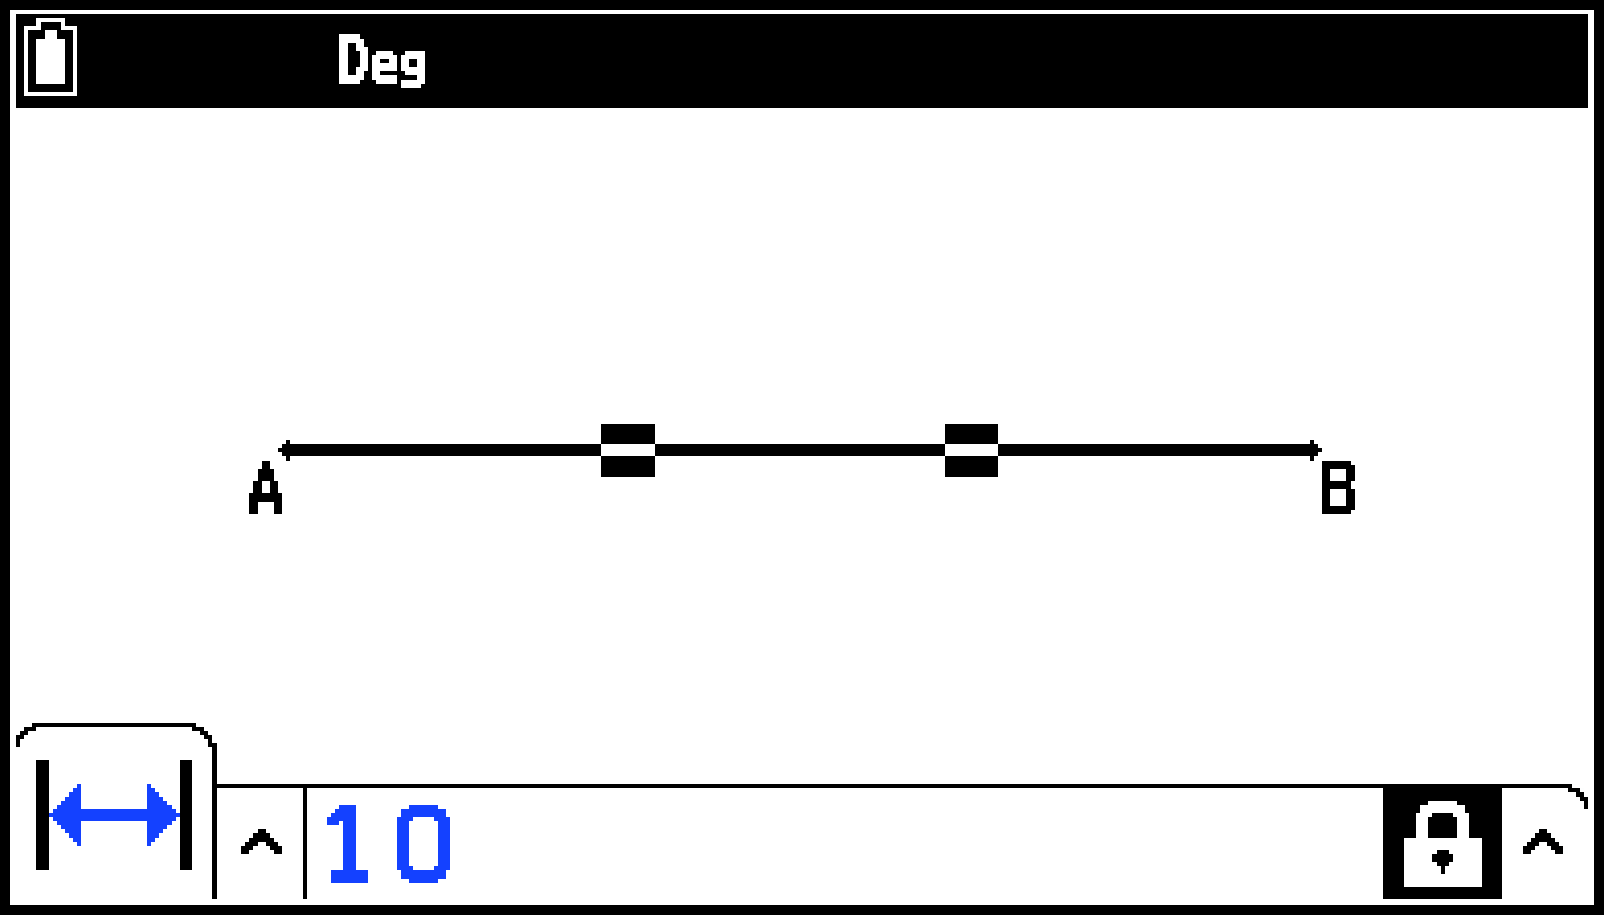
Length locked
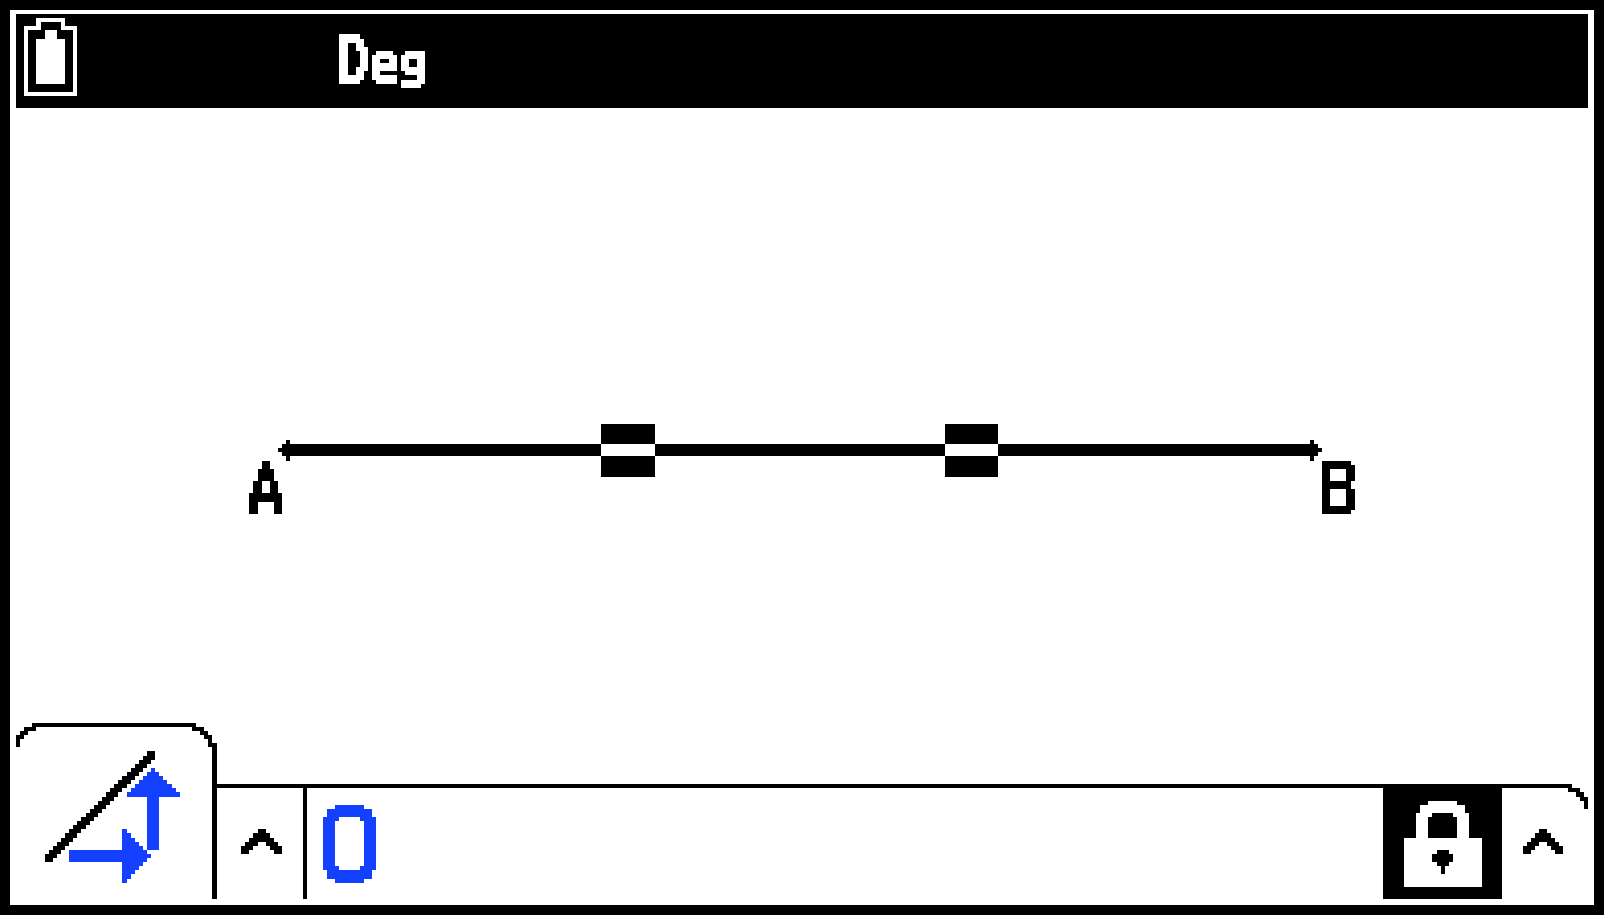
Slope locked
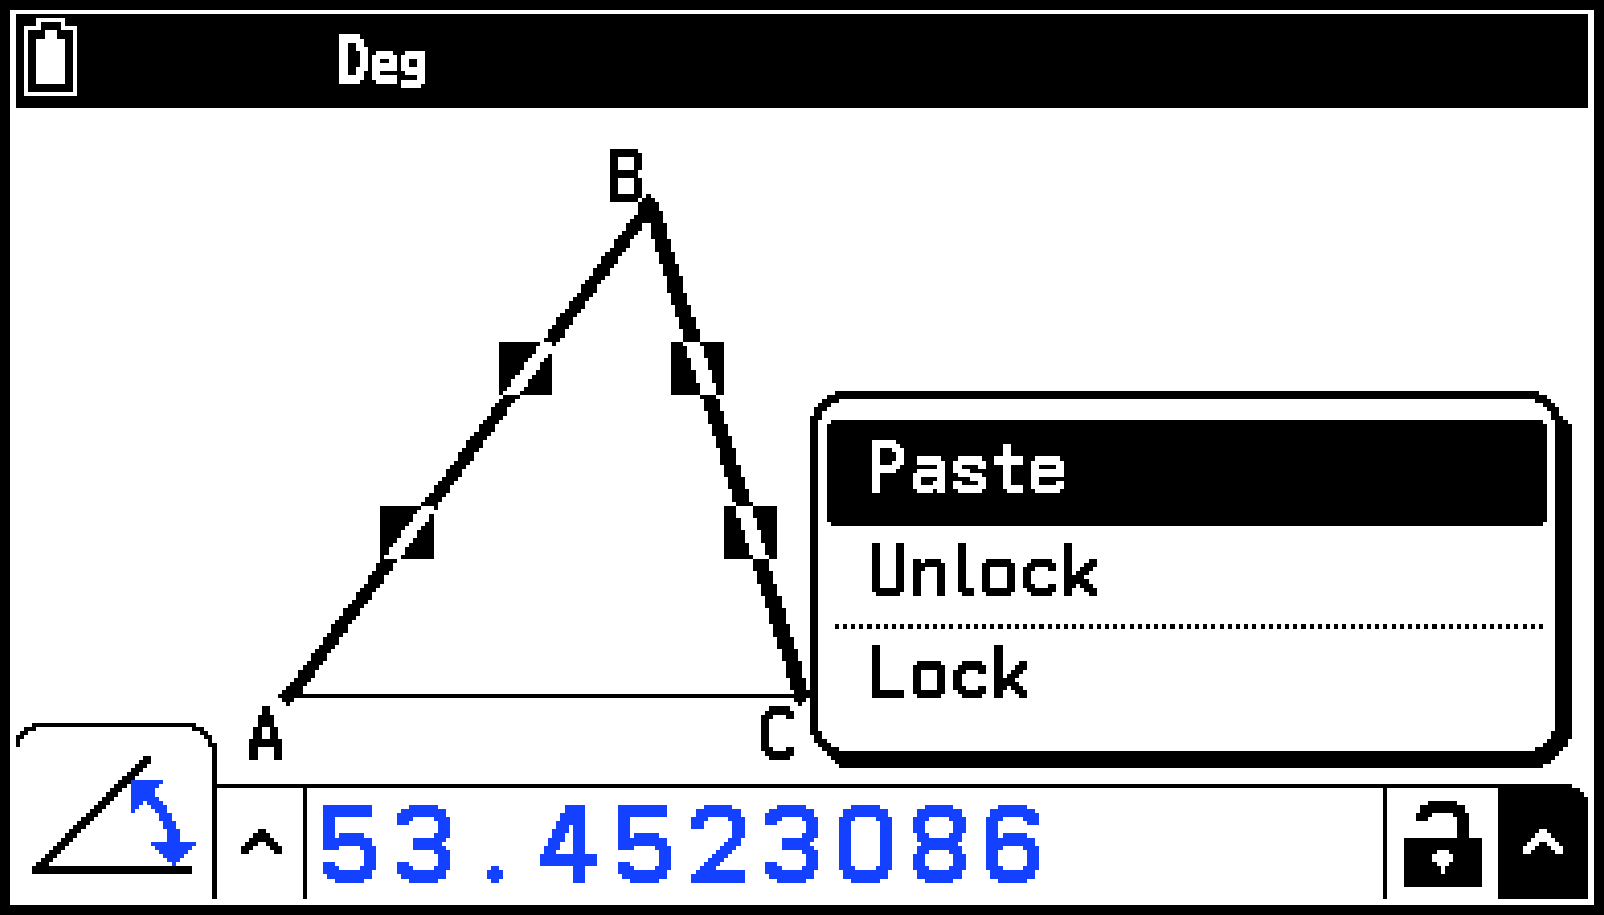
You can also perform the steps below in place of step 5.
-
Highlight the up arrow button to the right of the
icon and press O. -
On the menu that appears, select [Lock] and then press O.
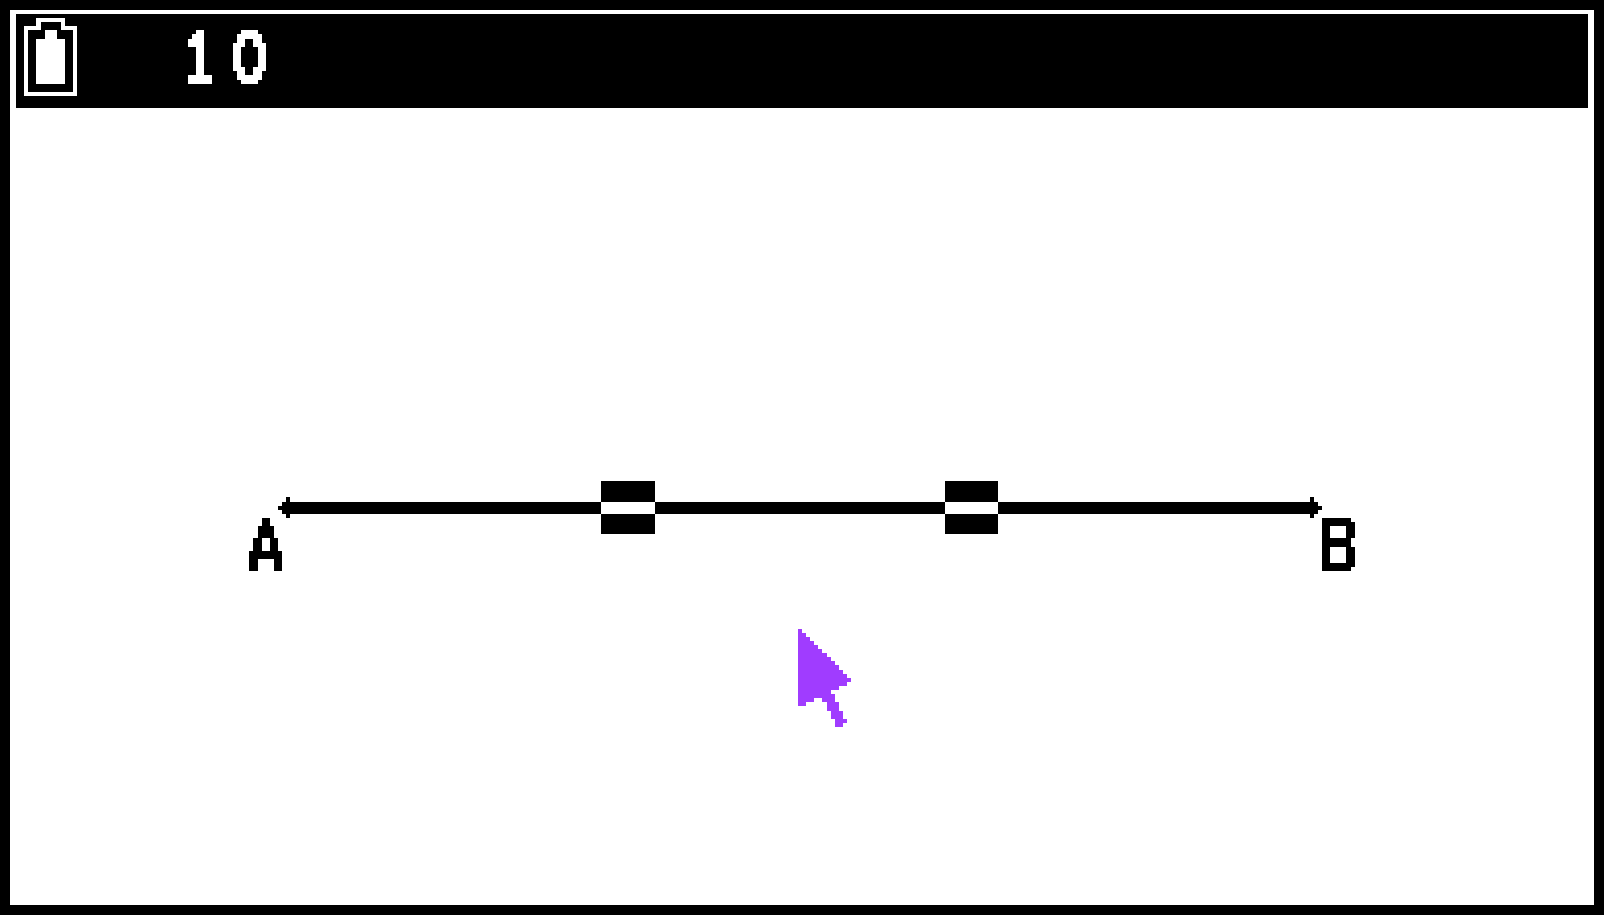
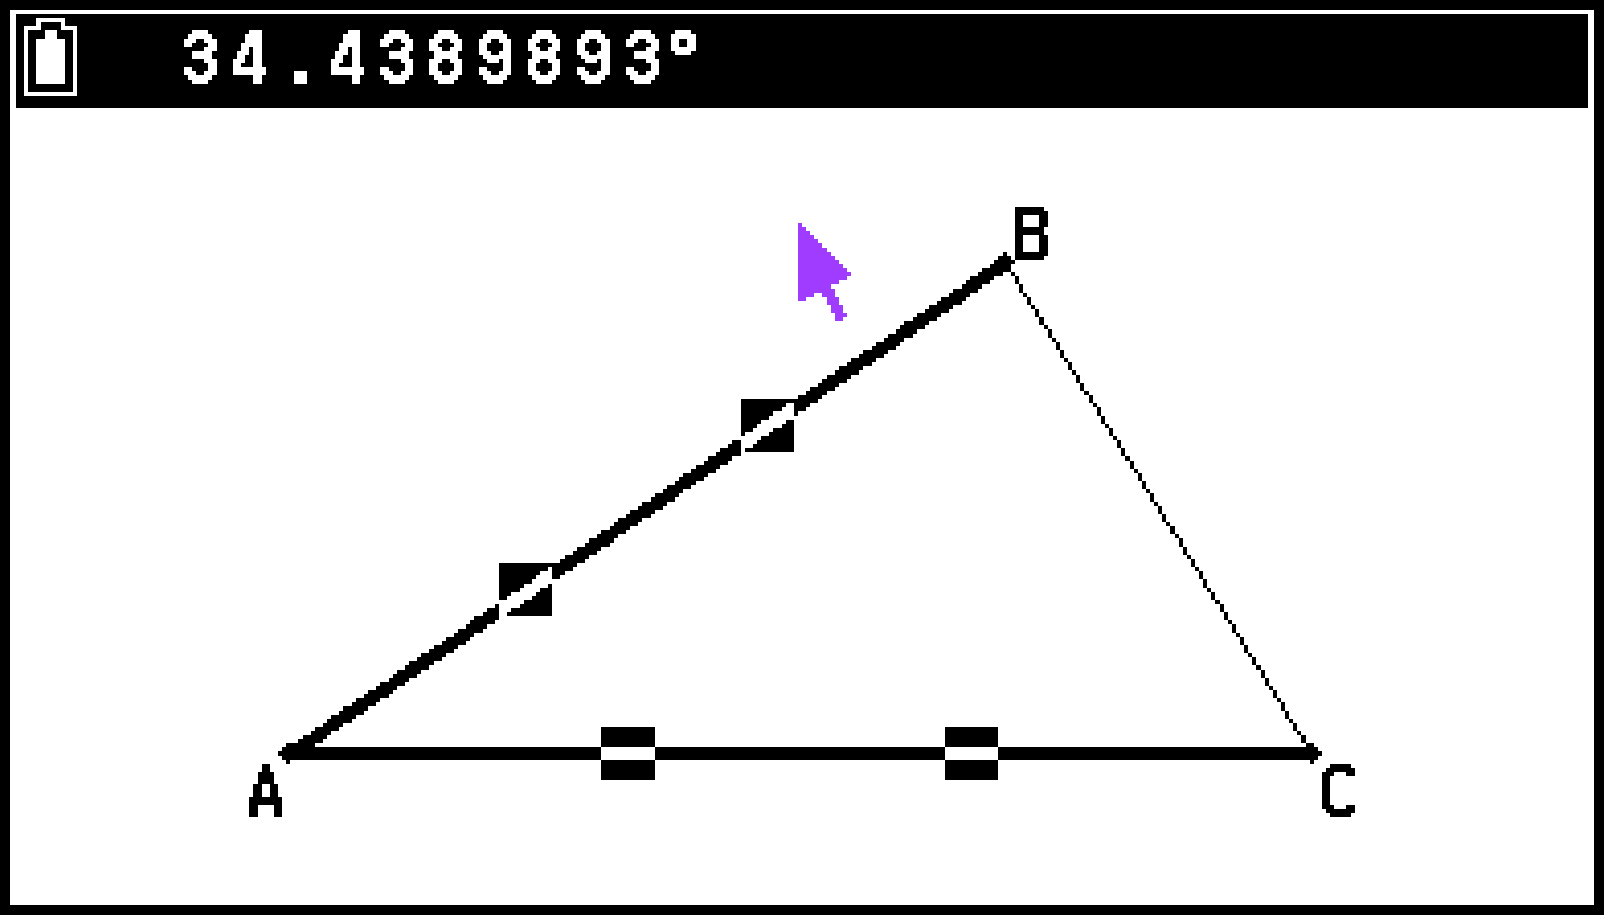
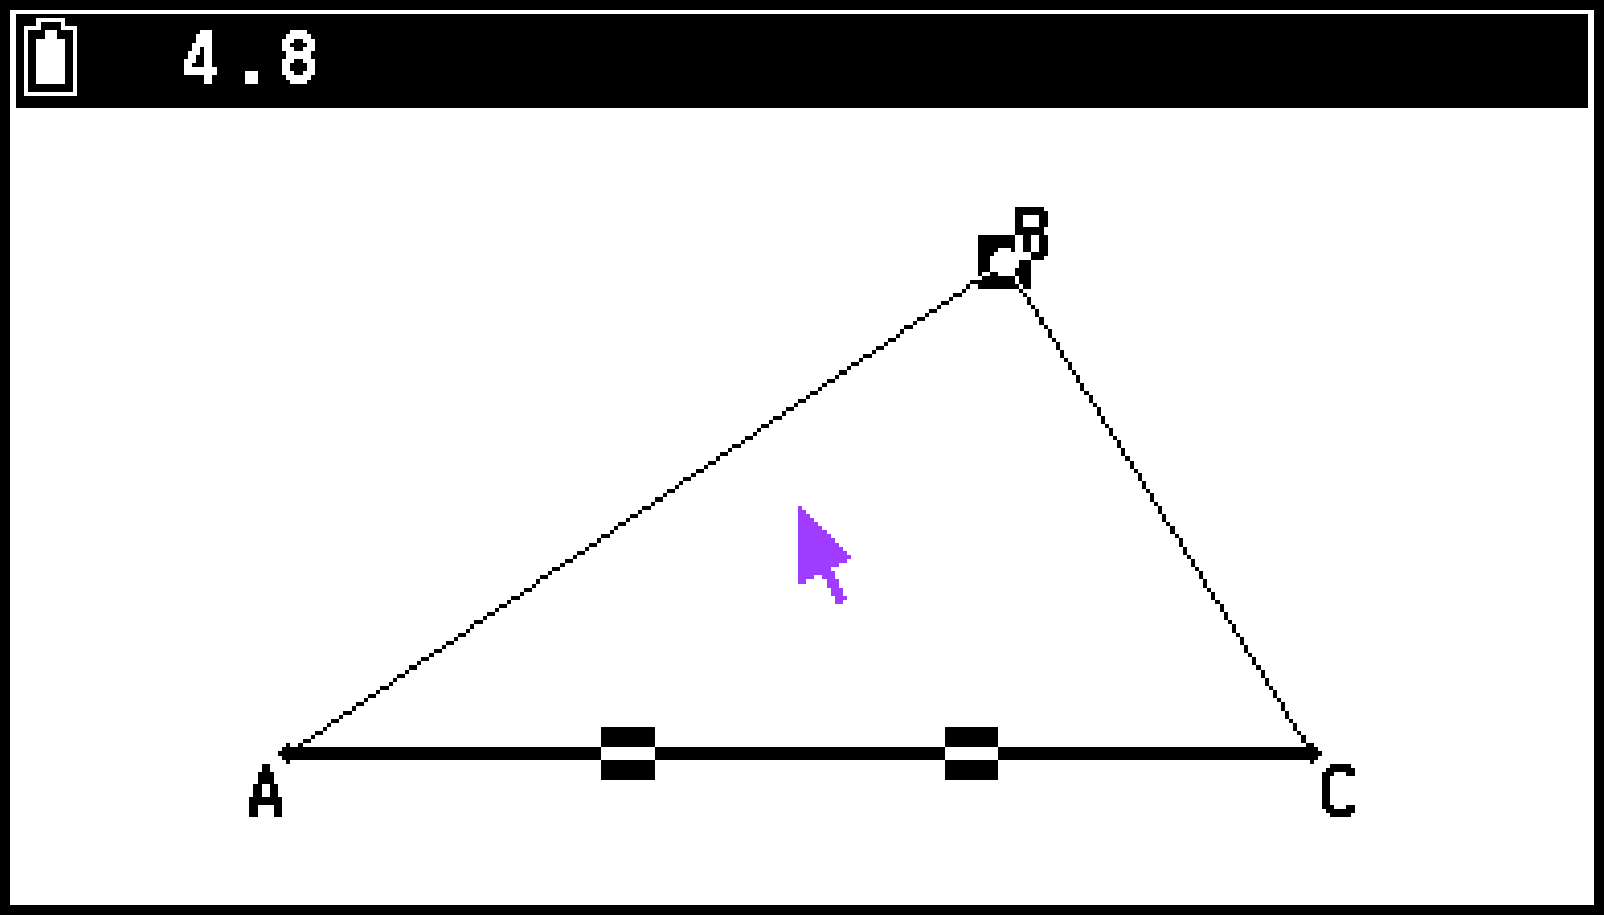
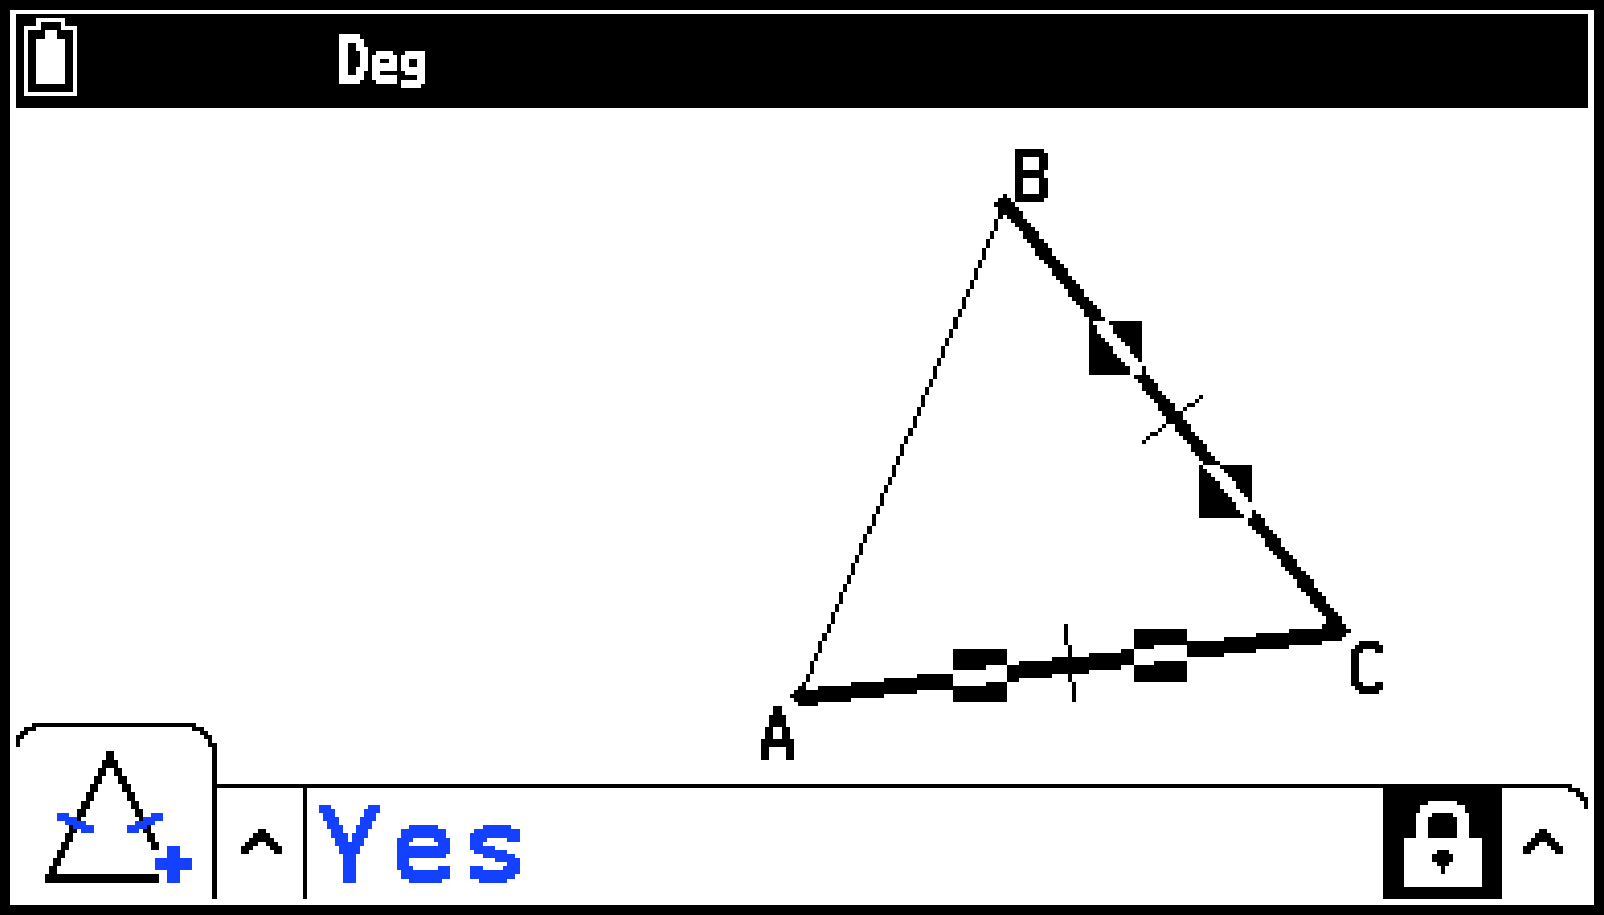
Example 2: To lock two sides of a triangle to equal lengths
-
Draw a triangle, and then select its side AC and side BC.
-
Press V to display the measurement box.
-
Press l to highlight the up arrow button to the left of the measurement box and then press O.
-
On the icon palette that appears, highlight the
 icon and then press O.
 -
Use r to highlight the
icon and press O.
This causes “No” to appear in the measurement box.
This causes the icon to change to ![]() , indicating that the measurement is locked. Also, the measurement box contents change to “Yes”.
, indicating that the measurement is locked. Also, the measurement box contents change to “Yes”.
To unlock a particular measurement
You can unlock a particular measurement by performing any one of the following operations.
If the icon to the right of the measurement box is ![]() , use l and r to highlight the icon and press O. This causes the icon to change to
, use l and r to highlight the icon and press O. This causes the icon to change to ![]() , indicating that the measurement is unlocked.
, indicating that the measurement is unlocked.
Use l and r to highlight the up arrow button to the right of the ![]() icon and press O. On the menu that appears, select [Unlock] and then press O.
icon and press O. On the menu that appears, select [Unlock] and then press O.
To unlock all objects on the screen
Select T > [Option] > [Clear Constraint]. This unlocks all locked settings.
Note
The above operation unlocks both measurements you locked manually, as well as objects that are locked automatically whenever they are drawn.
For example, the above operation unlocks the lock condition below:
The lock that is applied when you draw an isosceles triangle (ABC) that keeps side AB and side BC equal (side AB and side BC congruence lock)
Pasting Measurements into a Screen Image
You can use the procedures below to paste object measurements into the image on the screen. The measurements change dynamically as you manipulate the object.
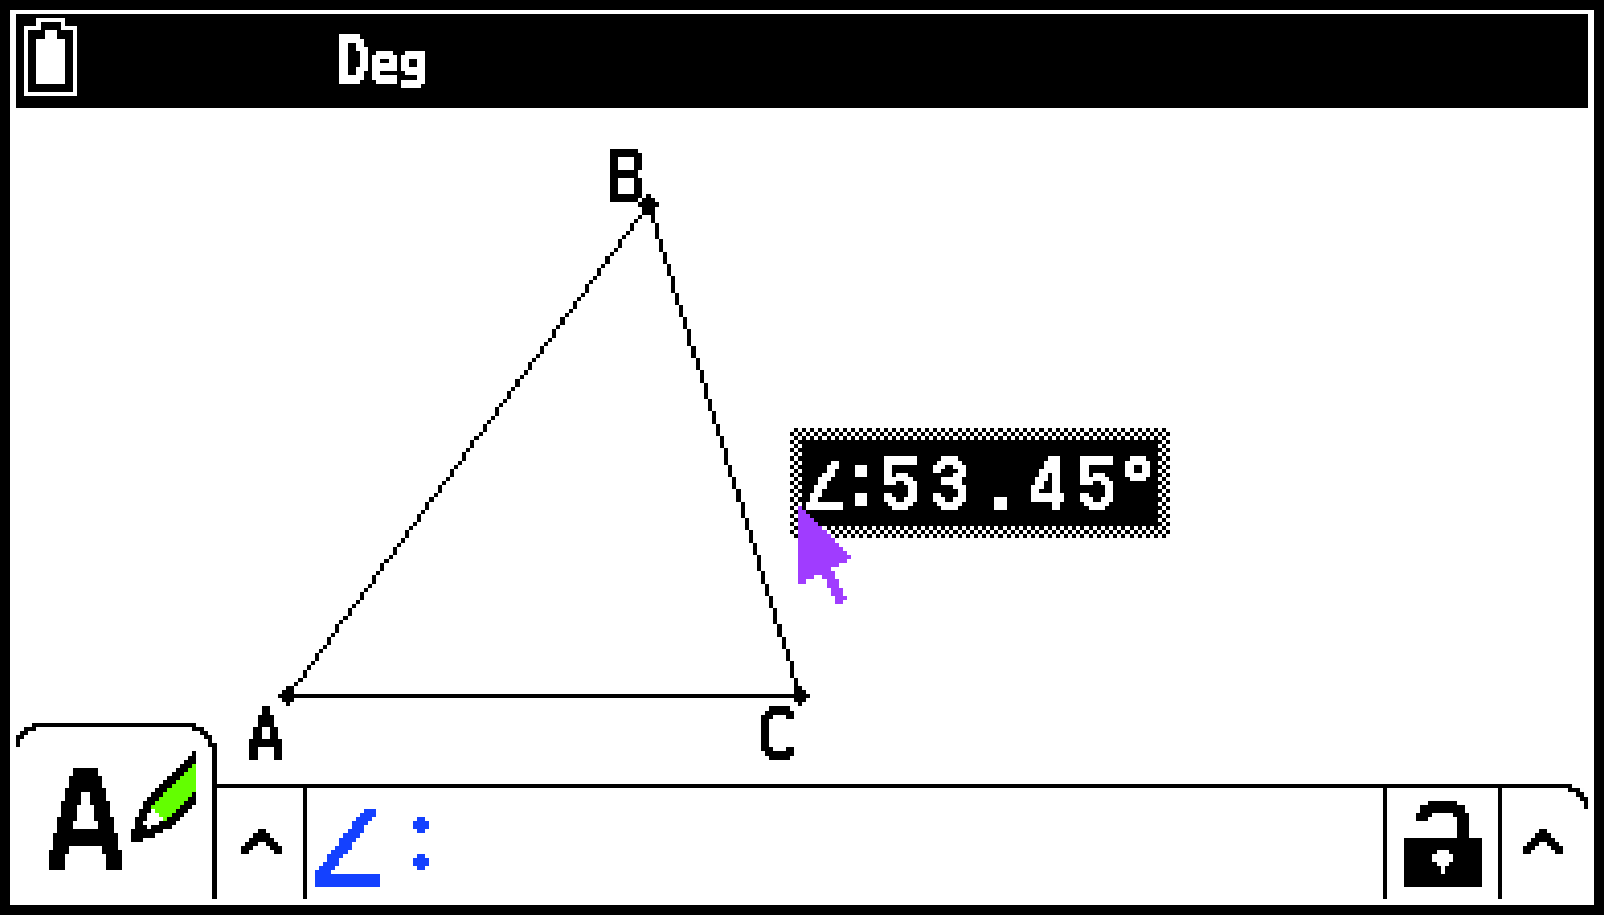
Example: To paste an internal angle measurement into a screen image
-
Draw a triangle and select two of its sides.
-
Press V to display the measurement box.
-
Use r to highlight the up arrow button on the right side of the measurement box and then press O.
-
On the menu that appears, select [Paste].
-
Move the text to another location on the screen, if you want.
This causes the measurement in the measurement box to be pasted into the screen image. At this time, the pasted measurement text is selected.
Press X and then use the cursor keys to move the pasted measurement around the screen. For details, see To move an object.
Note
You can also paste the measurement that is currently in the measurement box into the screen image by pressing s.(%) while the measurement box is highlighted in step 2 of the above procedure.
The following types of measurements can be pasted into a screen image: coordinates, distance/length, slope, radius, circumference, perimeter, area, angle, supplementary angle, equation, vector components.
The pasted measurement is prefixed with a name (or symbol) depending on its type. In the example above, ∠: is appended to indicate an angle. “Area:” is appended to indicate an area, and “Eq:” is appended to indicate an equation or vector components. You can use the measurement box to edit an appended name (or symbol). See Changing a Label or Adding a Name to an Object for information about editing operations.
Changing a Label or Adding a Name to an Object
You can change the label name of a point, vector, or pasted measurement, or add a name to each element as explained in the following example.
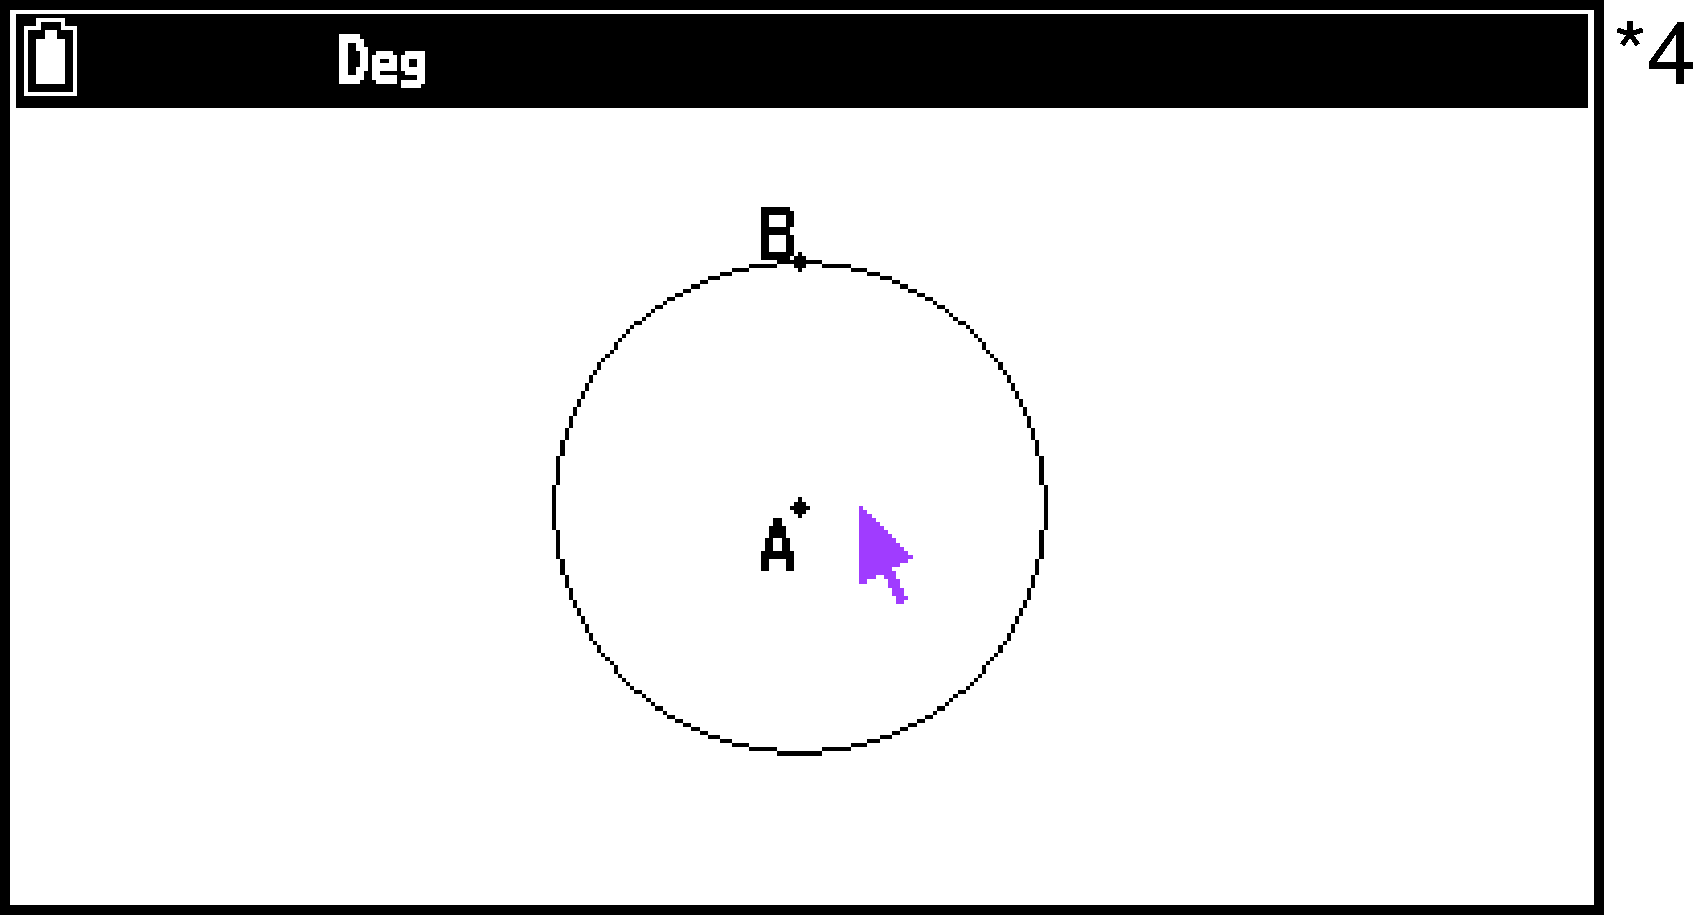
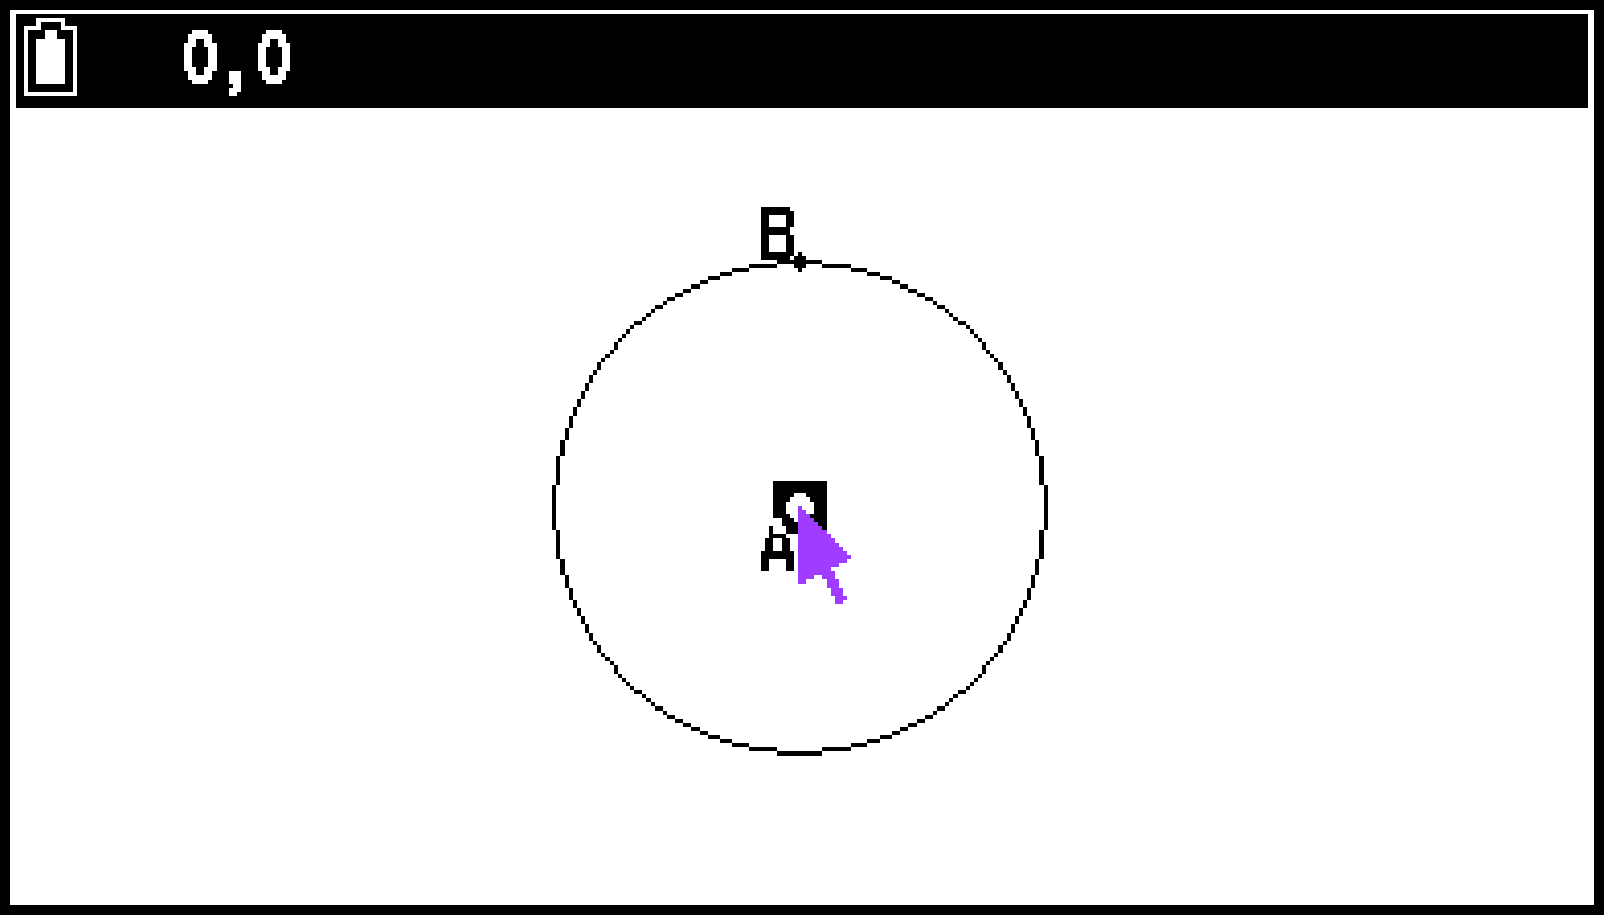
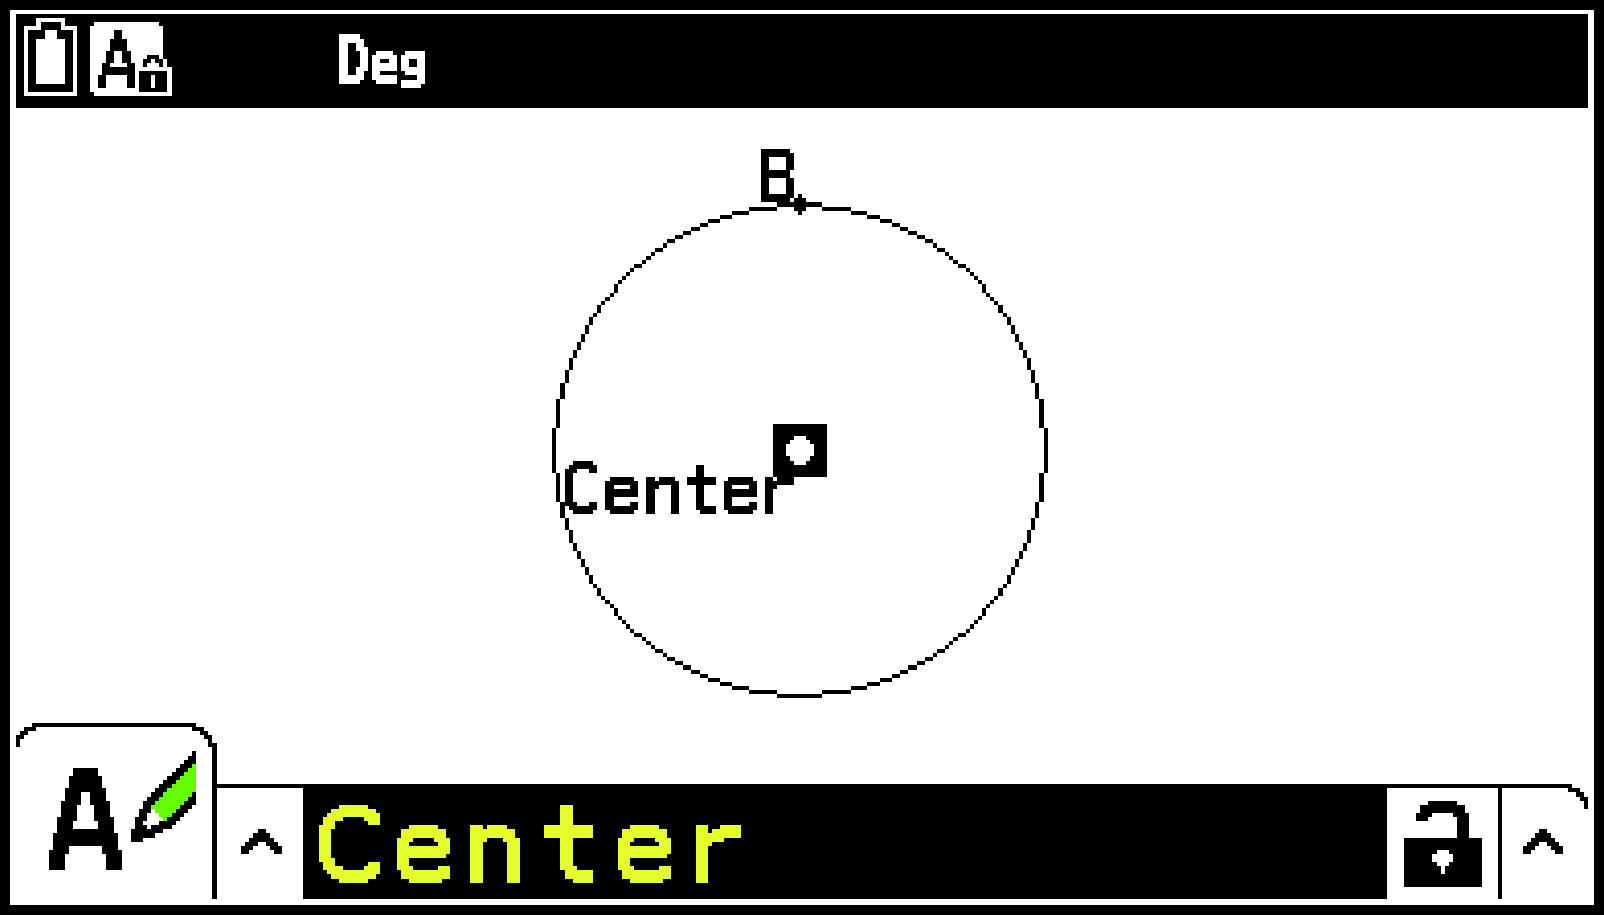
Example: To change the label name of the center of a circle from “A” to “Center”
-
Draw the circle, and then select its center point.
-
Press V to display the measurement box.
-
Press l to highlight the up arrow button to the left of the measurement box and then press O.
-
On the icon palette that appears, highlight the
 icon and then press O.
 -
Press r to highlight the measurement box and then press O.
-
On the label edit dialog box that appears, input “Center”.
-
Press O.
If this causes the ![]() icon to appear, advance to step 6 of this procedure.
icon to appear, advance to step 6 of this procedure.
You can input up to 14 characters for the label name.
To delete the label name, press a.
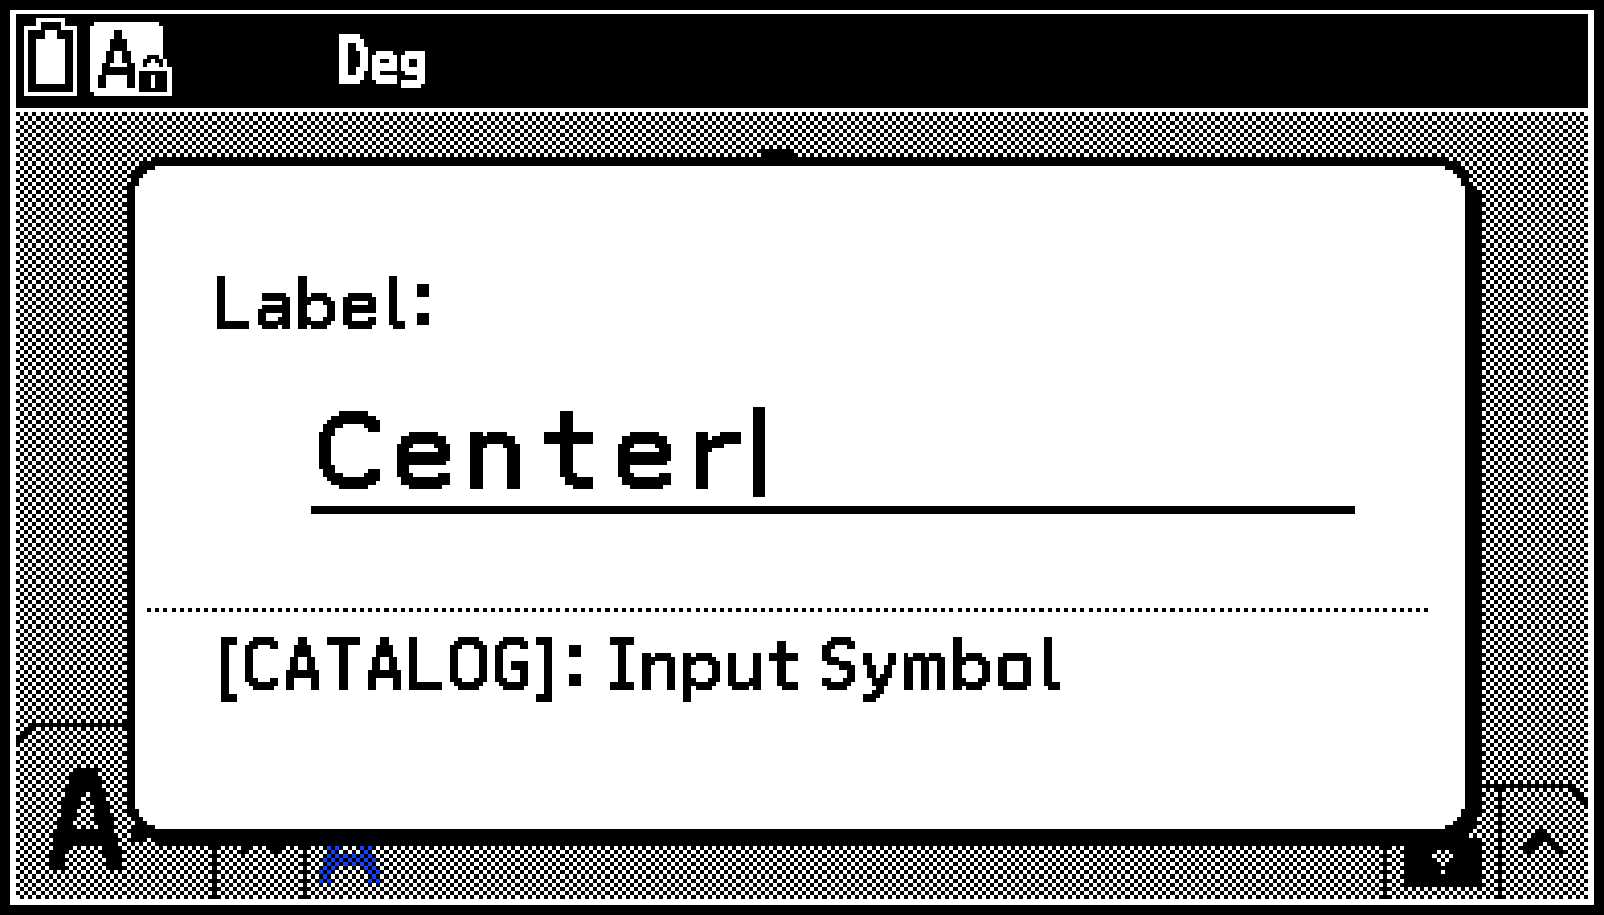
This displays the changed name on the screen as shown here.
Displaying the Result of a Calculation that Uses On-screen Measurement Values
You can use the procedure in this section to perform calculations using the angle value, line length, and other measurement values attached to an object, and display the result on the screen.
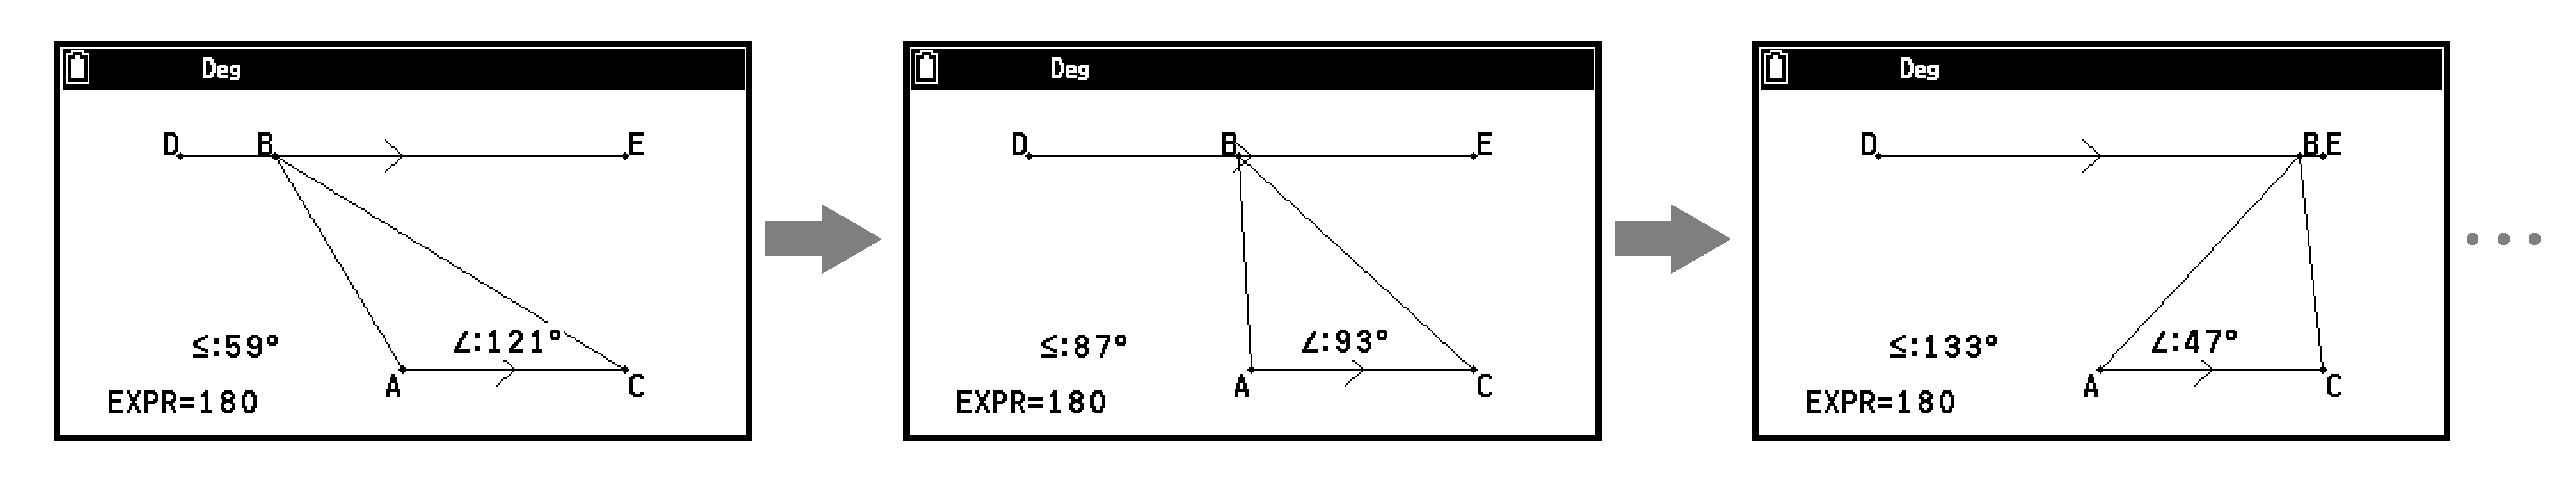
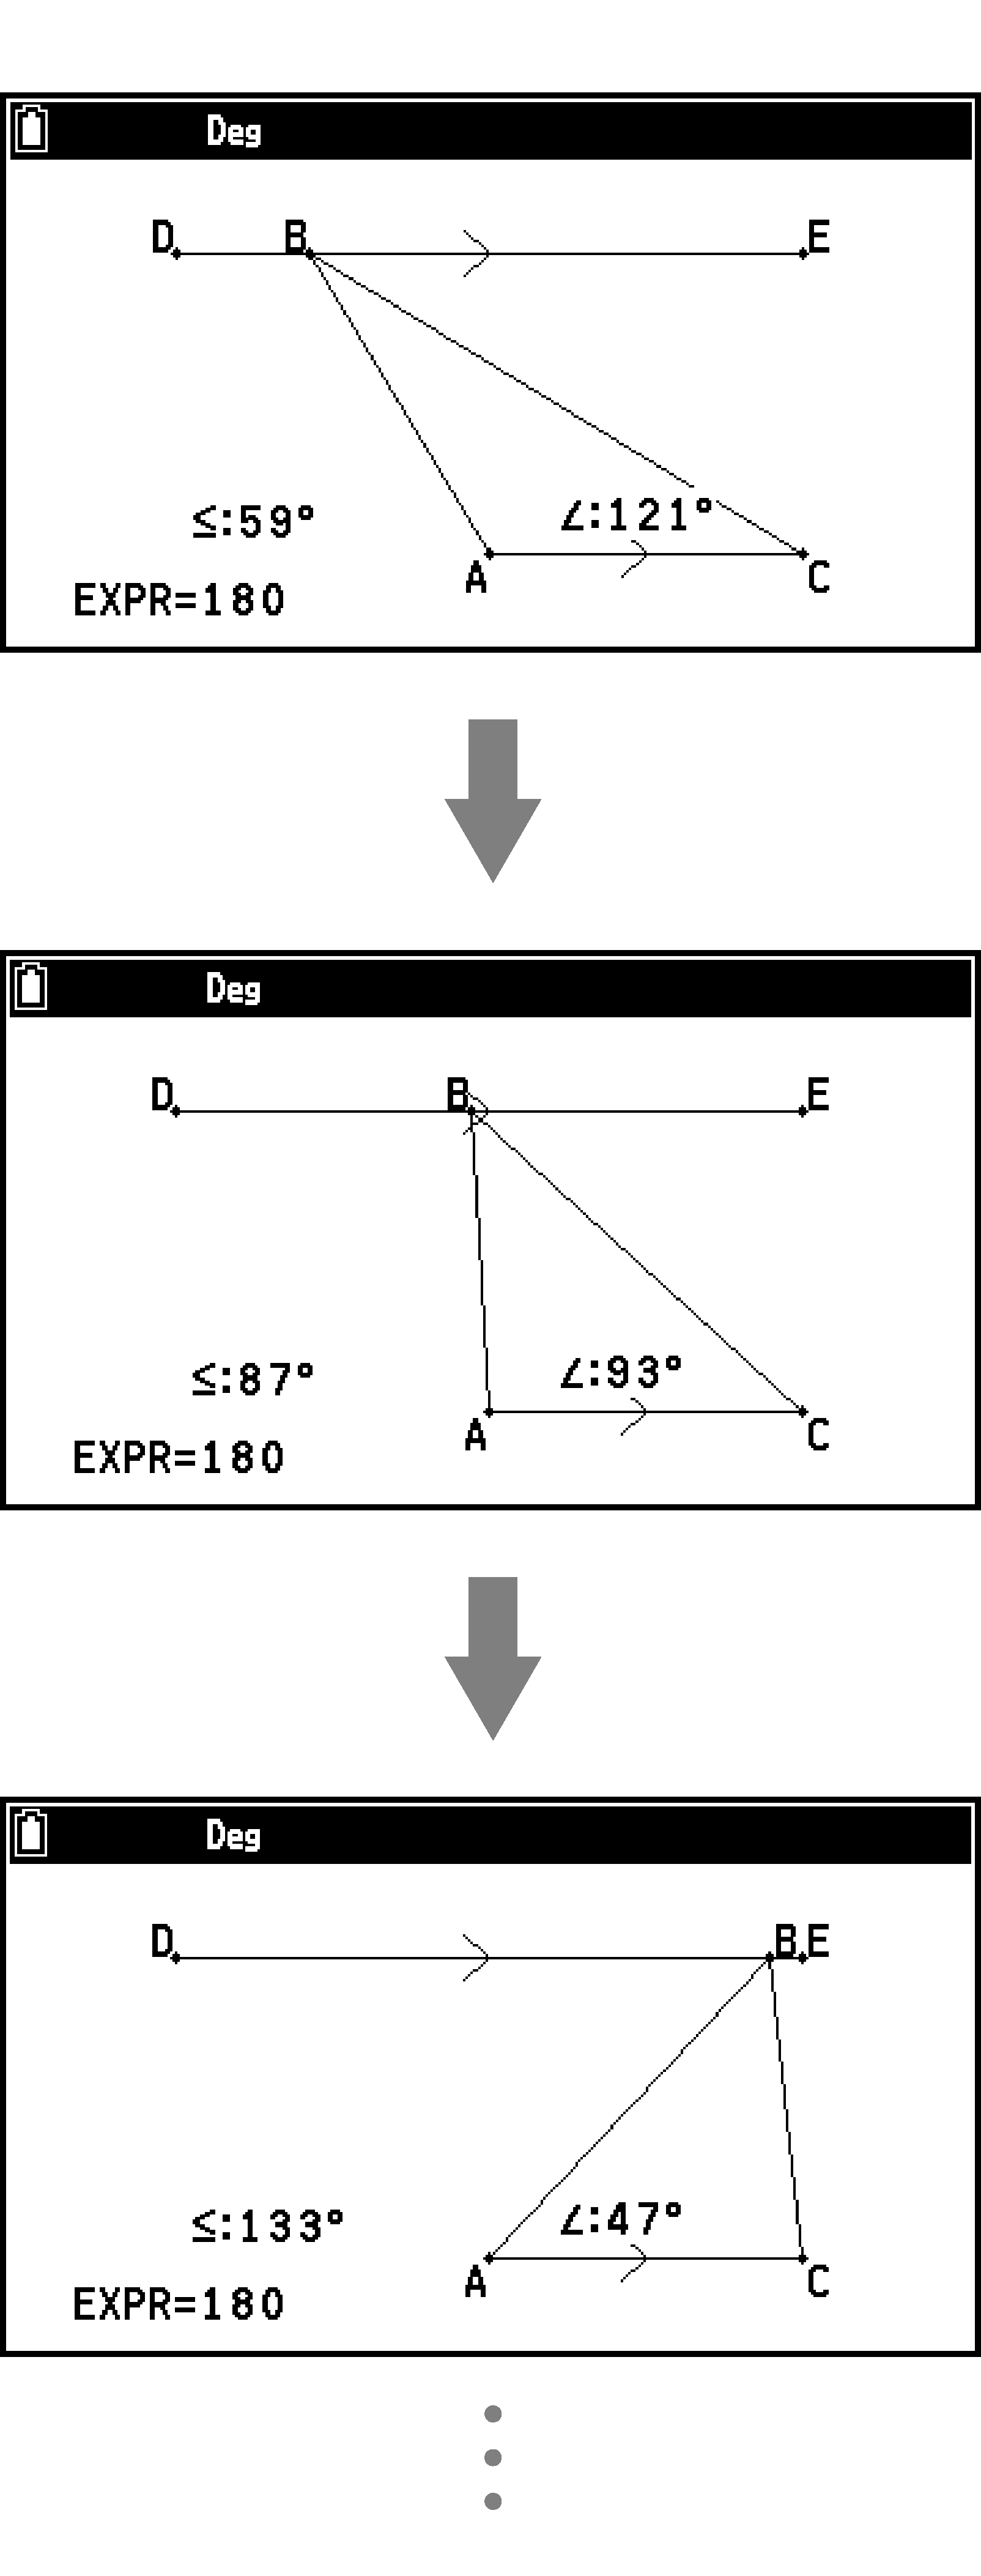
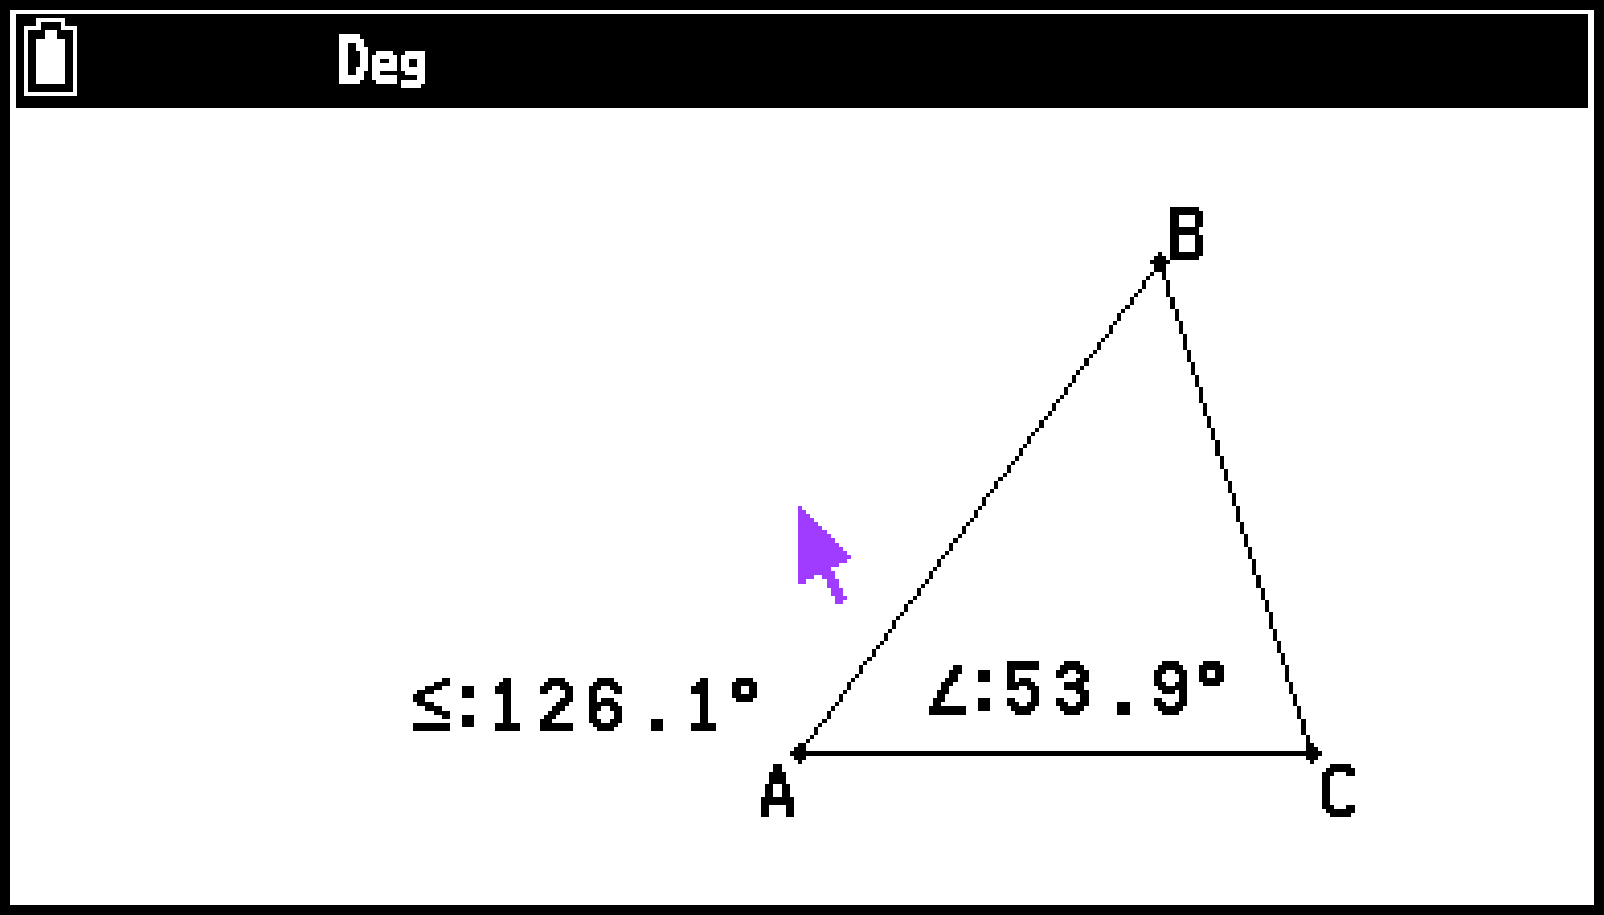
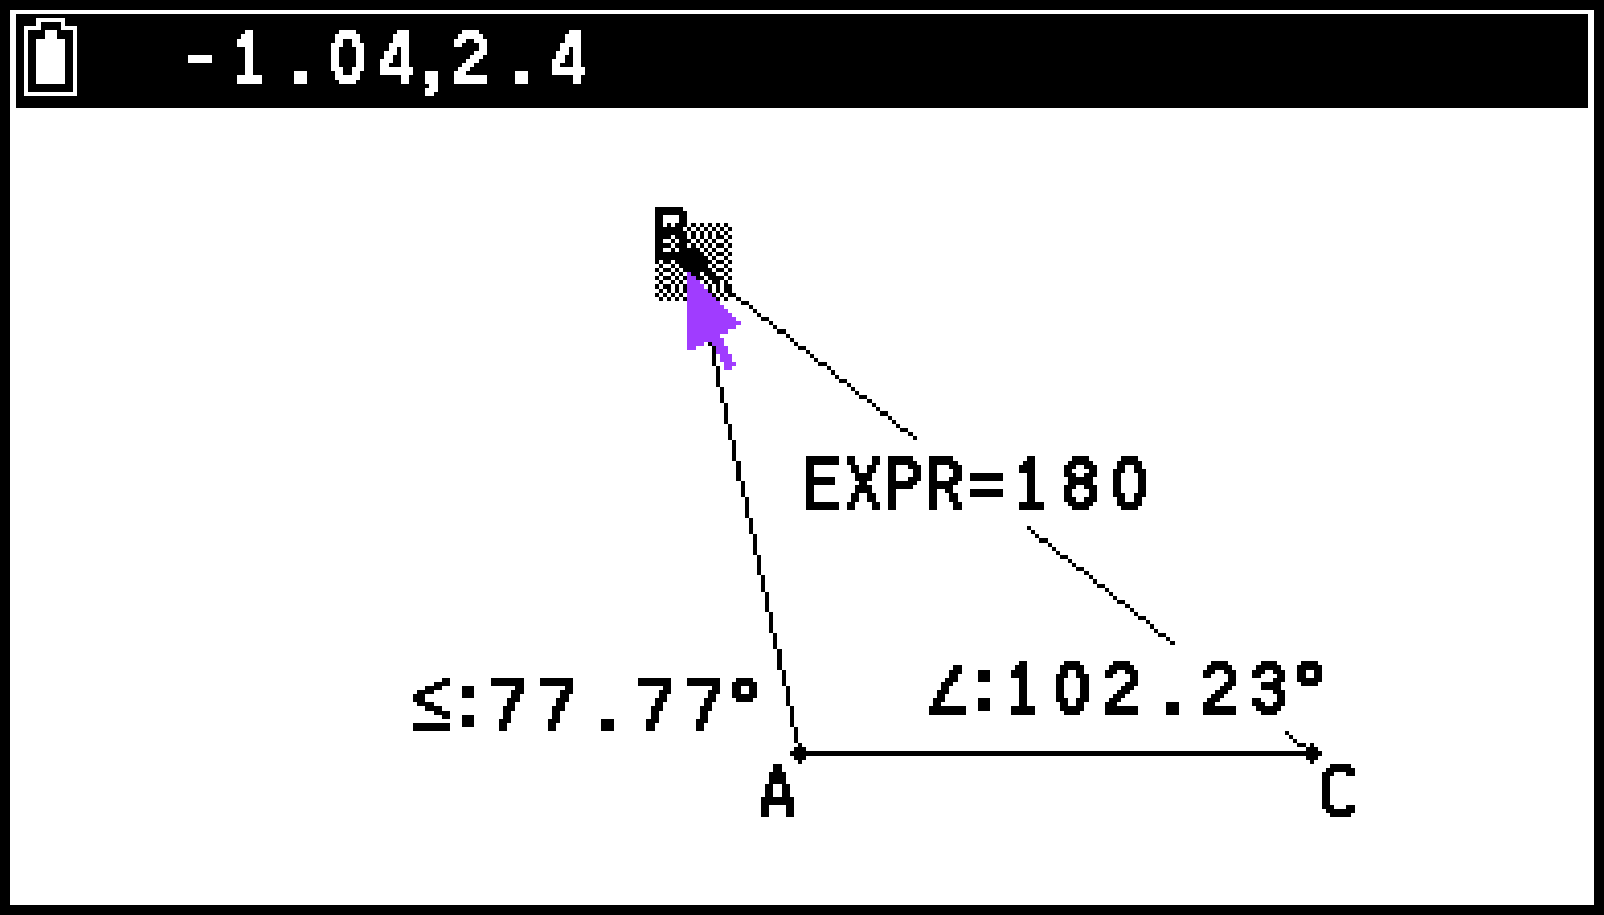
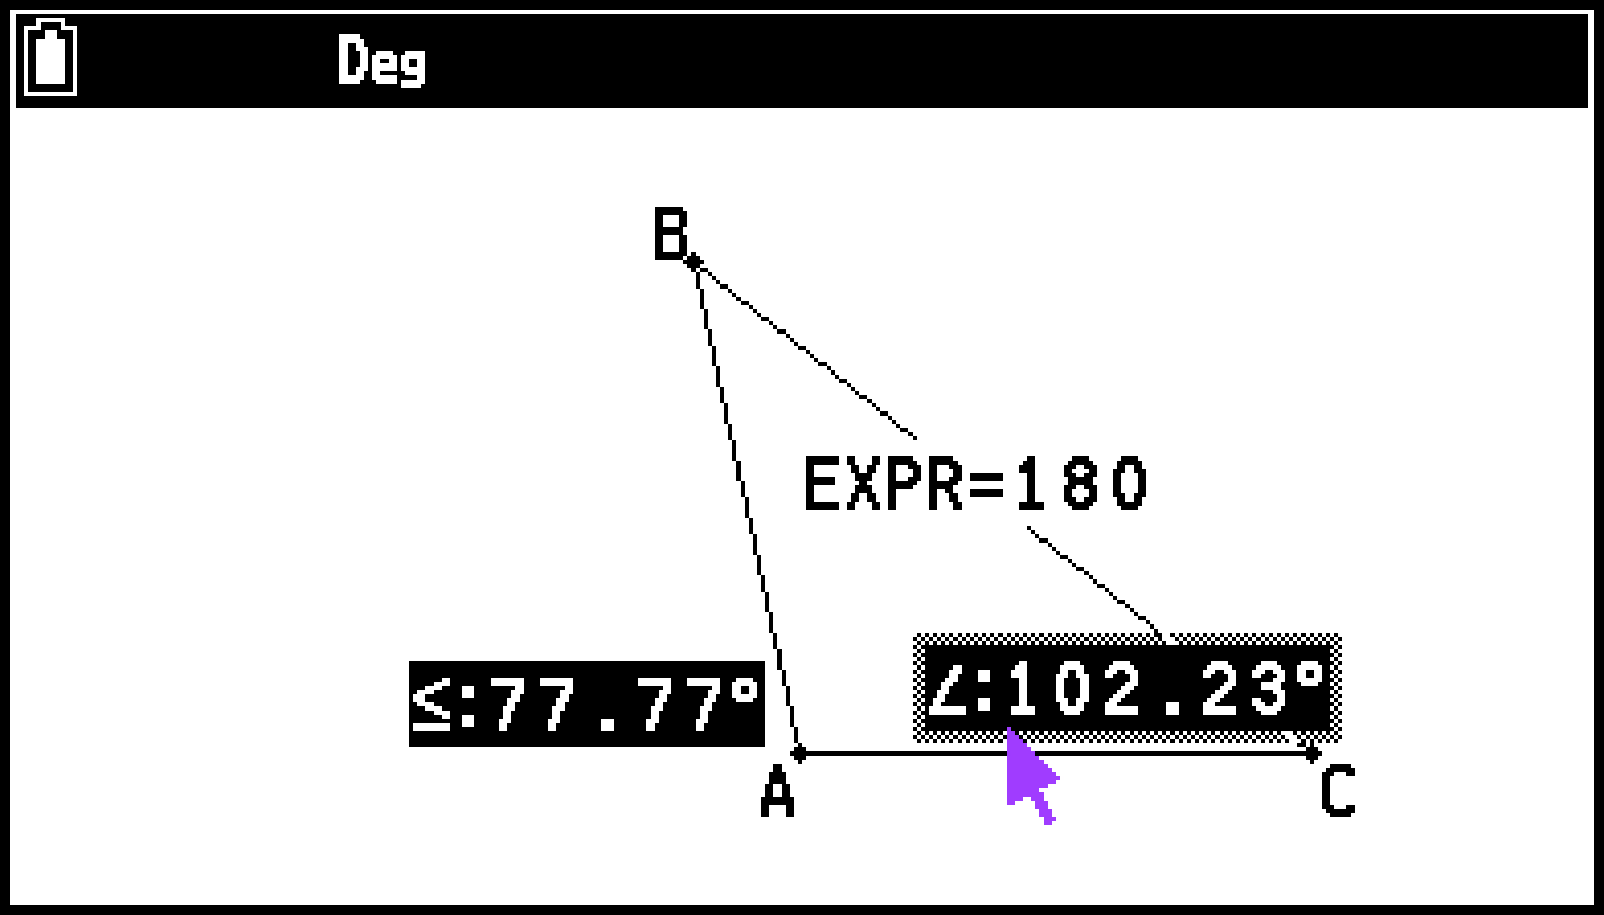
Example 1: To input the expression that determines the sum of one angle of a triangle and its supplementary angle and paste the result on the screen.
-
Draw a triangle and paste the measurements of the ∠BAC angle and supplementary angle on the screen.
-
Select T > [Option] > [Expression].
-
Now you can use the labels to specify measurement values in the calculation you input in the measurement box.
-
After inputting the calculation expression, press O.
-
Press b twice to hide the measurement box.
-
Try moving the vertex B to somewhere else on the screen.
For information about pasting measurements on the screen, see Pasting Measurements into a Screen Image.
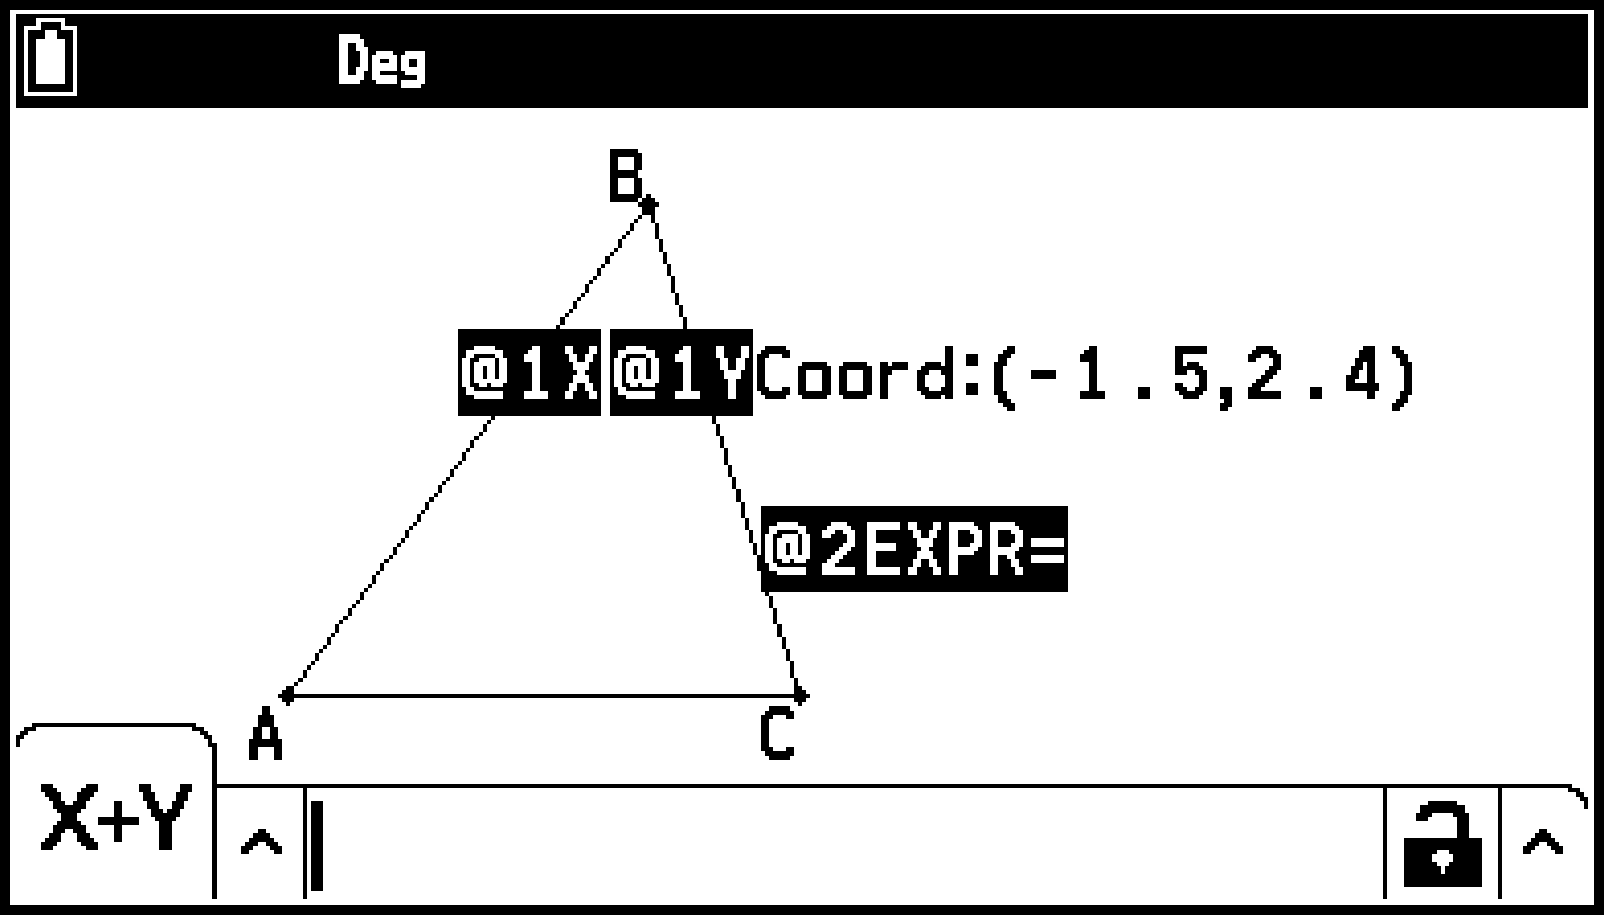
This displays “EXPR=” at the pointer location and displays the measurement box.
The above also displays labels (@n, where n is a serial number) for each measurement currently on the screen.
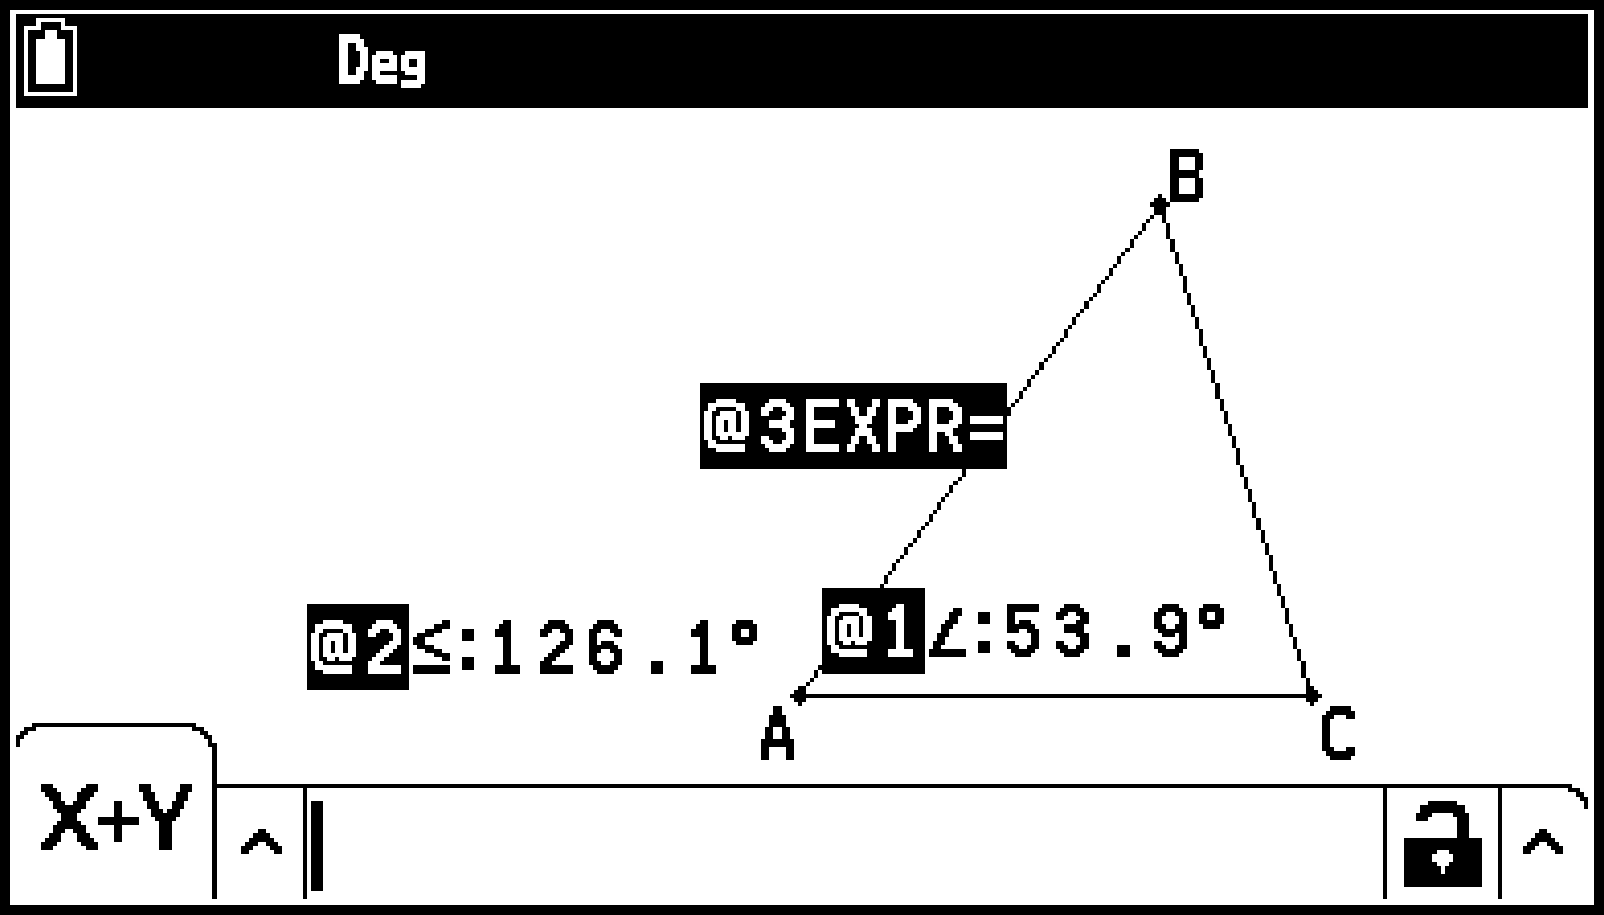
To input a measurement value in the measurement box, input the “@” symbol followed by the numeric label of the value: @1, @2, etc. Since we want to calculate the sum of the angle (@1) and the supplementary angle (@2) here, you would input the following: @1+@2.
You can input “@” by pressing C and then O.
The calculation result is displayed to the right of “EXPR=”.
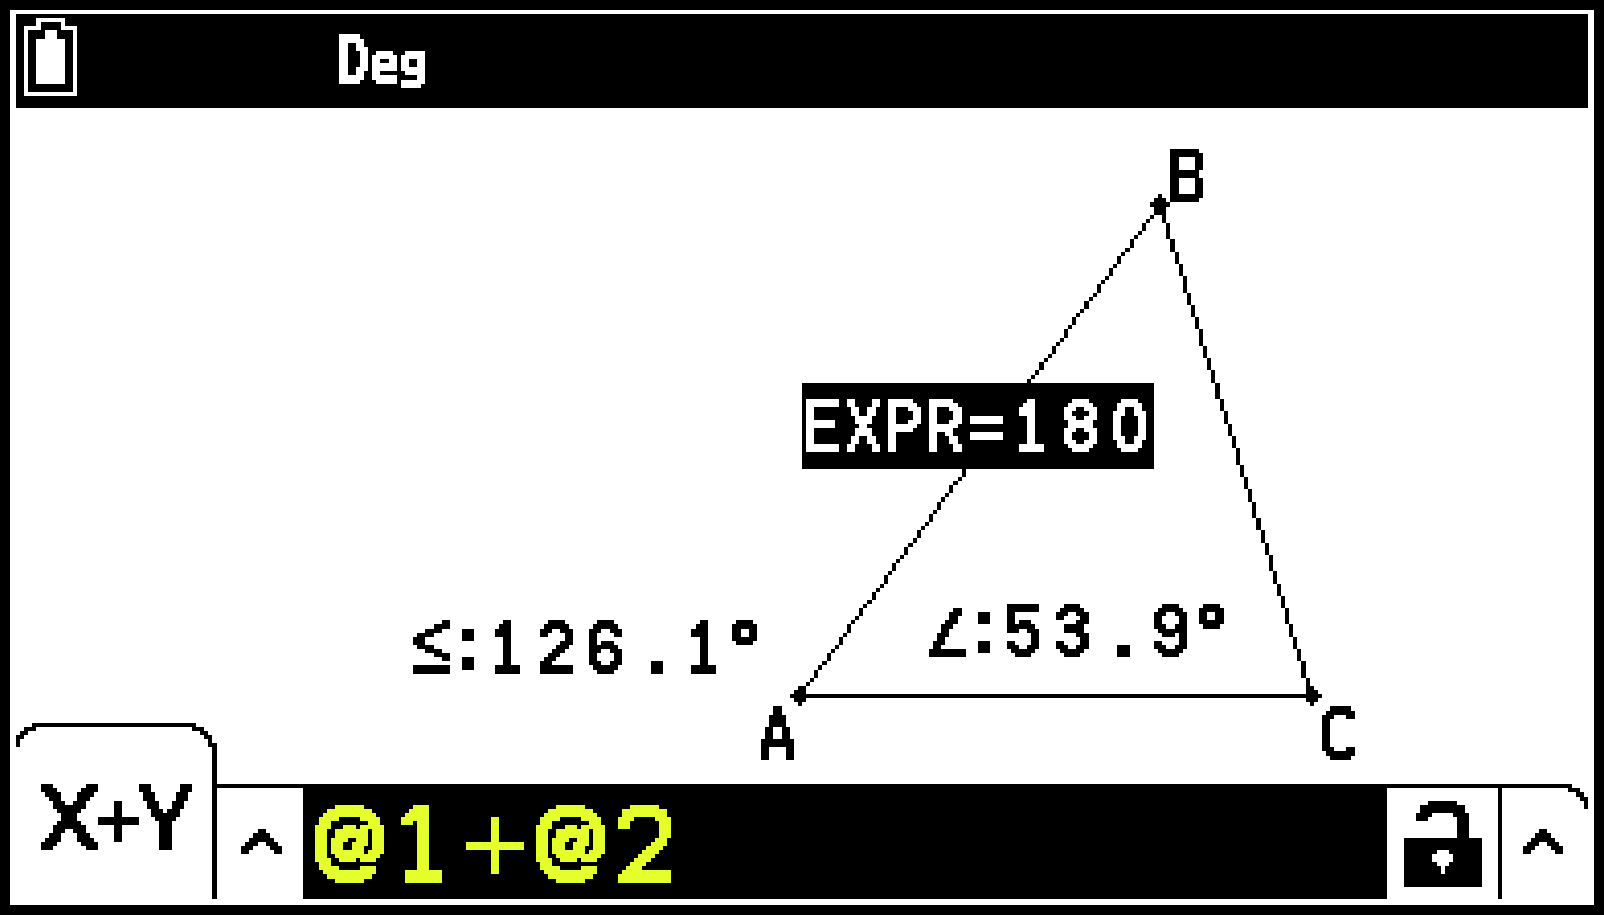
This way you can confirm that the calculation results for the entered expression are constant.
For information about moving a point, see To move an object.
Note
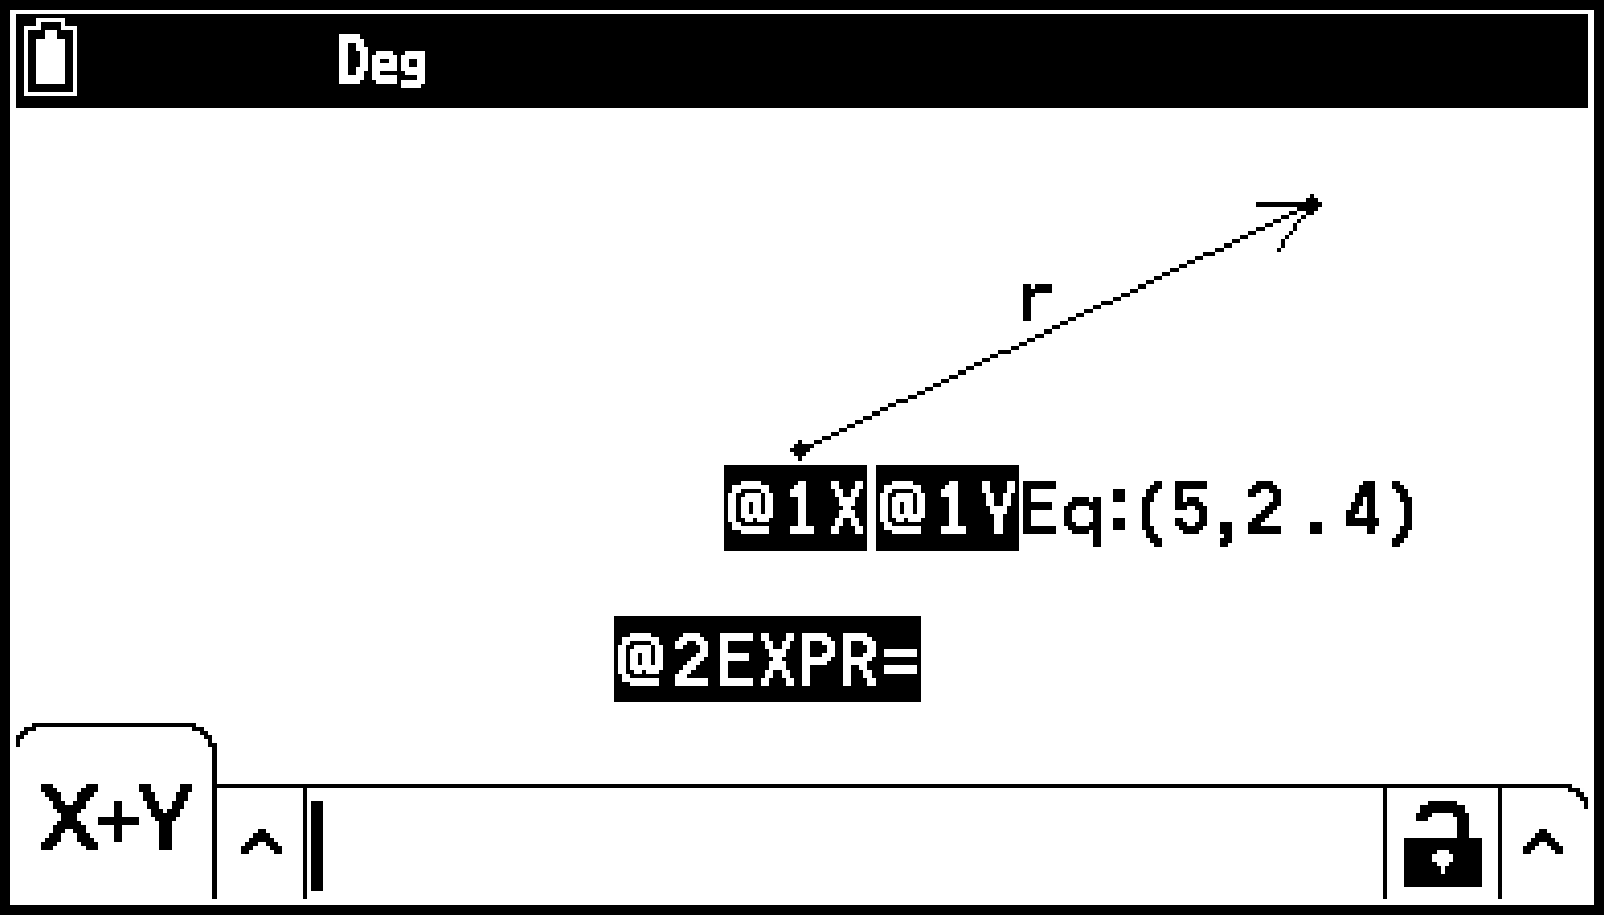
When a measurement is a coordinate or vector component, the label format becomes, “@1X”, “@1Y”, etc. “@1X” indicates the -value of a coordinate or the -component value of a vector, while “@1Y” indicates the -value of a coordinate or the -component value of a vector.
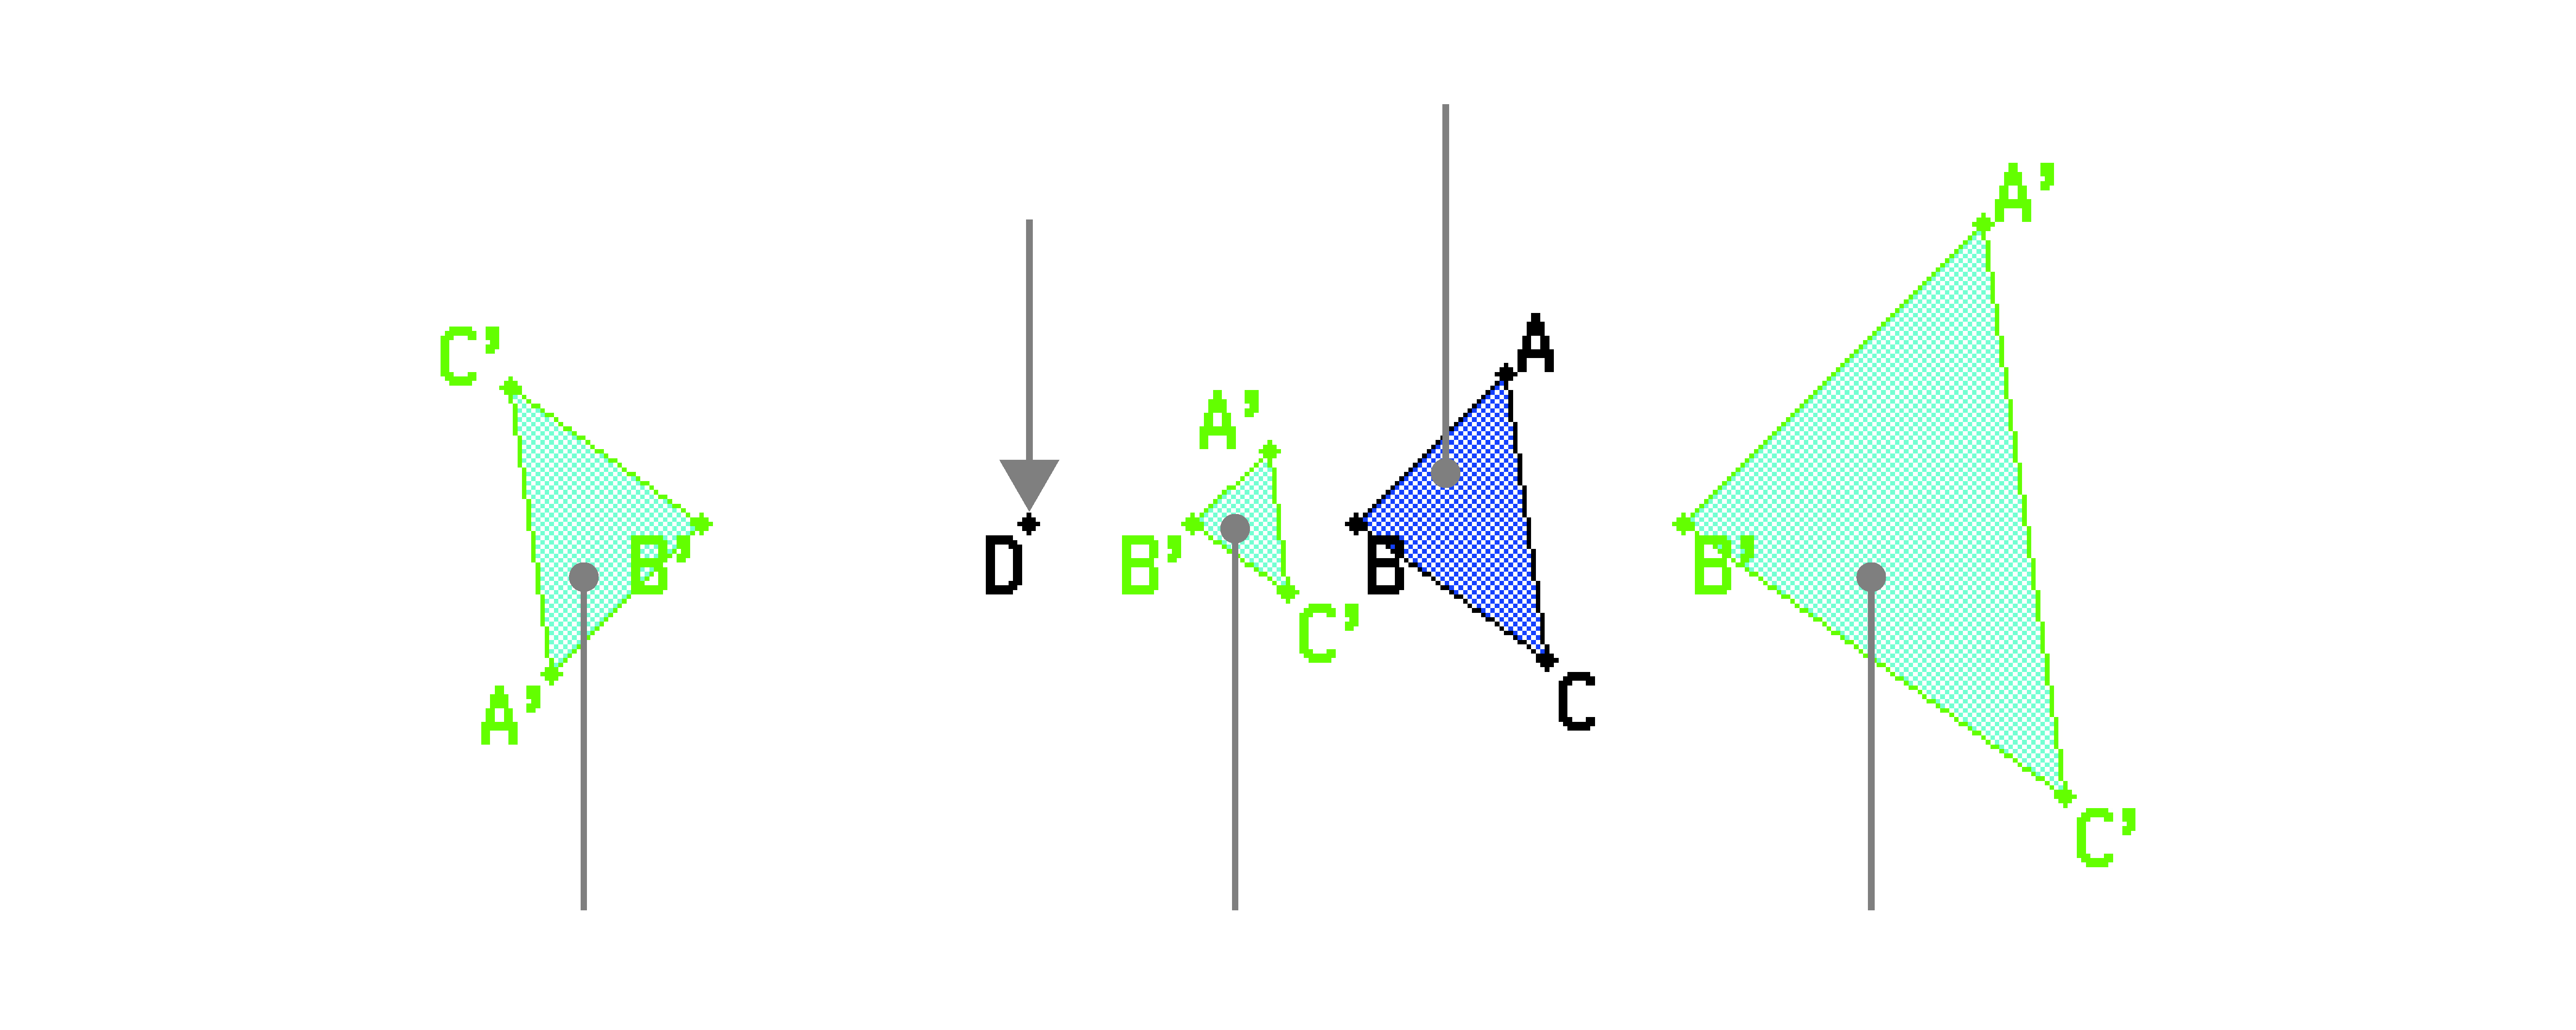
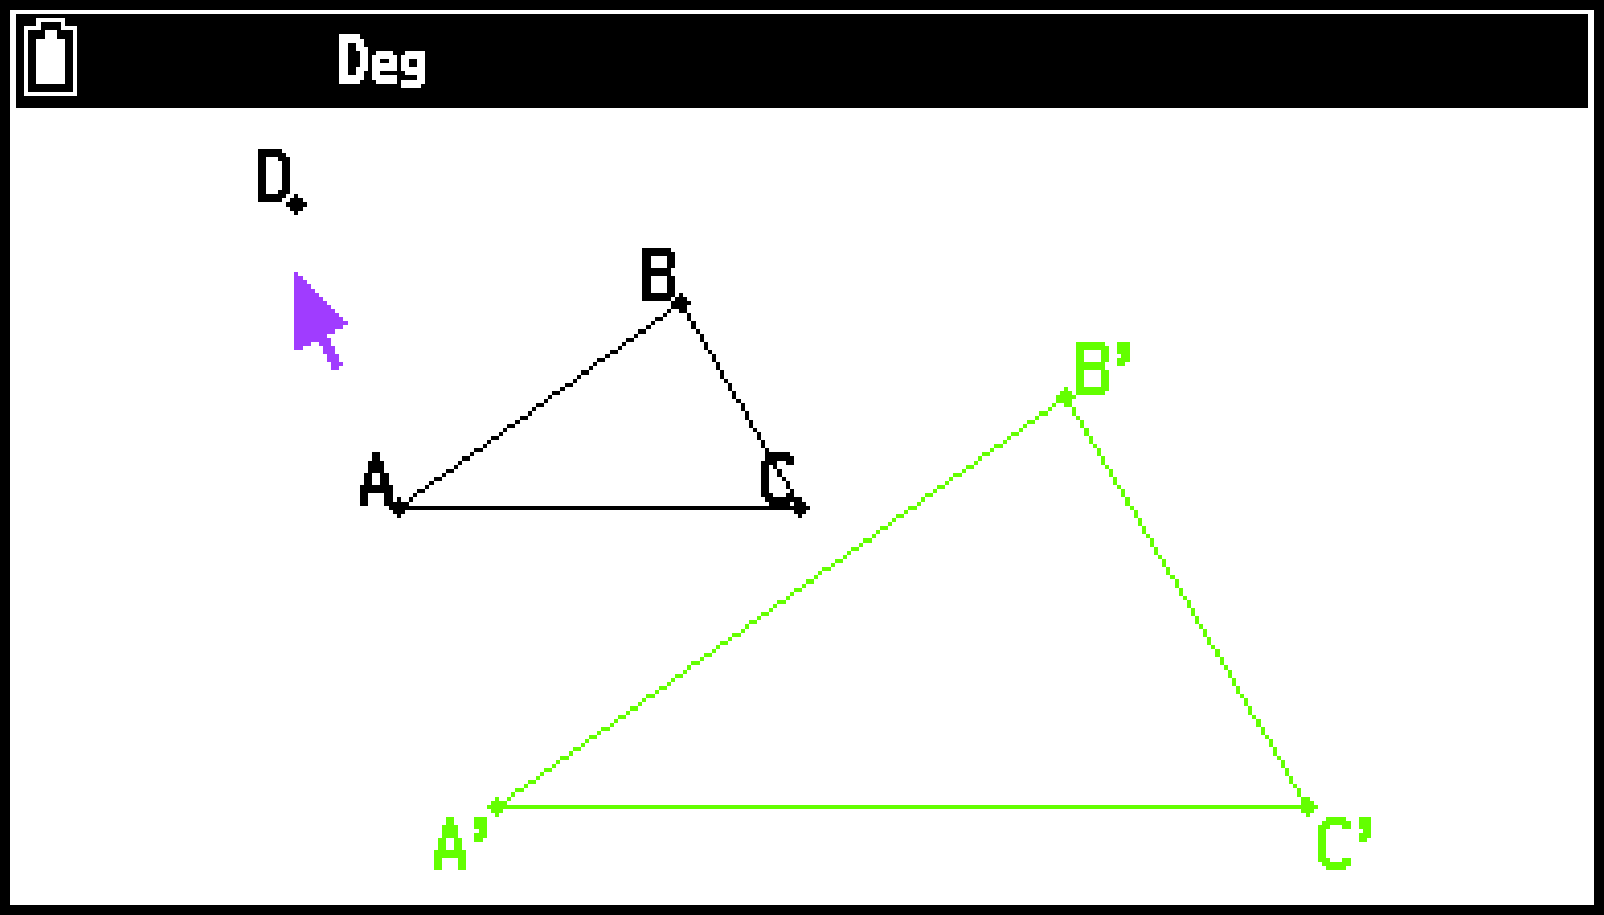
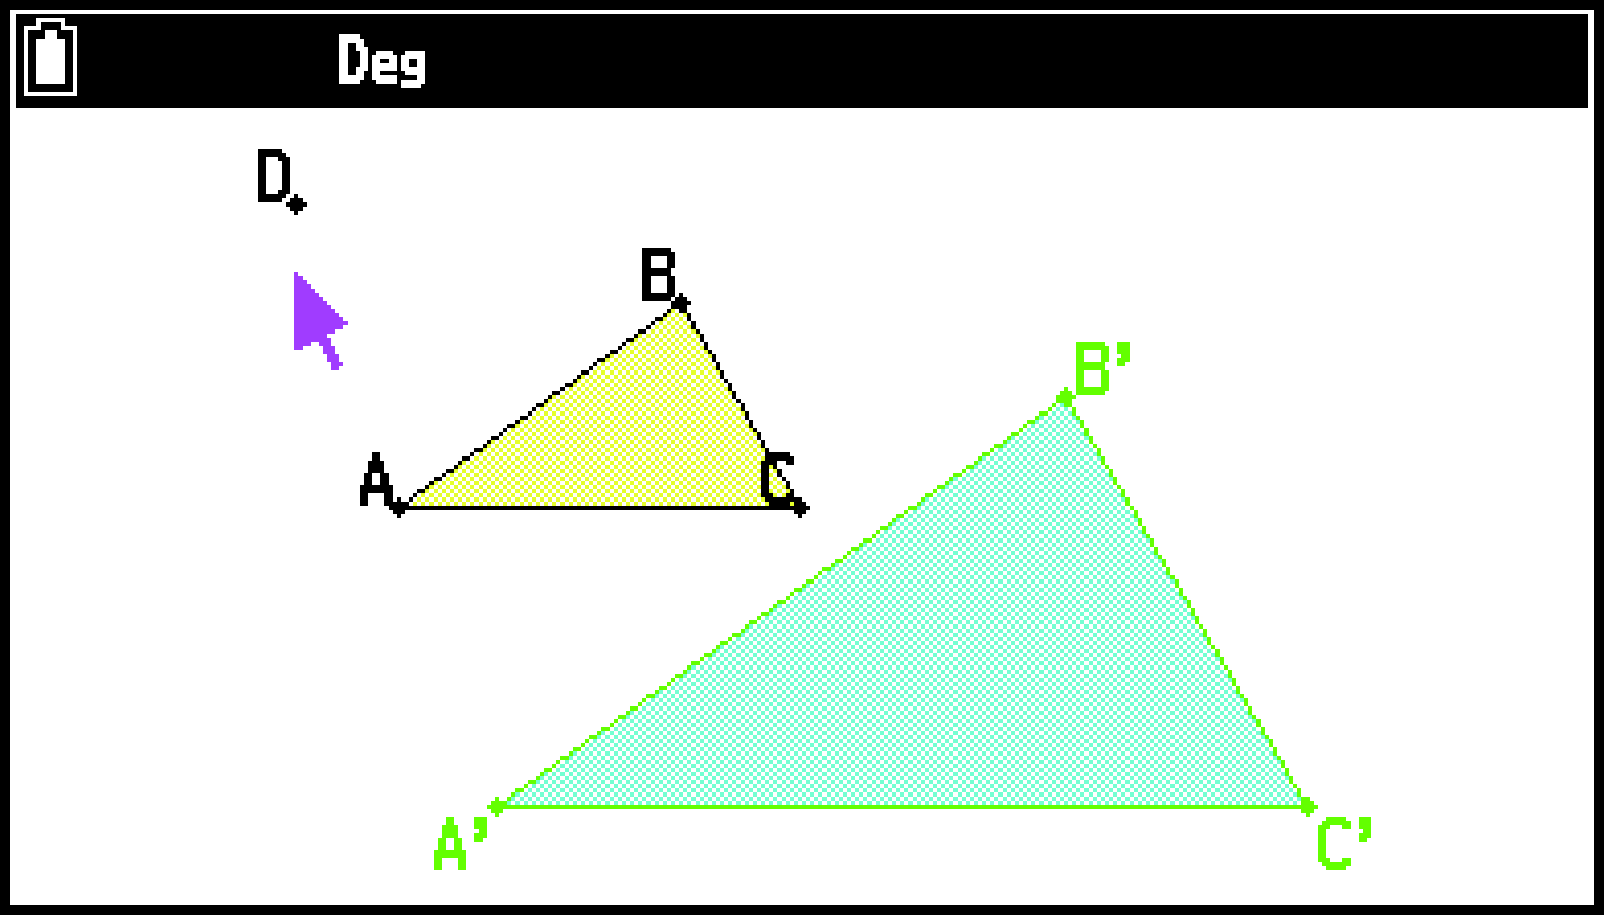
Example 2: To draw △ABC and then draw △A’B’C’ by doubling the length of each side of △ABC. Next, divide the area of △A’B’C’ by the area of △ABC.
In this example, the Area Calc command is used, which allows input of the area of a filled figure into a formula.
-
Draw and select △ABC and then use T > [Transformations] > [Dilation] to draw the double scale △A’B’C’.
-
Specify yellow as the fill color for △ABC and cyan as the fill color for △A’B’C’.
-
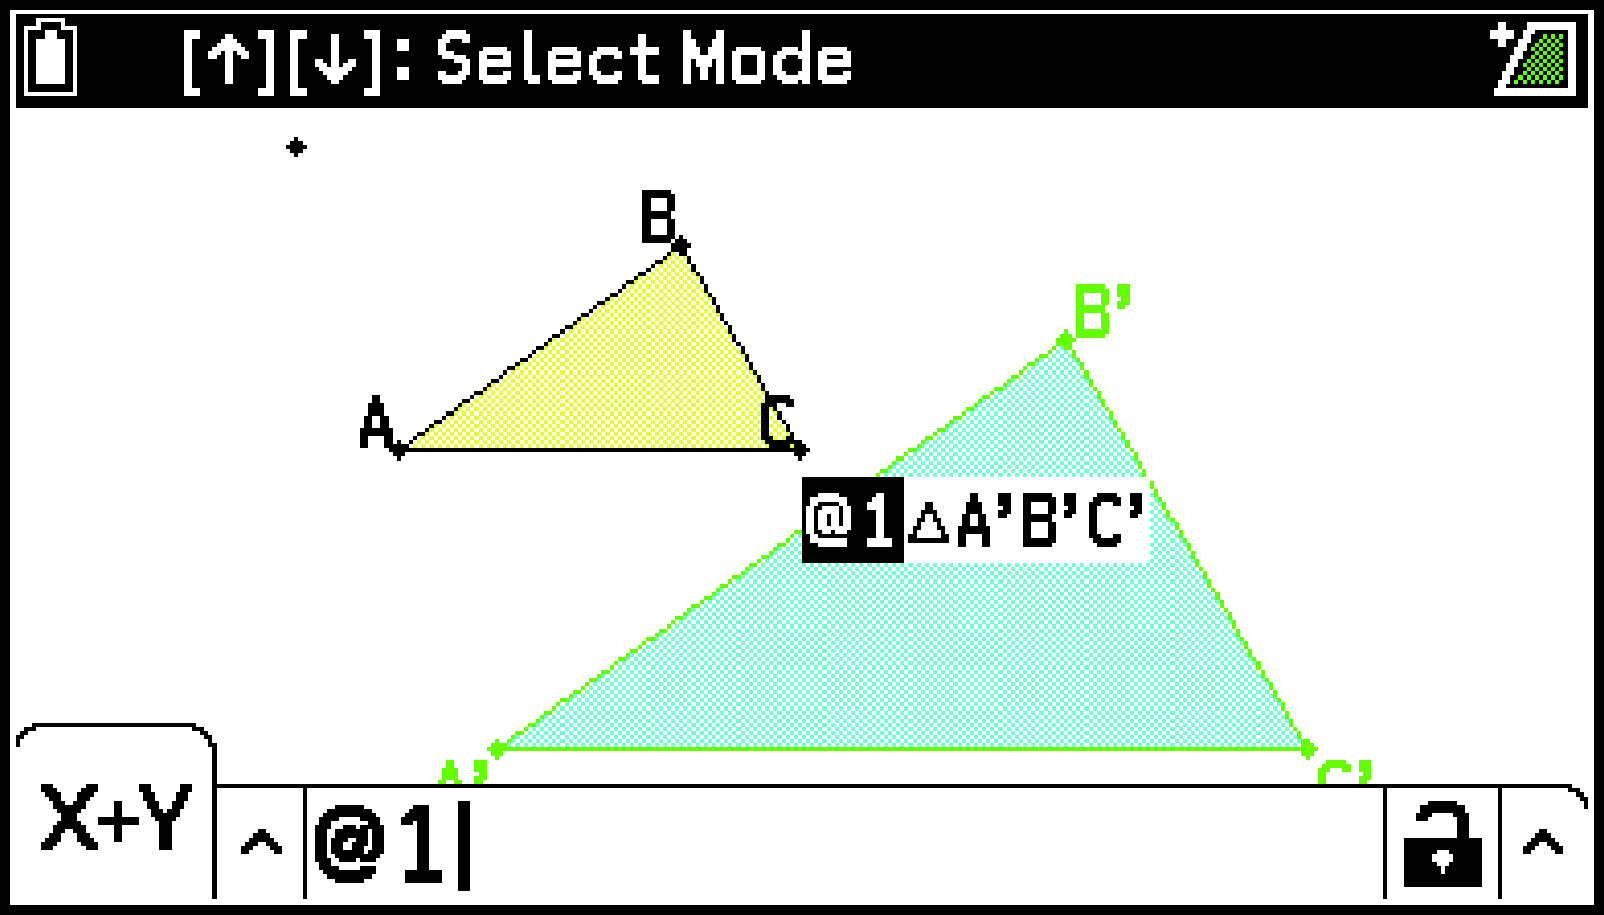
Select T > [Option] > [Area Calc].
-
Use l and r to select △A’B’C’ and then press O.
-
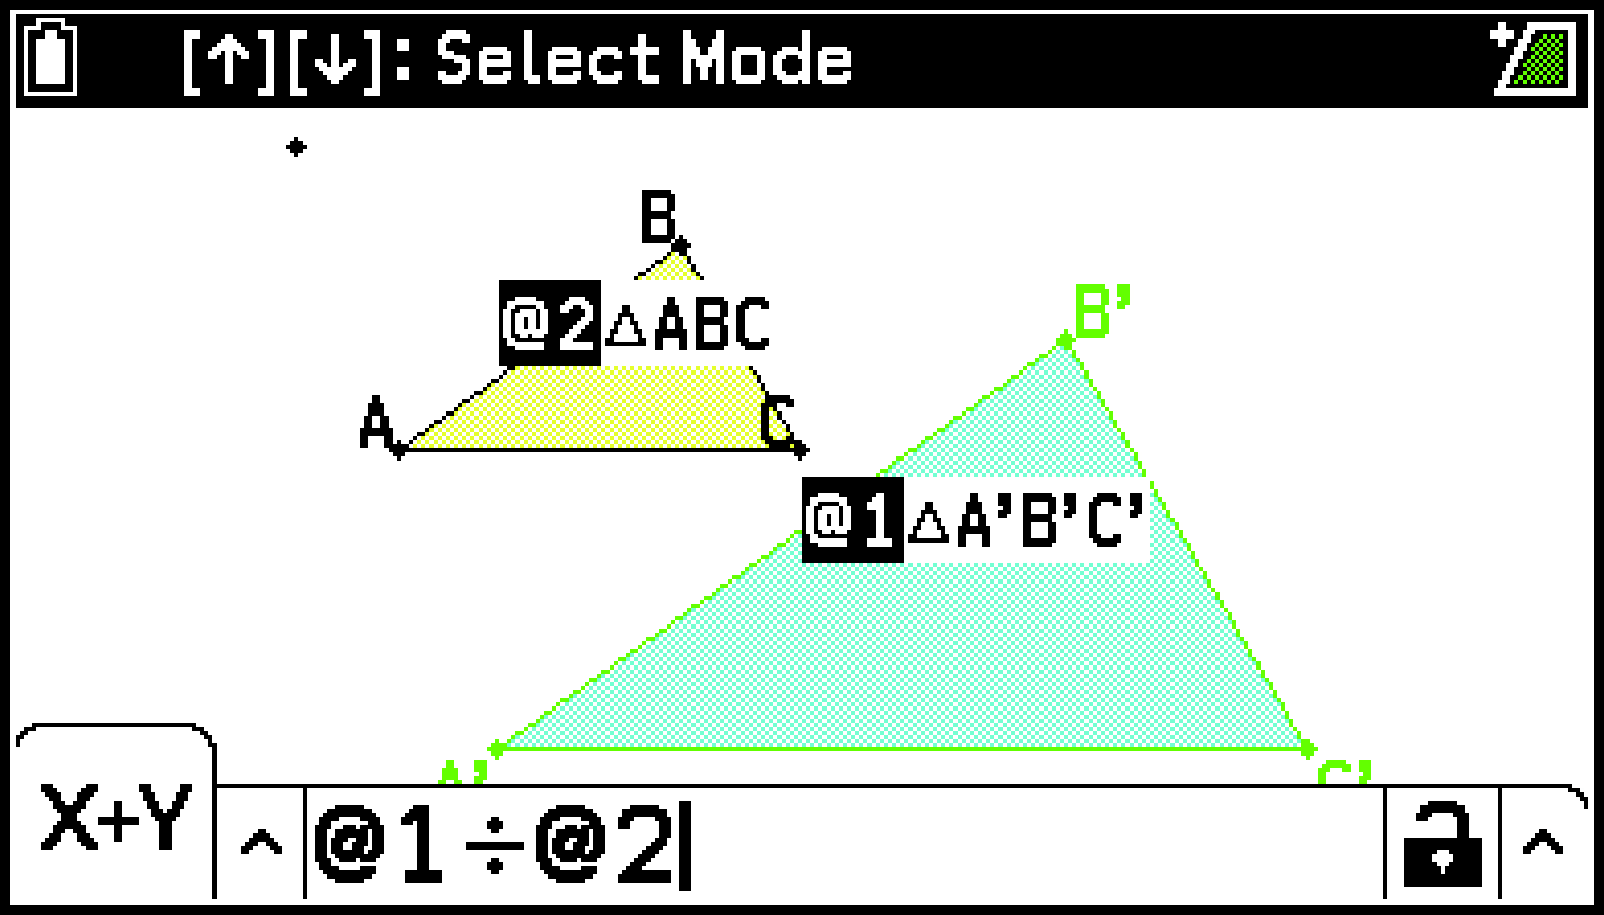
Press * and then u.
-
Use l and r to select △ABC and then press O.
-
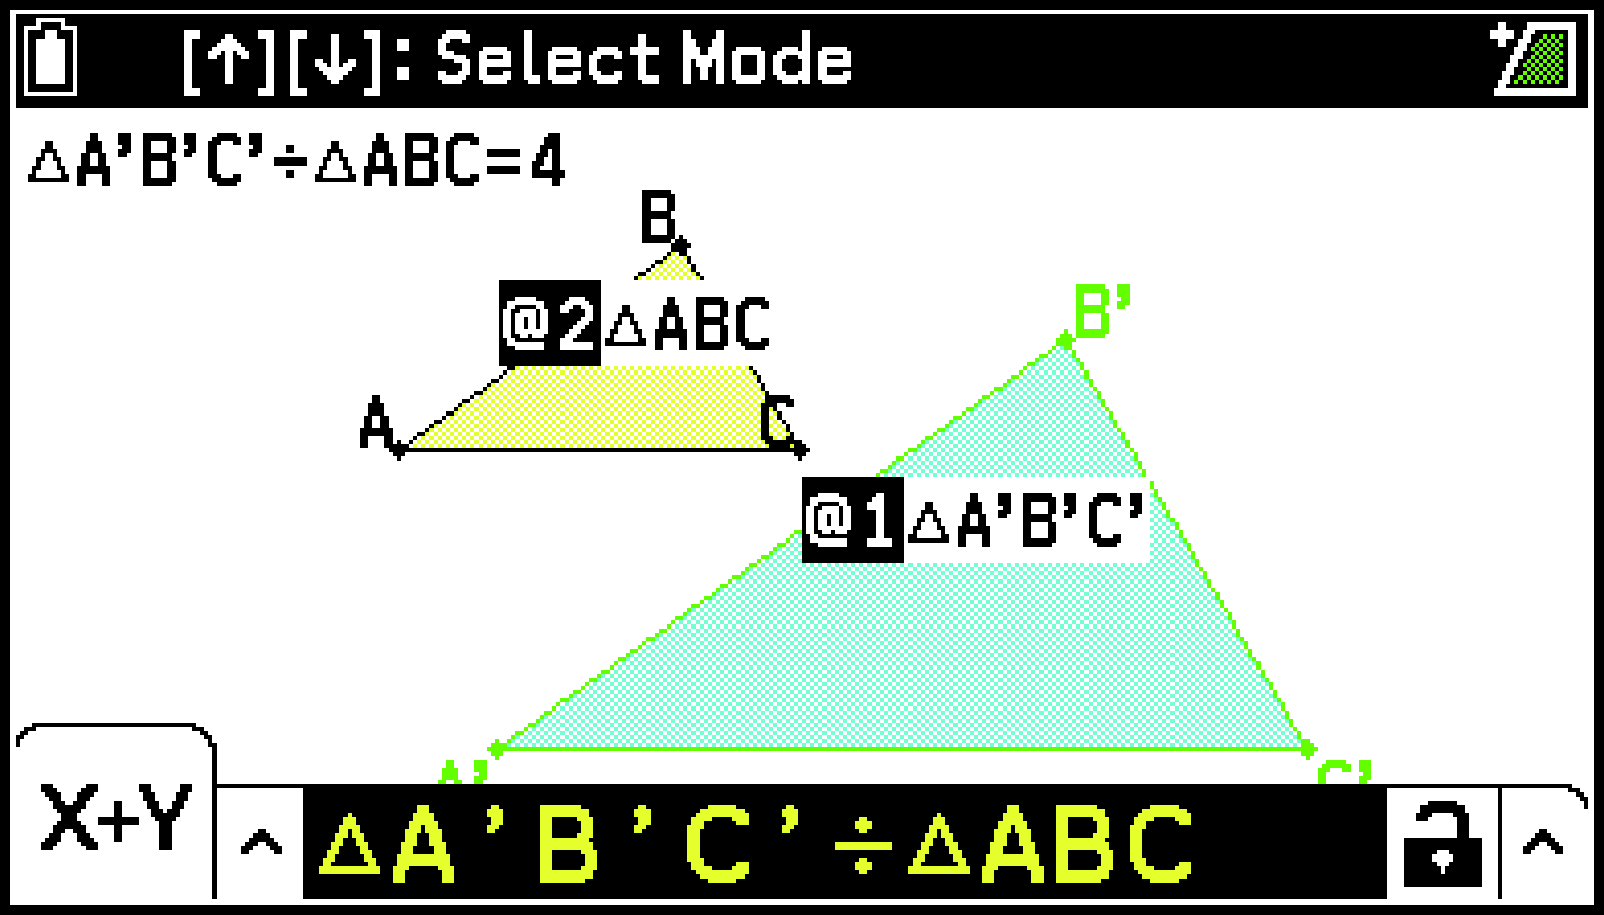
Press O.
-
Press b to hide the measurement box.
For details about using the Dilation operation, see Other Transformation Operations.
For information about changing the fill color of figures, see To specify fill color and intensity of a closed figure (polygon, circle, etc.)
This selects one of the filled triangles (in this case △ABC) and displays the message “[←][→]: Select Figure” in the status bar.
This inputs “@1”, which represents the area of △A’B’C’, into the measurement box.
This causes the message “[←][→]: Select Figure” to reappear in the status bar.
This inputs “@2”, which represents the area of △ABC, into the measurement box.
The measurement box contents change from “@1÷@2” to “△A’B’C’÷△ABC”, and the calculation result appears in the upper left corner of the screen.
Specifying the Number Format of a Measurement
You can specify the number format for each measurement on the screen.
Note
The initial default number format is “Fix2: 0.12”. For details about number format options, see Display (General).
Regardless of the current number format setting, integer values are always displayed with their decimal parts cut off.
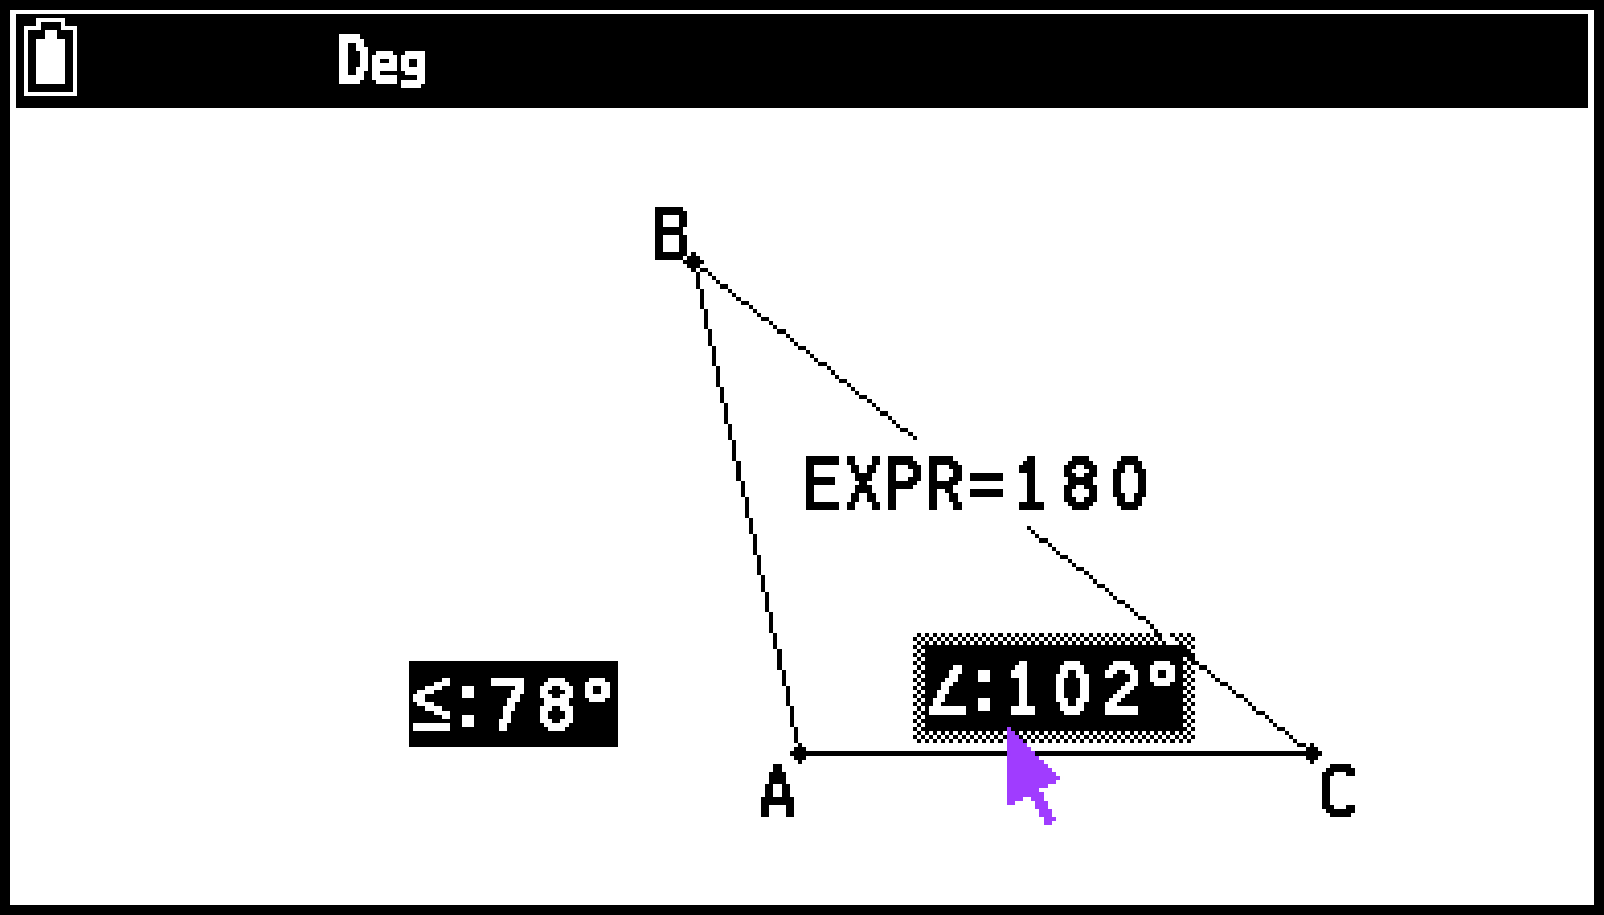
Example: After completing Example 1 under Displaying the Result of a Calculation that Uses On-screen Measurement Values, change the display format of the two angle measurements to Fix0: 0. (rounded to one decimal place)
-
Select the measurements whose number format you want to change.
-
Select T > [Option] > [Number Format] > [Fix0: 0.].
Here we select measurements for two angles (∠BAC and its supplementary angle).
The selected measurements are displayed according to the currently specified number format.
Working with Animations
An animation consists of one or more point/curve pairs, in which the curve can be a line segment, circle, semi-circle, arc, or function. You build an animation by selecting a point/curve pair and then adding it to an animation.
Creating and Running an Animation
To add an animation and run it
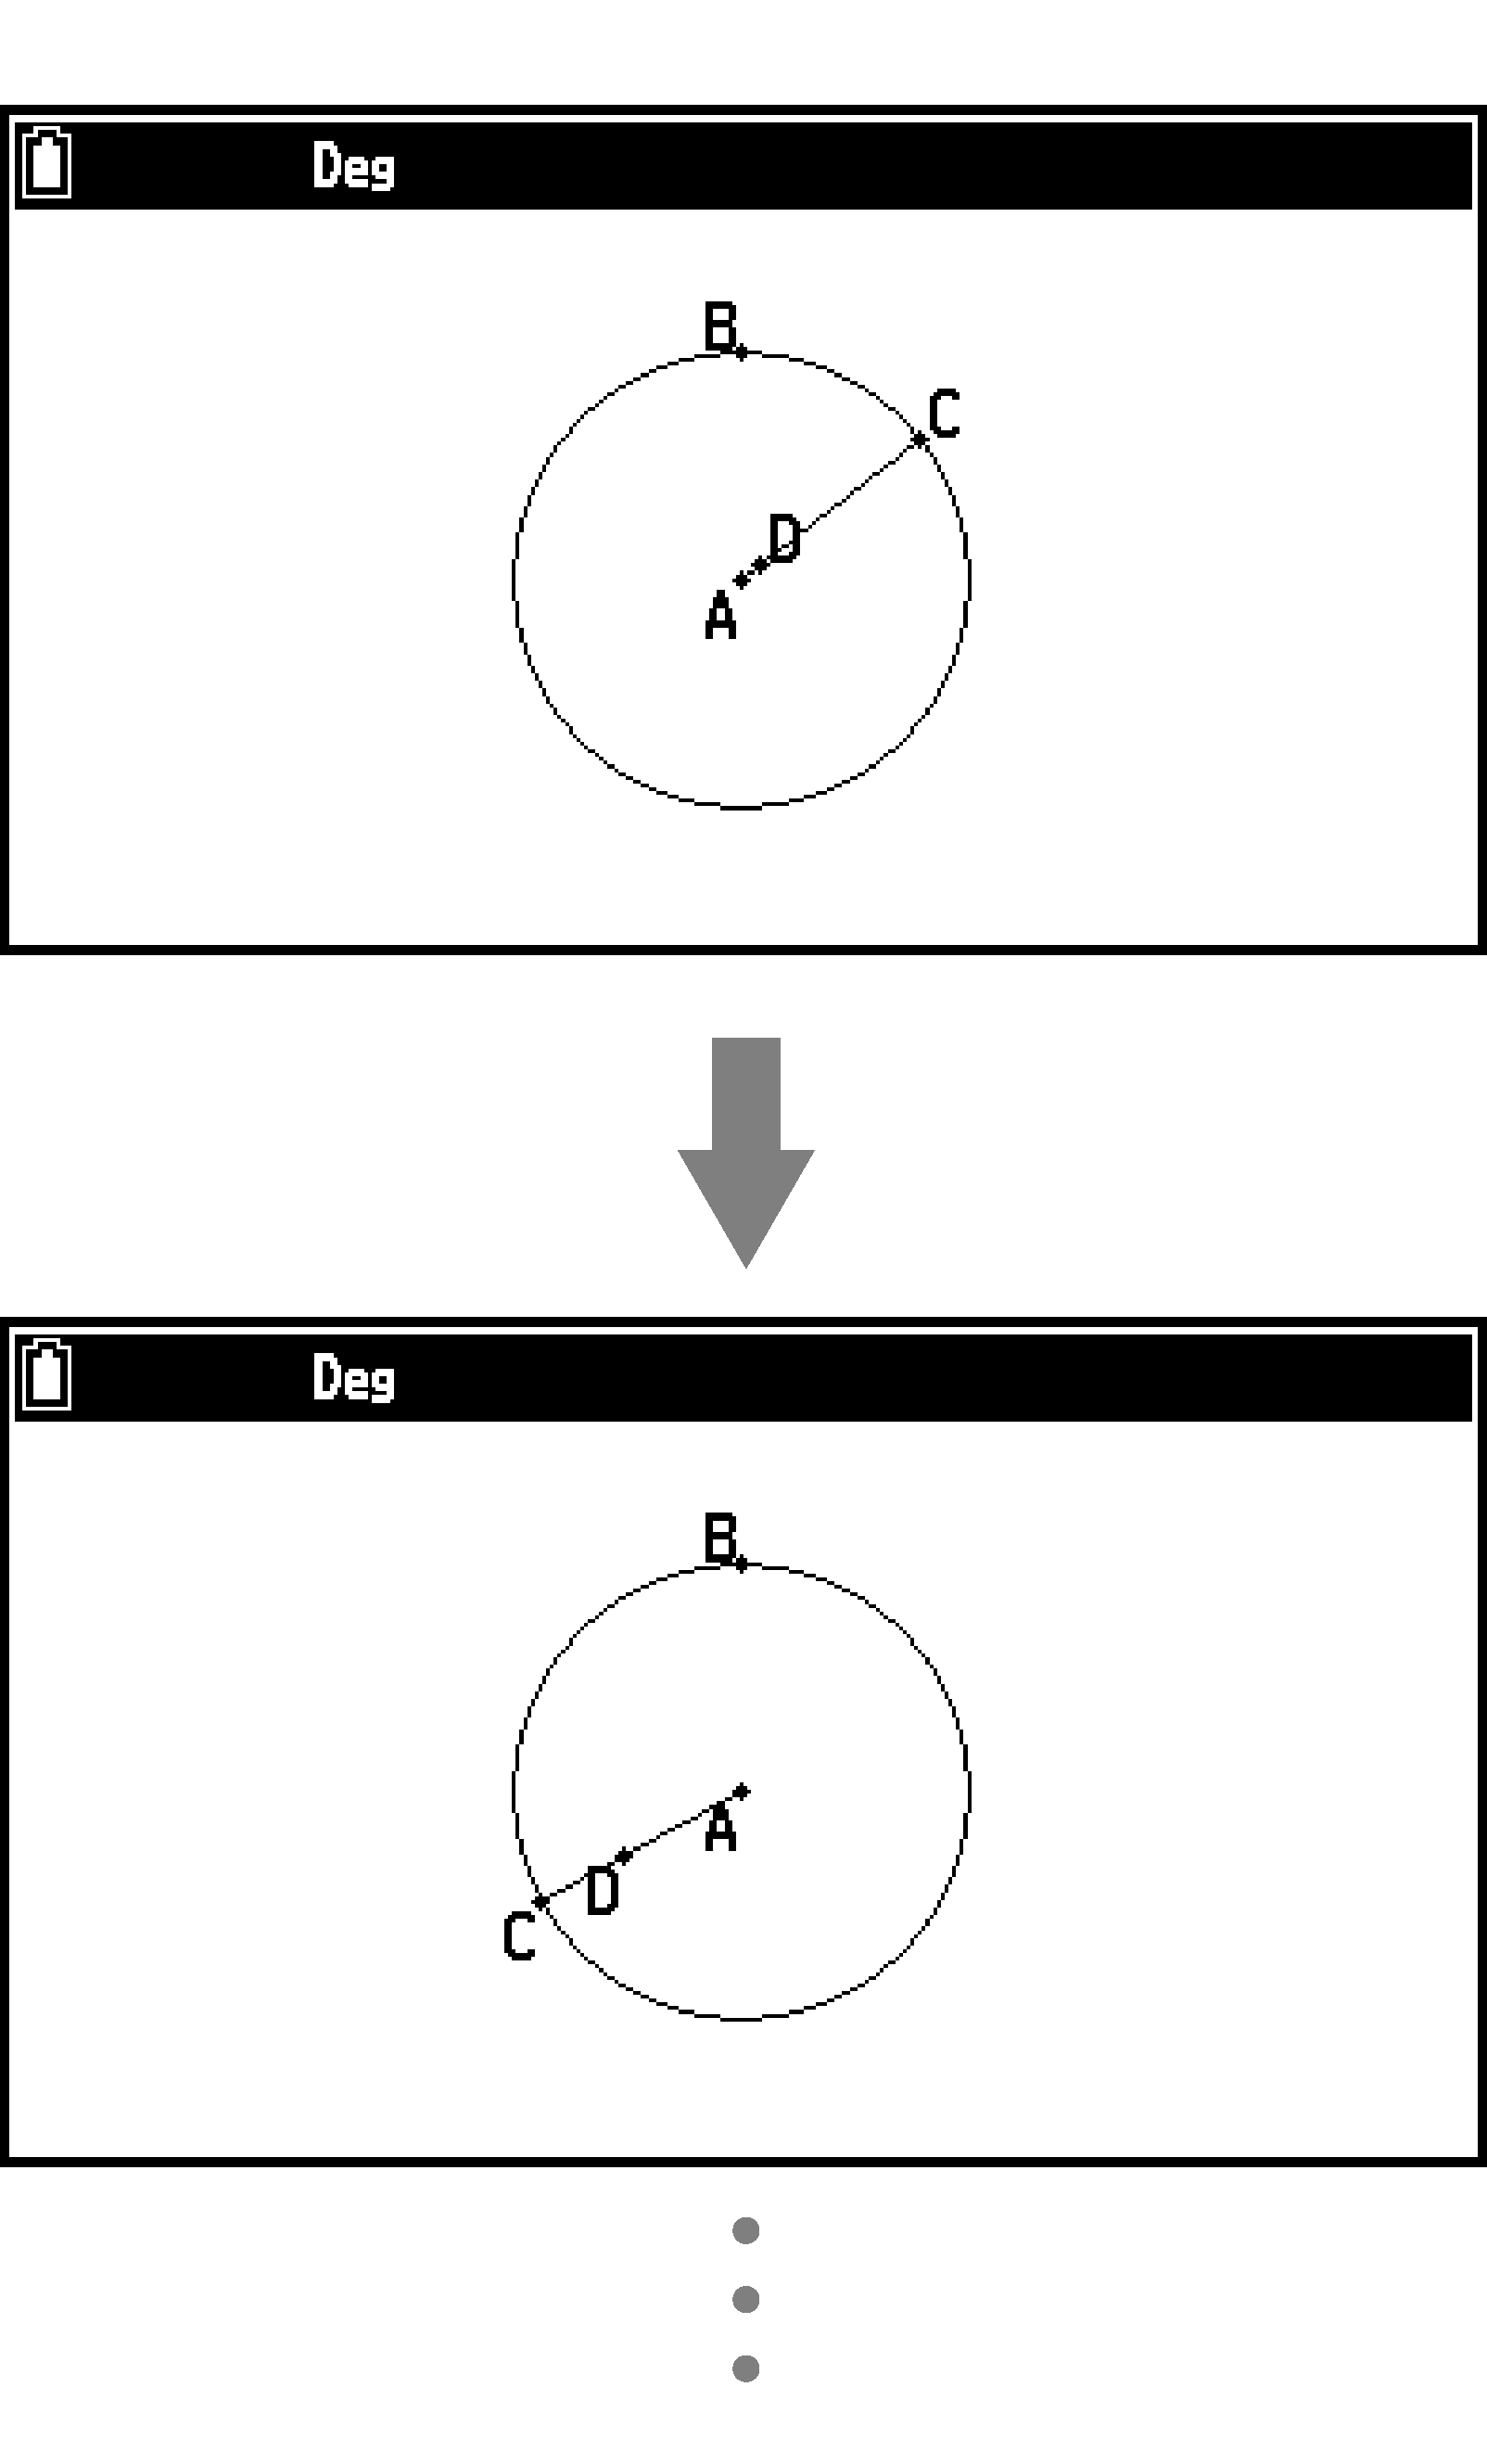
Example 1: To draw a circle and its radius (line segment AC), and draw point D on the radius. Next, create an animation that moves point C on the circumference and point D on line segment AC at the same time.
-
Draw a circle and its radius line segment AC (A: center, C: point on the circumference), and draw point D on the radius.
-
Select point C and the circumference.
-
Select T > [Animate] > [Add Animation].
-
Press a to deselect all figures and then select point D and line segment AC.
-
Select T > [Animate] > [Add Animation].
-
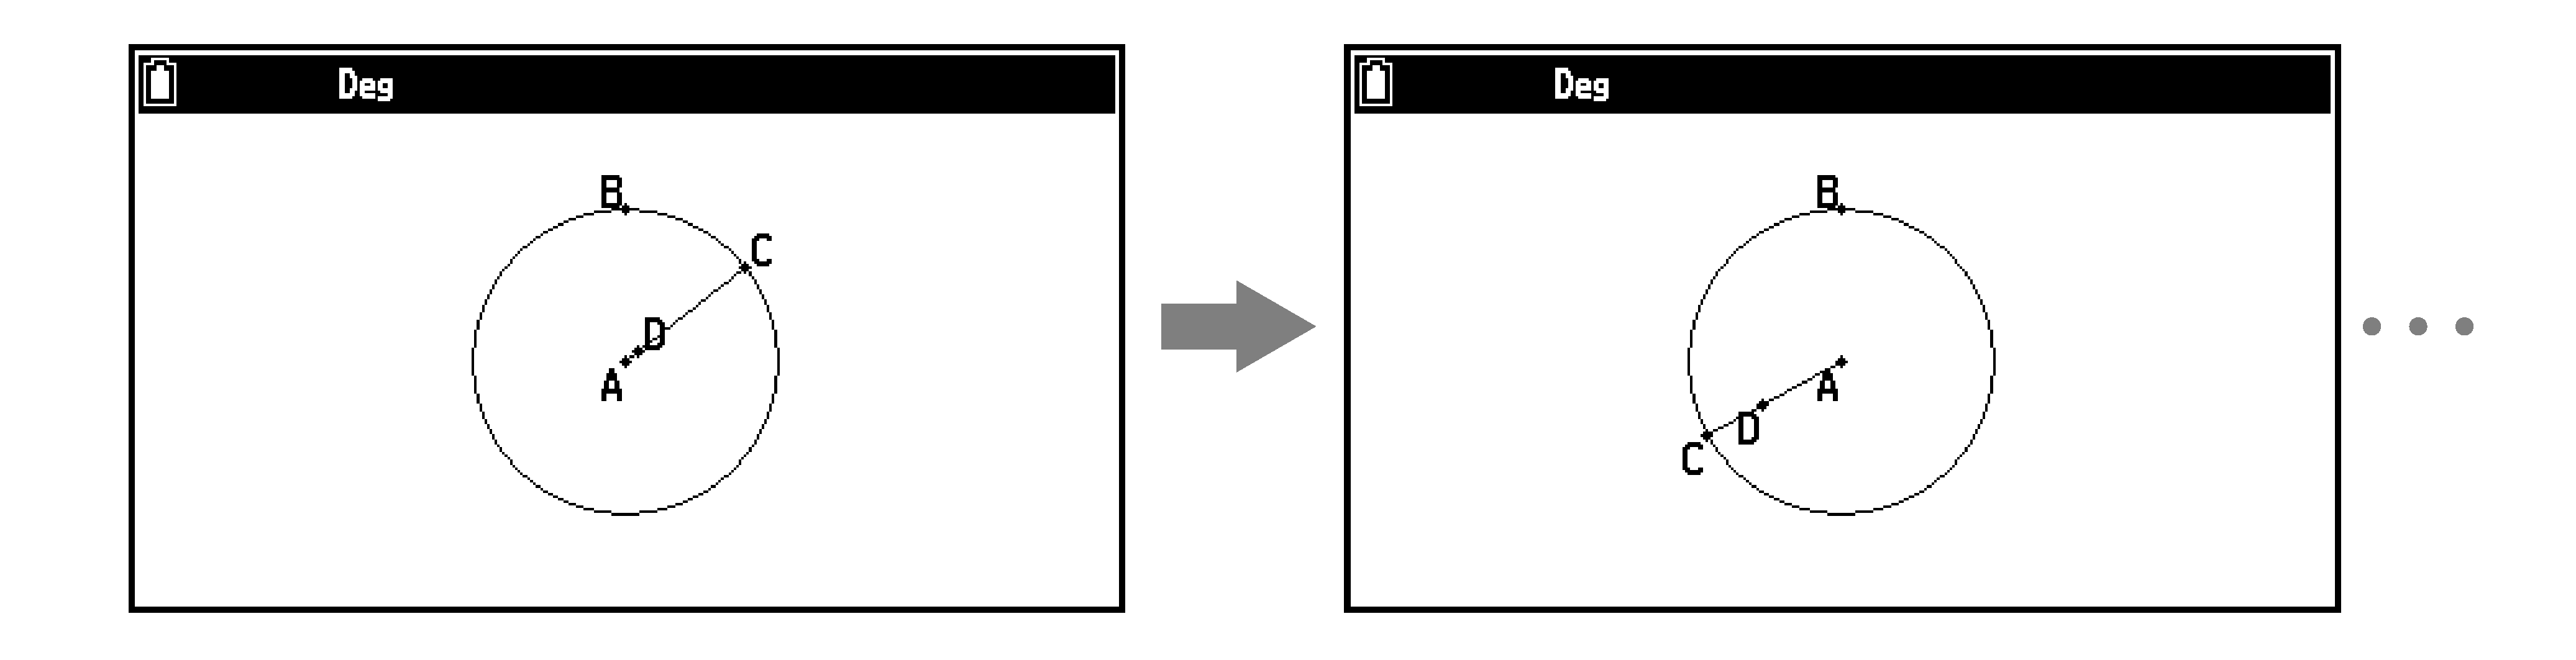
To run the animation, select T > [Animate] > [Go(once)] or [Go(repeat)].
-
To stop the animation, press b or a.
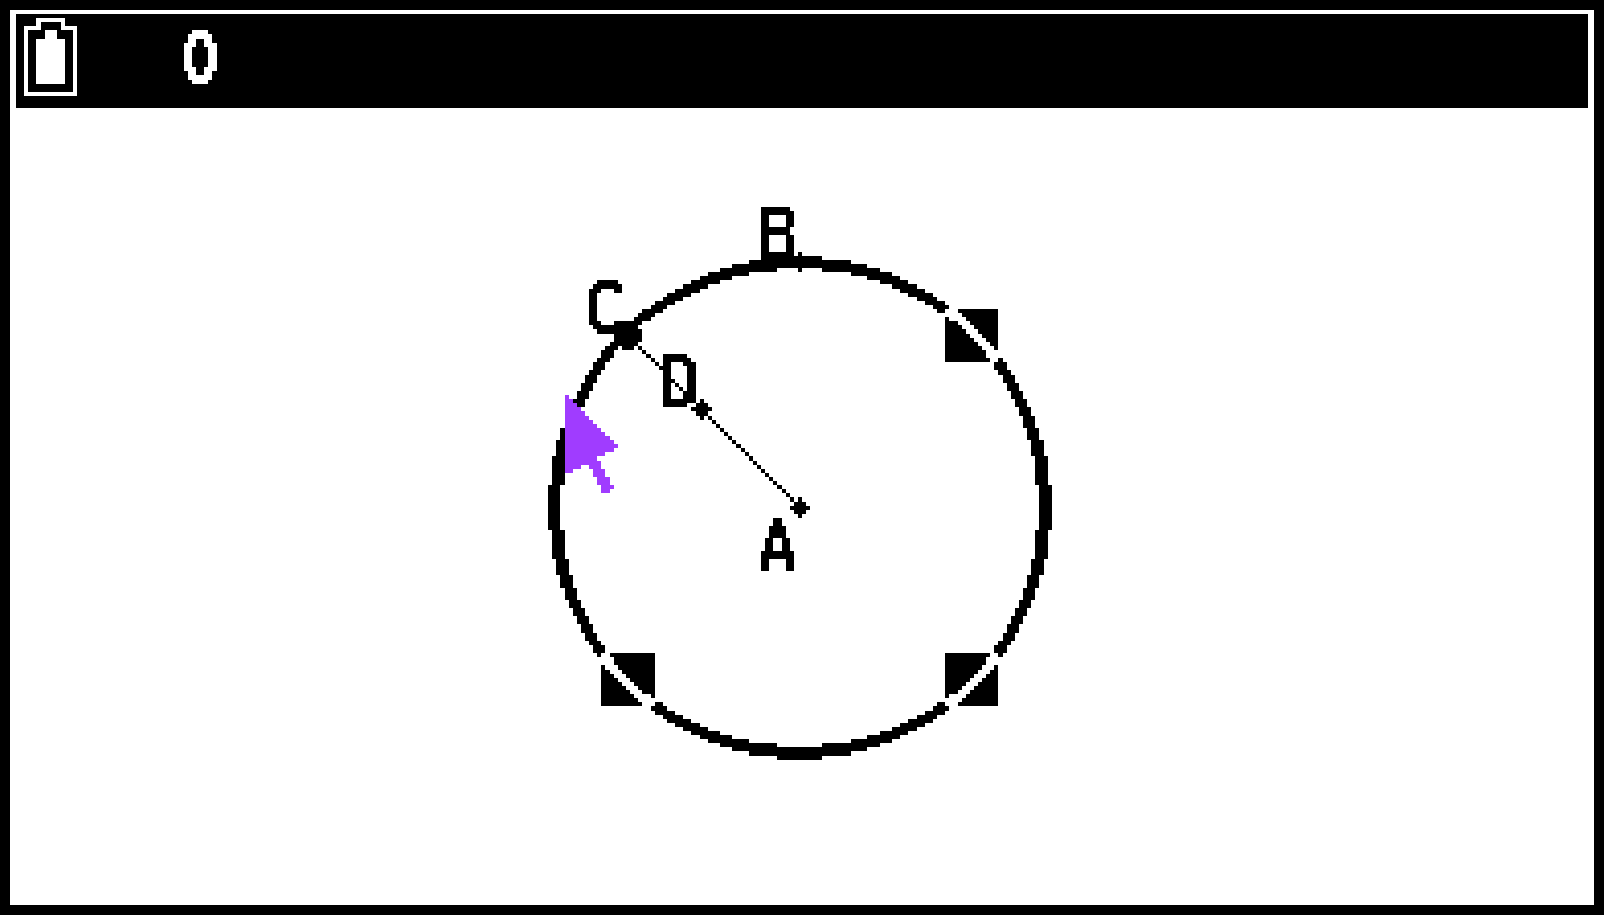
This adds an animation that moves point C on the circumference.
This adds an animation that moves point D on line segment AC.
Point C moves on the circumference and point D moves on line AC at the same time.
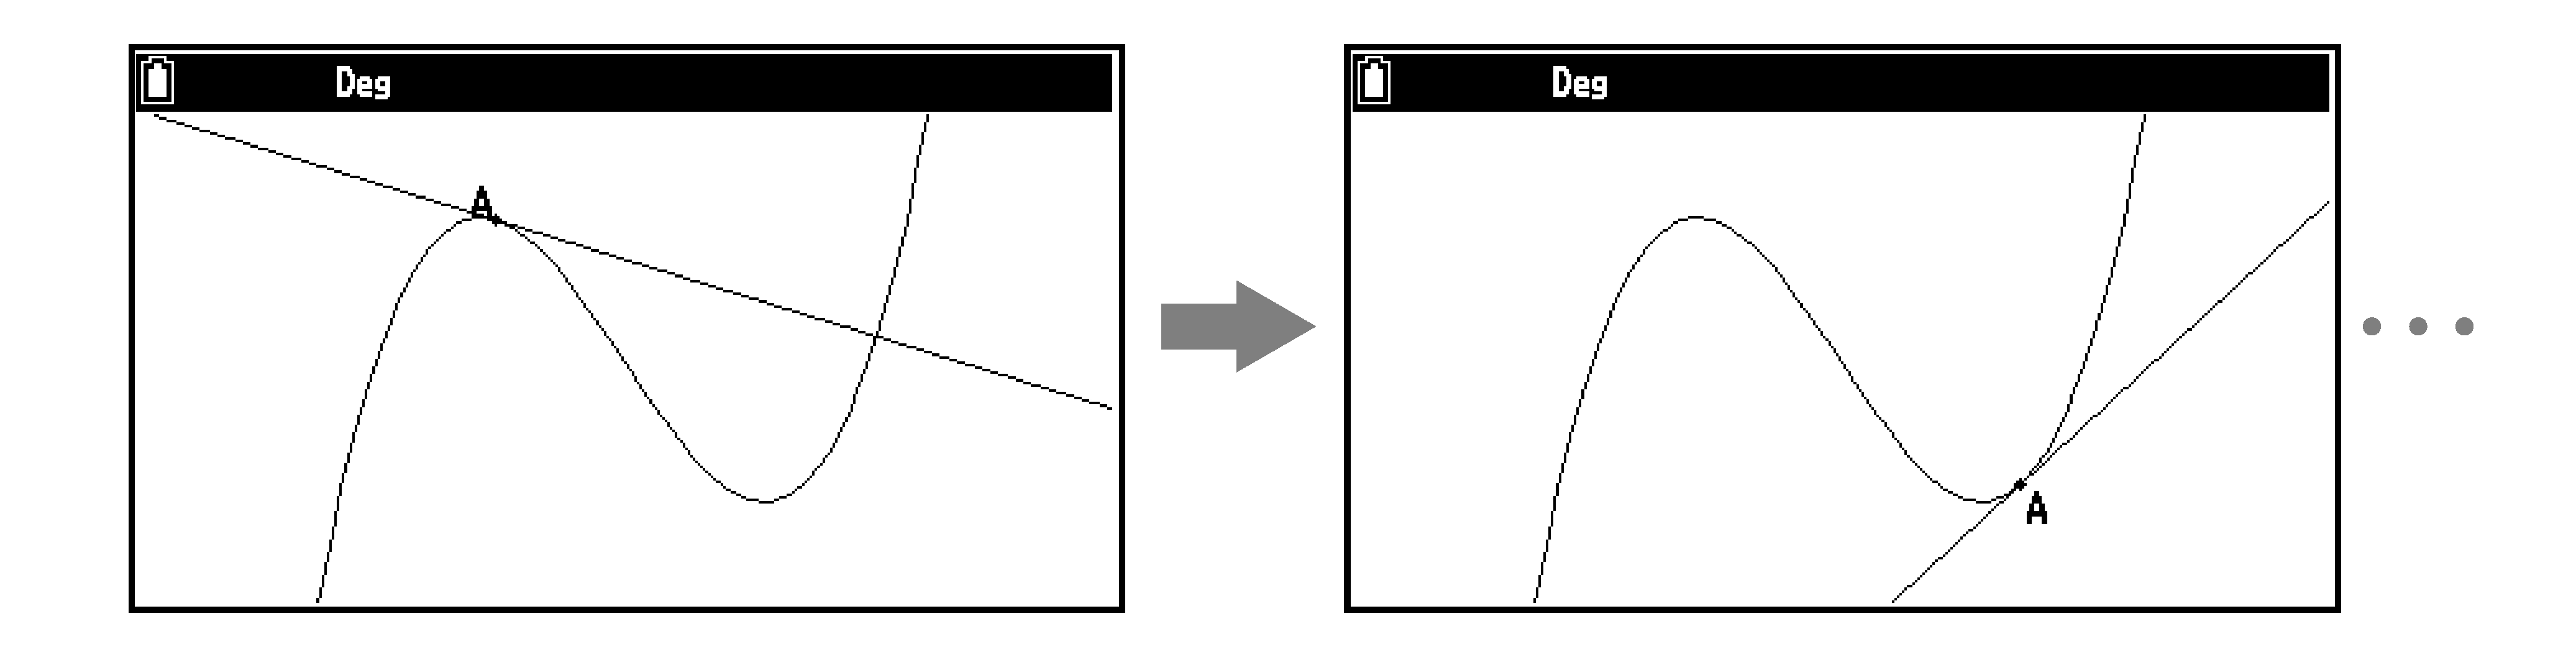
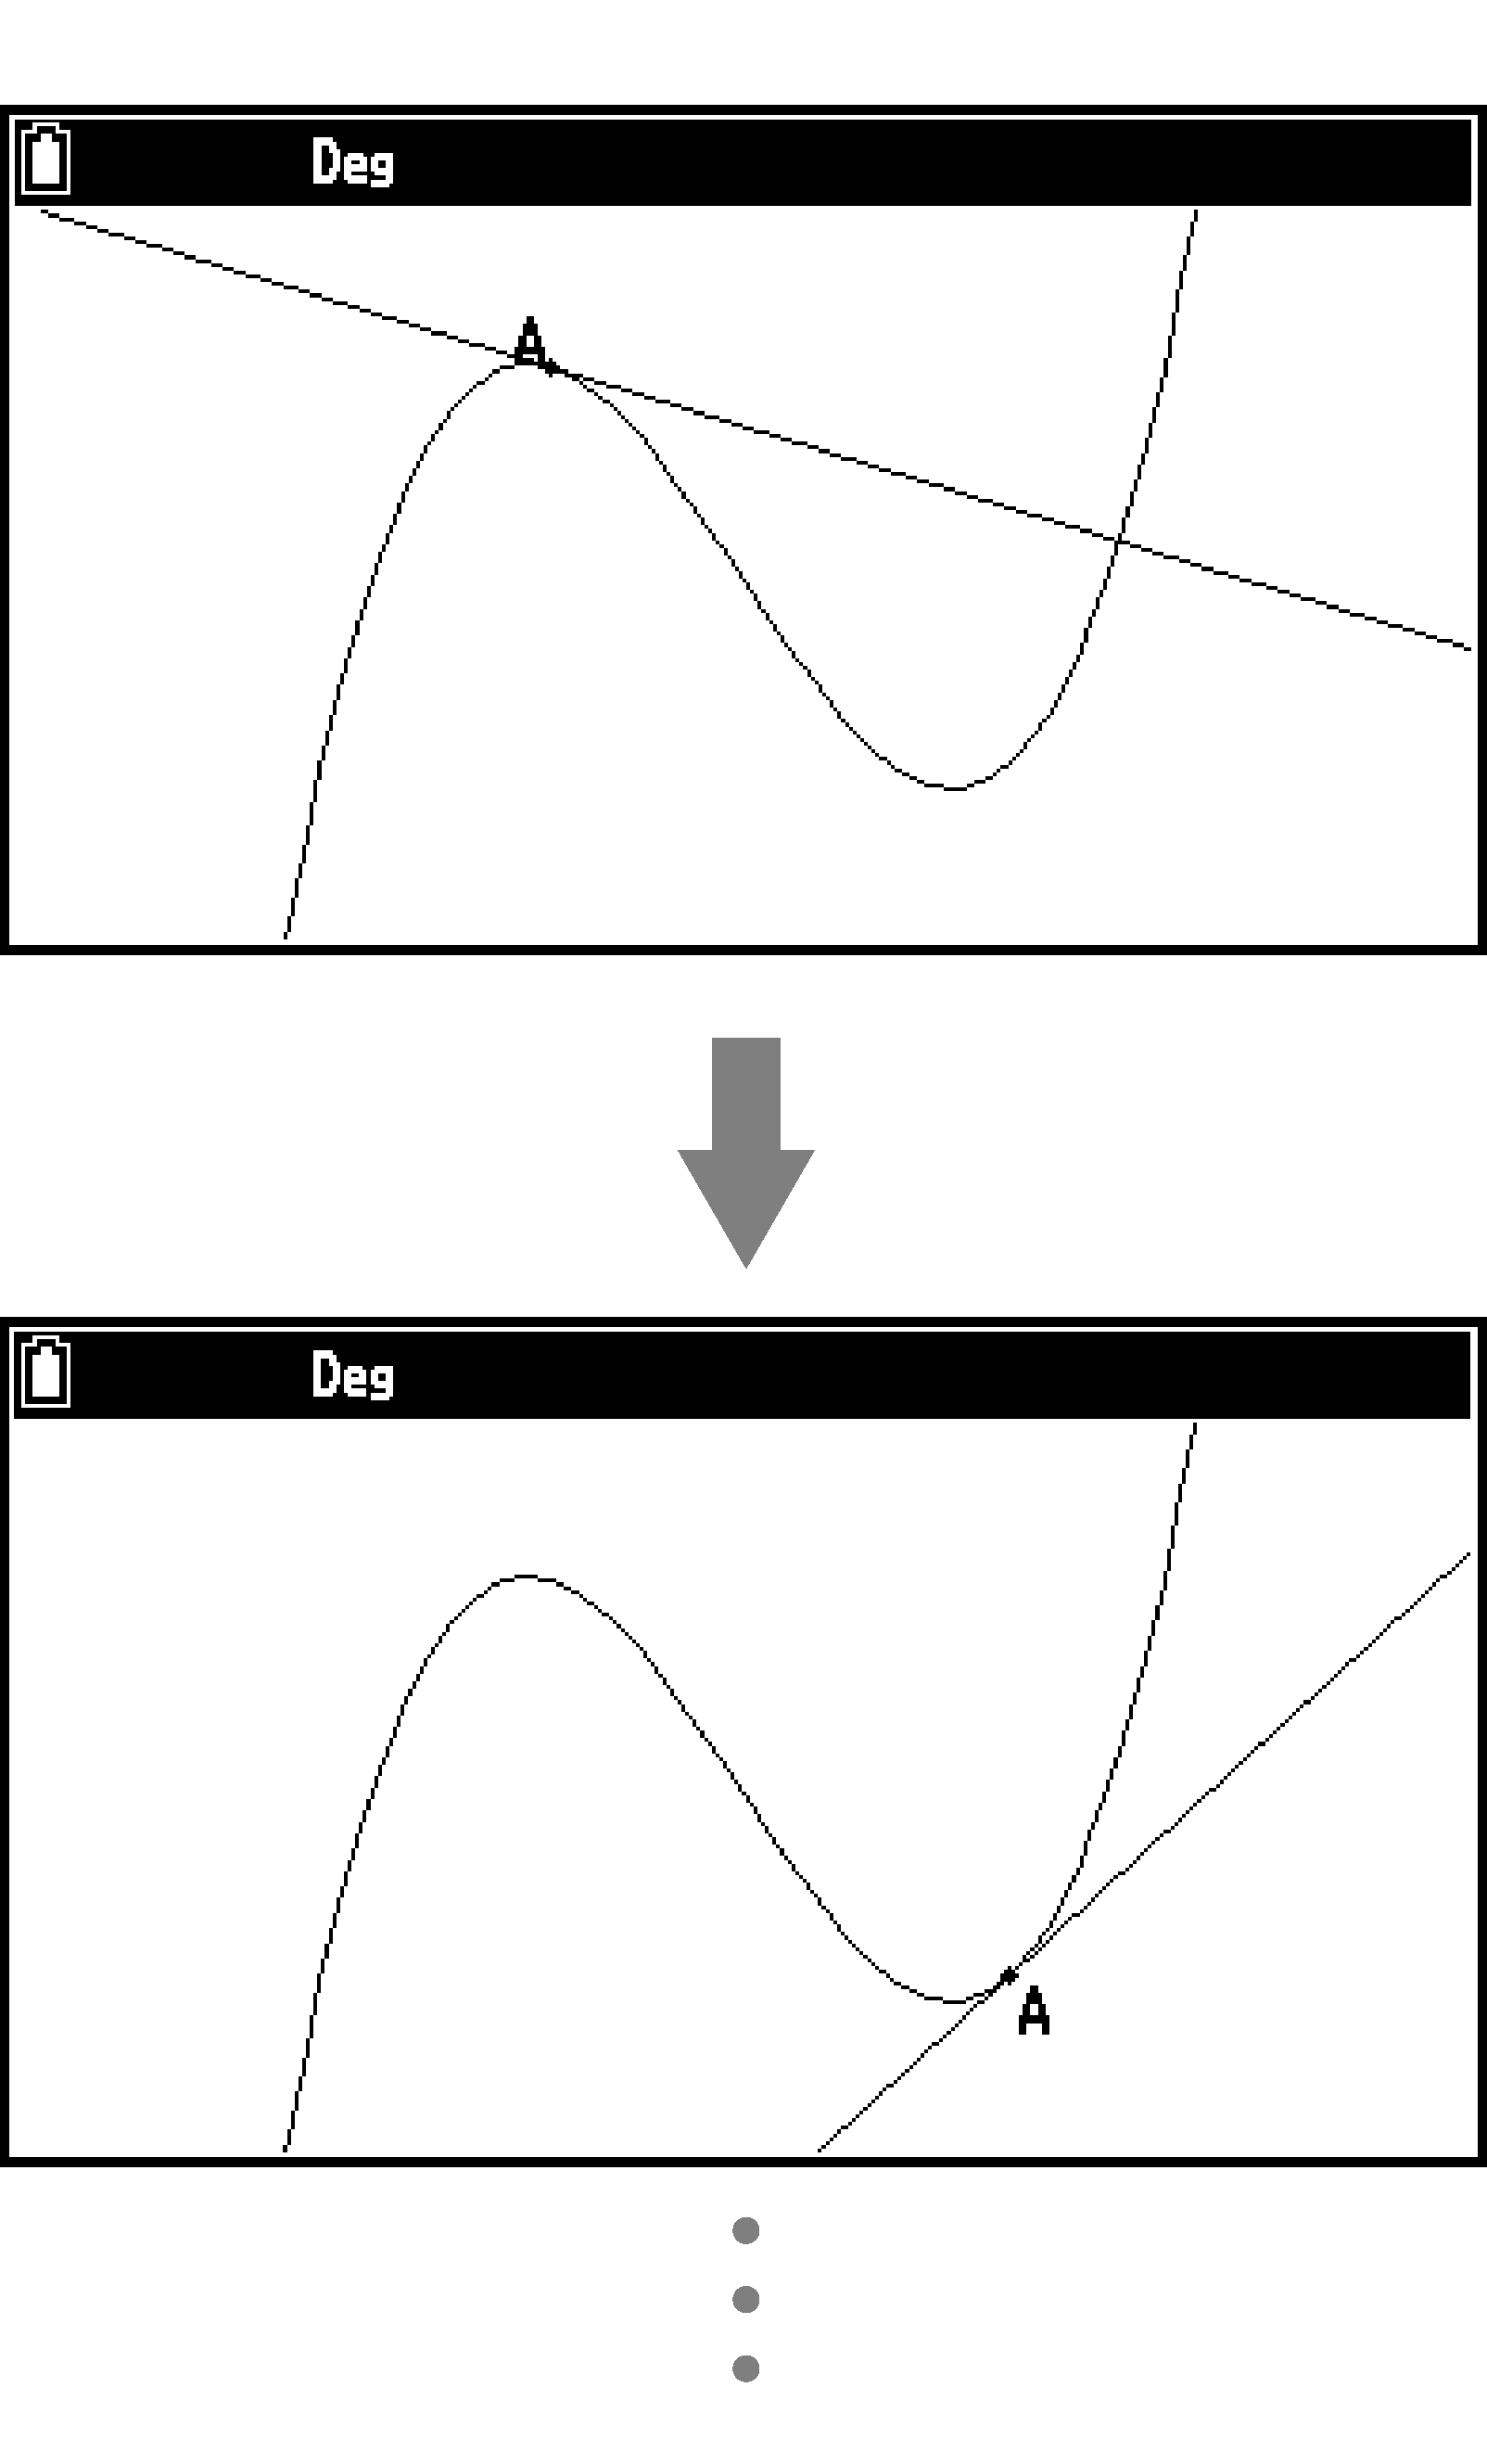
Example 2: To graph the cubic function and draw tangents to the graph. Next, create an animation to move the points of contact on the graph and observe the change in the tangent line.
-
Graph and draw tangents to the graph.
-
Select point A (contact point) and the graph.
-
Select T > [Animate] > [Add Animation].
-
To run the animation, select T > [Animate] > [Go(once)].
To draw the graph, use T > [Draw Special] > [Function f()].
To draw the tangent line, use T > [Construct] > [Tangent].
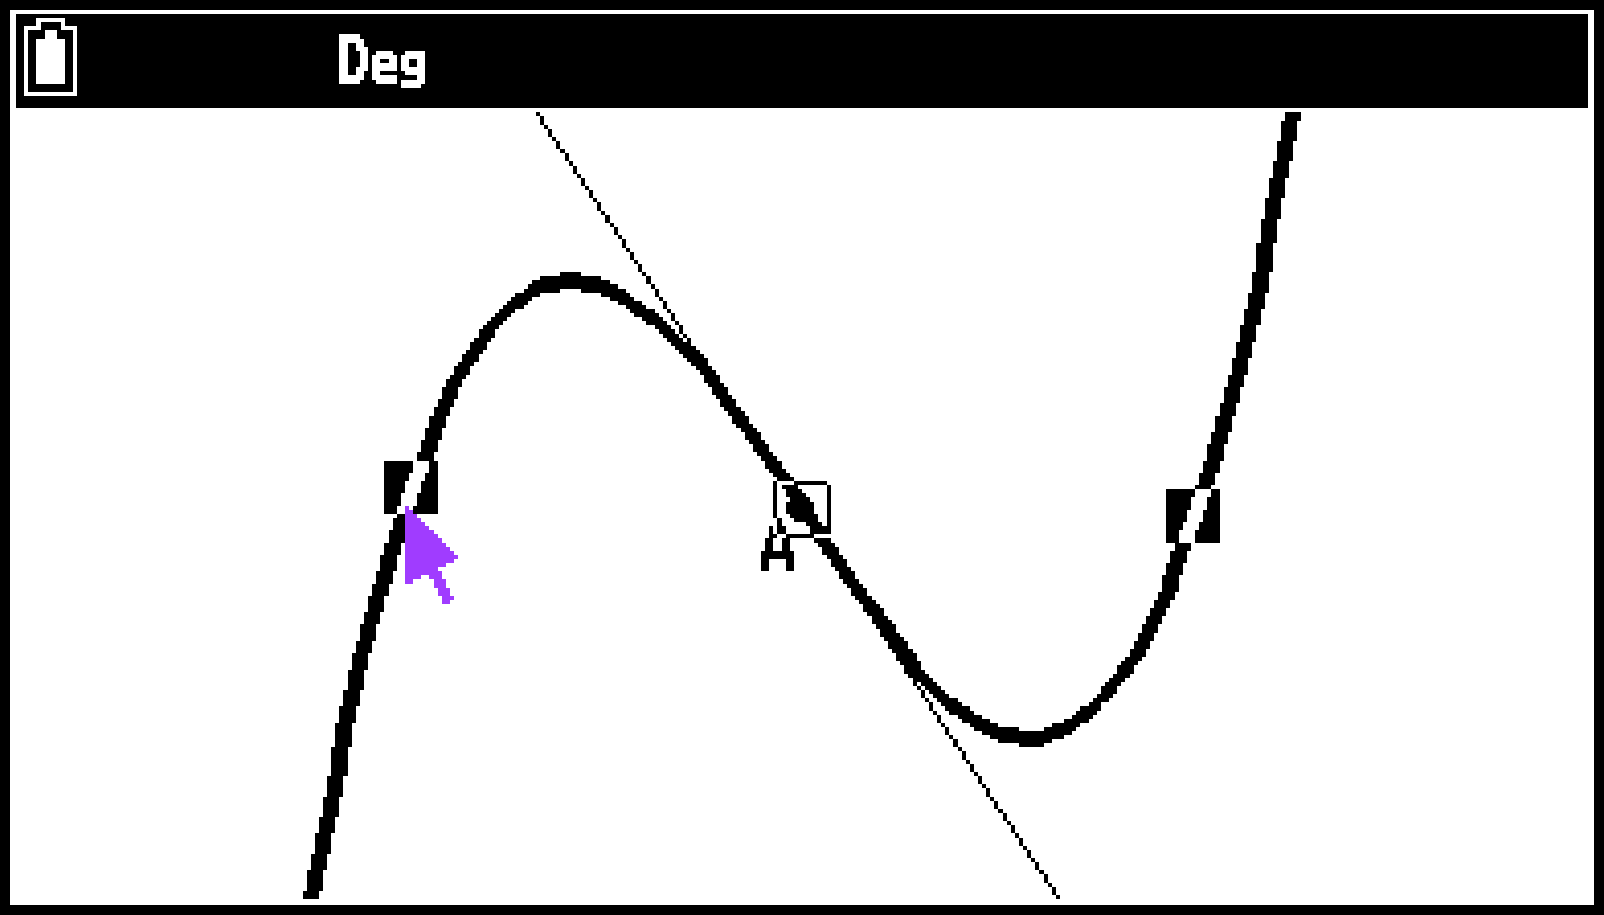
This causes point A (contact point) to move on the graph and the tangent line to move accordingly.
Note
While a point and curve are selected, selecting T > [Animate] > [Replace Animation] discards the current animations and sets up an animation for the new point and curve set.
The calculator’s auto power-off feature turns off power if an animation is being performed. If calculator power is turned off (either by auto power off or manually) while an animation is being performed, the animation is stopped.
To trace a locus of points
Example 1: To draw a parabola using Trace
-
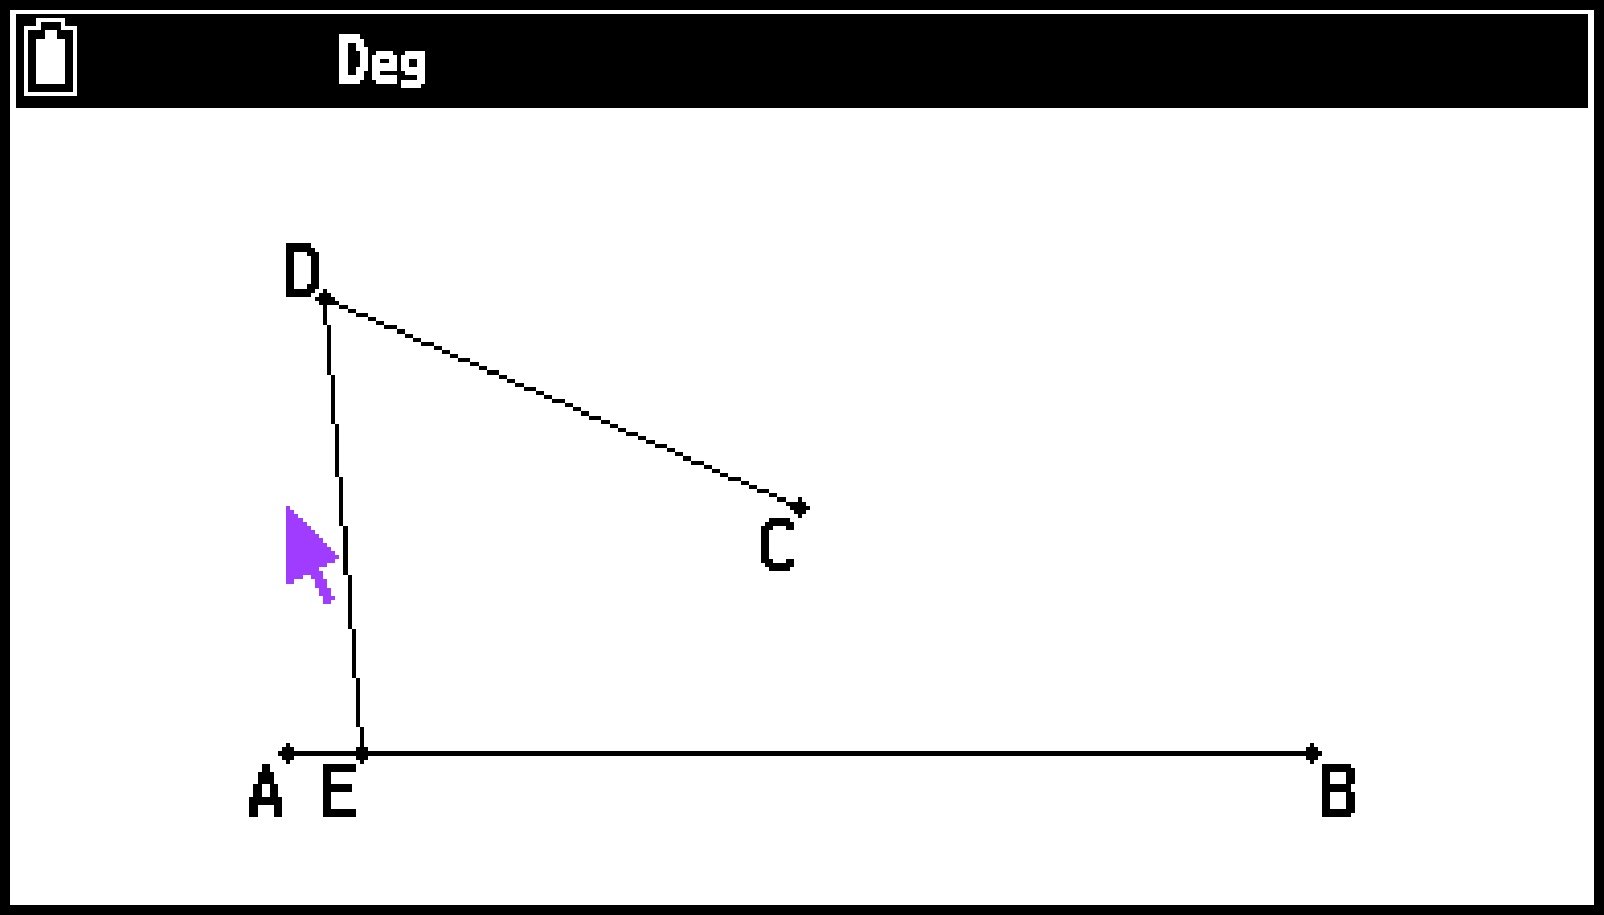
Use the steps below to draw the required line segments.
-
Draw three line segments AB, CD, DE as shown on the example screen to the right.
-
i) Select point C. ii) Display the measurement box. iii) Select the
 icon and lock the coordinates. iv) Close the measurement box.
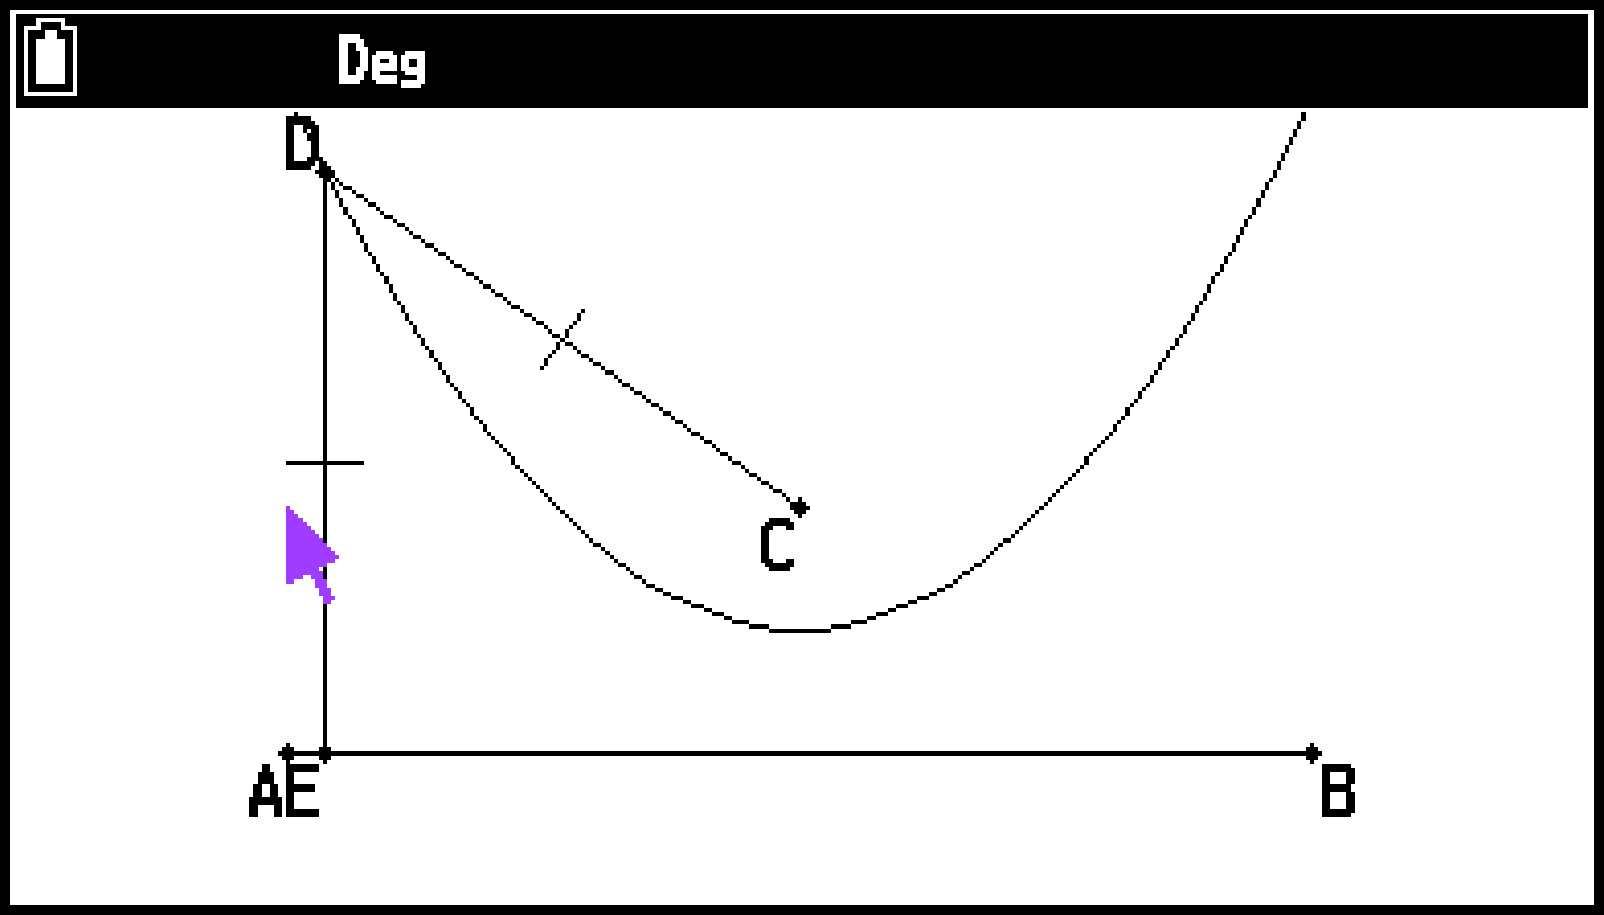
 -
i) Press a, and then select line segment AB and line segment DE. ii) Display the measurement box. iii) Select the
 icon and lock the angle between the two lines at 90 degrees. iv) Close the measurement box.
 -
i) Press a, and then select line segment DE and line segment CD. ii) Display the measurement box. iii) Select the
icon to lock the length of both segments to the same length. iv) Close the measurement box. -
Press a, select point E and line segment AB, and then select T > [Animate] > [Add Animation].
-
Press a, select point D, and then select T > [Animate] > [Trace].
-
Select T > [Animate] > [Go(once)].
When drawing line segment DE, locate point E on line segment AB.
For information about how to use the measurement box to lock objects in steps (2) through (4) below, see Locking or Unlocking a Measurement of an Object.
This specifies point D as the “trace point”.
This should cause a parabola to be traced on the display. Note that line segment AB is the directrix and point C is the focus of the parabola.
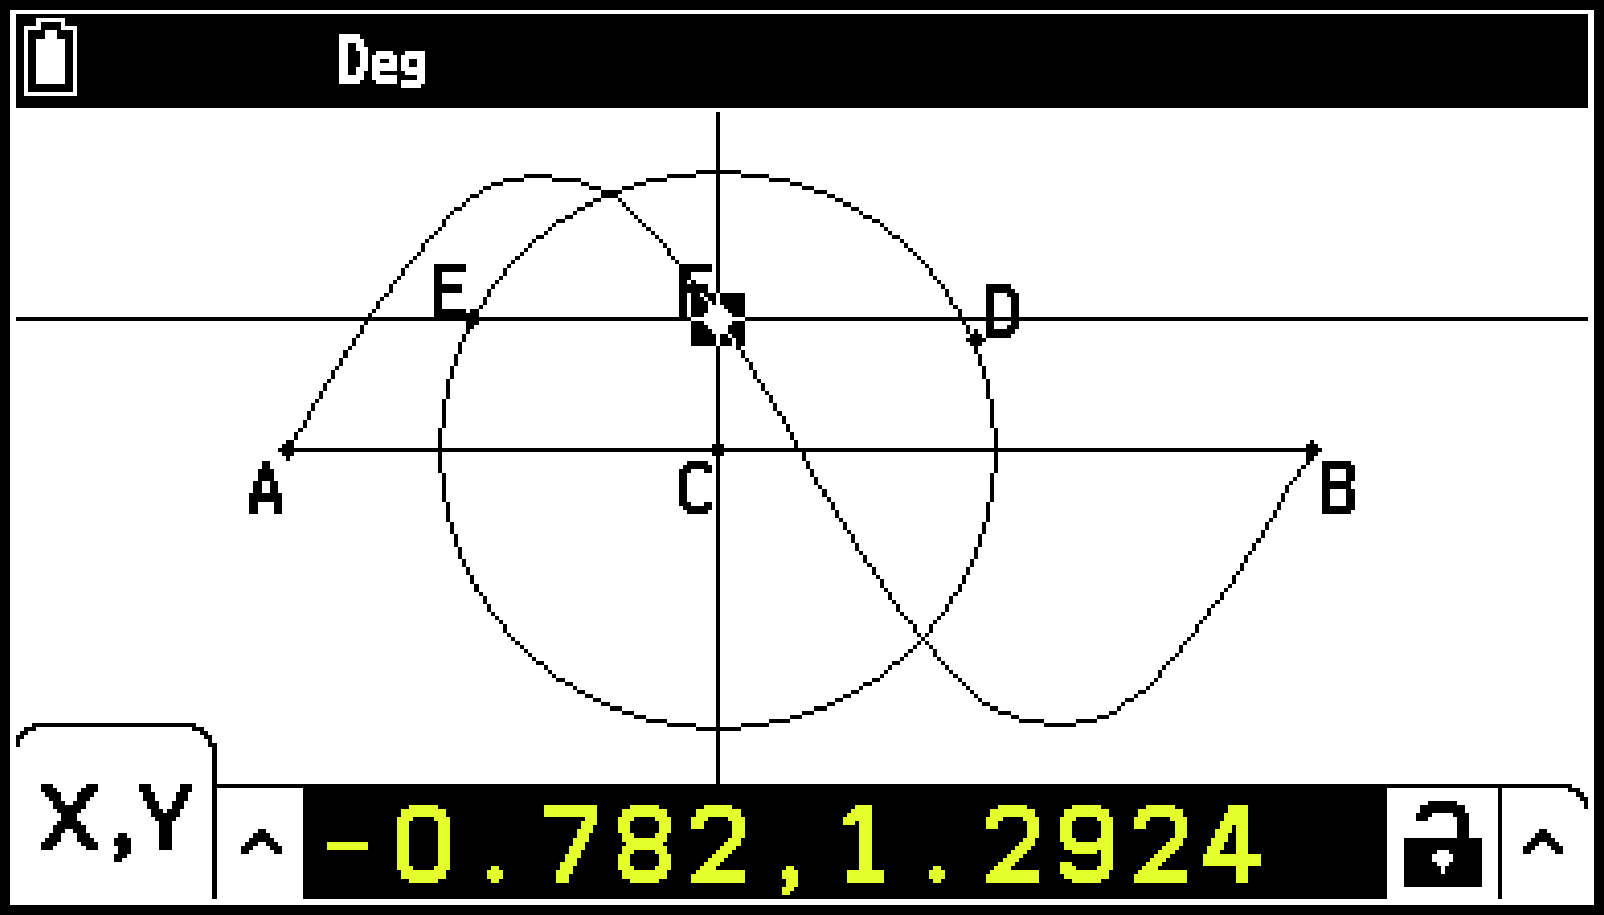
Example 2: To draw a sine curve using Trace
-
Use the steps below to draw a figure.
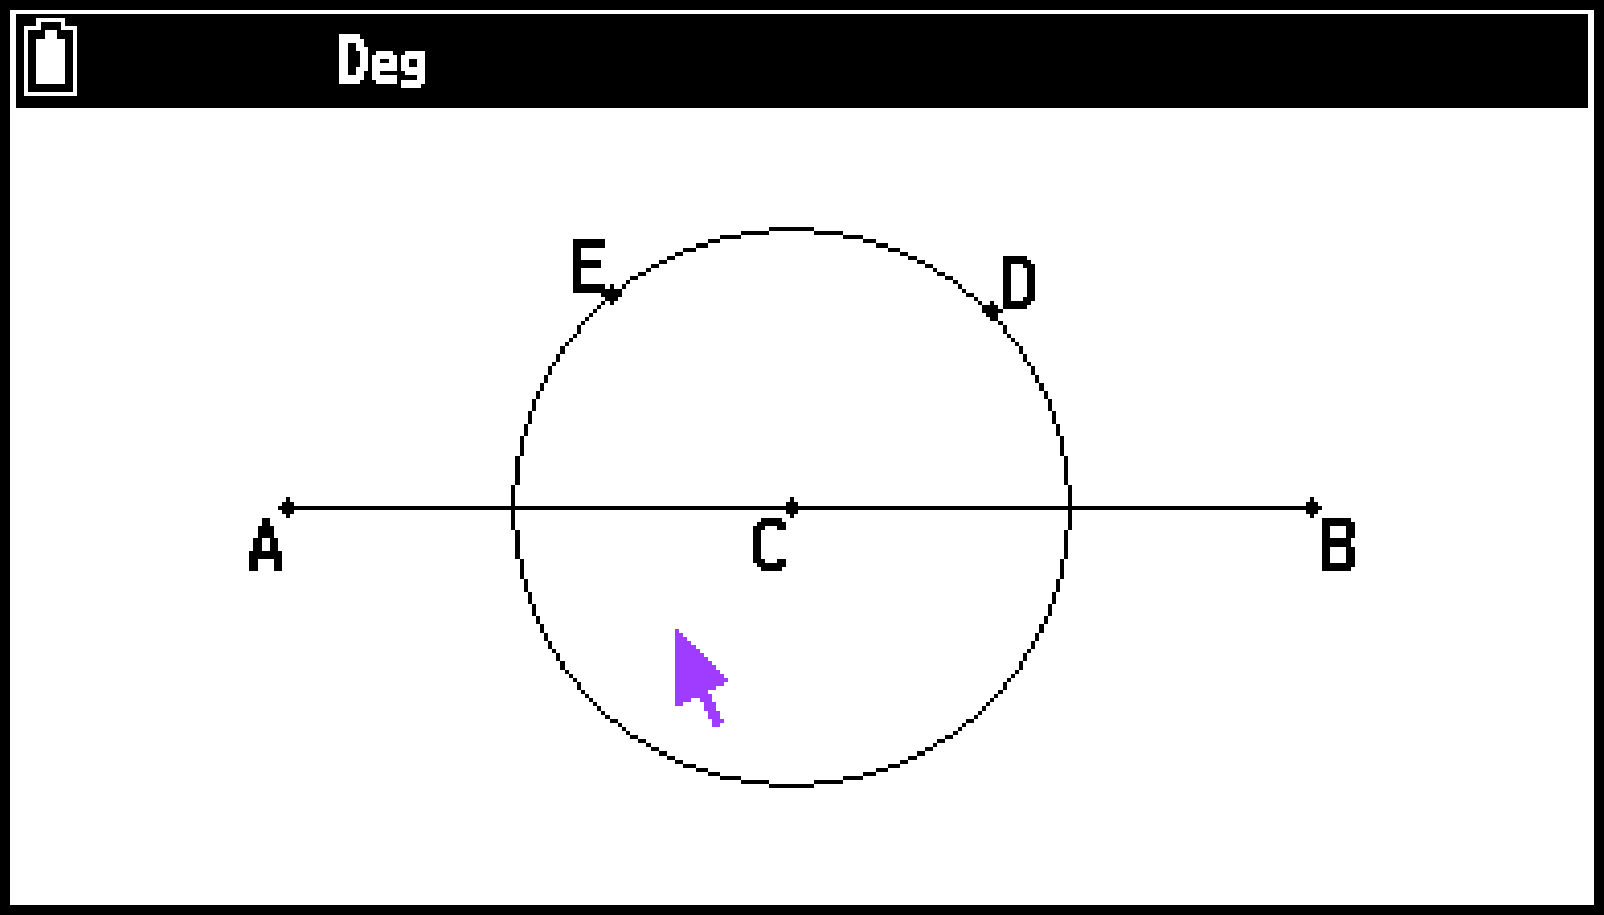
-
Draw line segment AB, a circle, and point E as shown on the example screen to the right.
-
Select the circumference of the circle, and then displays the measurement box.
-
Select the
 icon and lock the length of the radius.
 -
Close the measurement box.
-
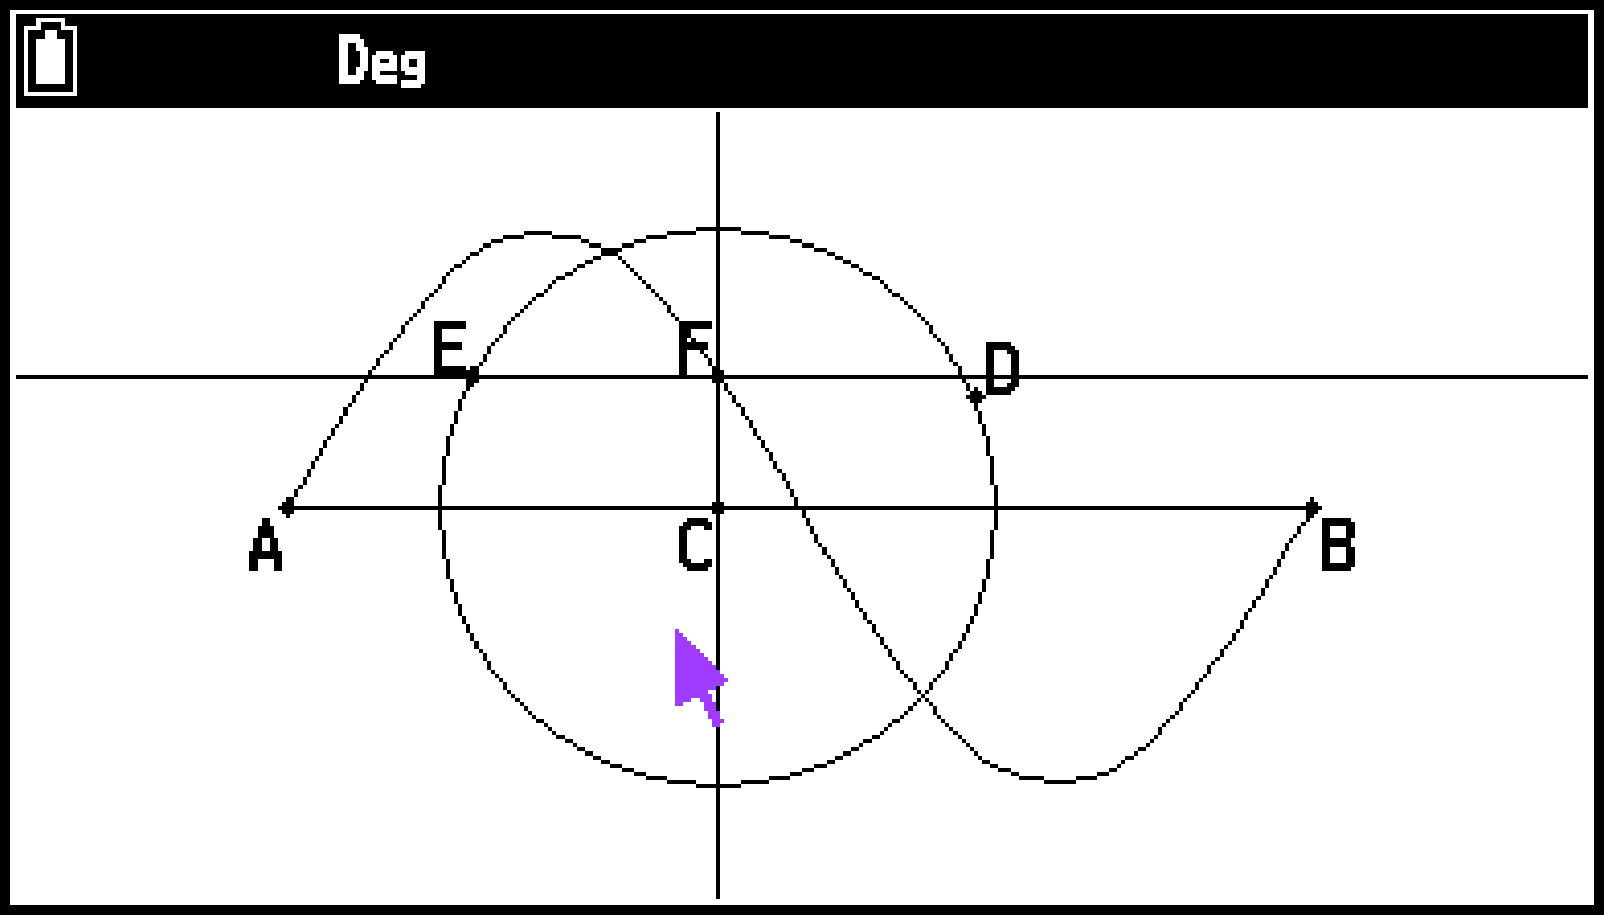
Draw a line that is perpendicular to line segment AB and passes through point C.
-
Draw a line that is perpendicular to the line you drew in step (3) and passes through point E.
-
Draw two perpendicular lines that intersect at point F.
-
Select point C and line segment AB, and then select T > [Animate] > [Add Animation].
-
Press a, select point E and the circumference of the circle, and then select T > [Animate] > [Add Animation].
-
Press a, select point F, and then select T > [Animate] > [Trace].
-
Select T > [Animate] > [Go(once)].
Locate the center of the circle (point C) on line segment AB.
Draw point E on the circumference of the circle.
For information about how to use the measurement box to lock objects in steps (2) through (4) below, see Locking or Unlocking a Measurement of an Object.
For information about how to draw perpendicular lines and intersections in steps (5) through (7), see Using the Construct Menu.
The screen to the right shows what the screen should look like following steps (5) through (7) are complete.

This specifies point F as the “trace point”.
This should cause a sine curve to be traced on the display.
Note
All of the points that are currently selected on the screen become trace points when you select T > [Animate] > [Trace].
Specifying a new trace point causes all currently specified trace points to be discarded.
Any traces drawn using Trace are cleared each time an animation is run.
Traces drawn using Trace can be selected and deleted, but they cannot be moved.
To edit an animation
The steps below continue from the procedure of Example 1 under To trace a locus of points.
-
While the animation you want to edit is on the screen, select T > [Animate] > [Edit Animation].
-
Edit the animation following the procedure below.
-
After all the settings are the way you want, press b.
This displays the Edit Animations screen.
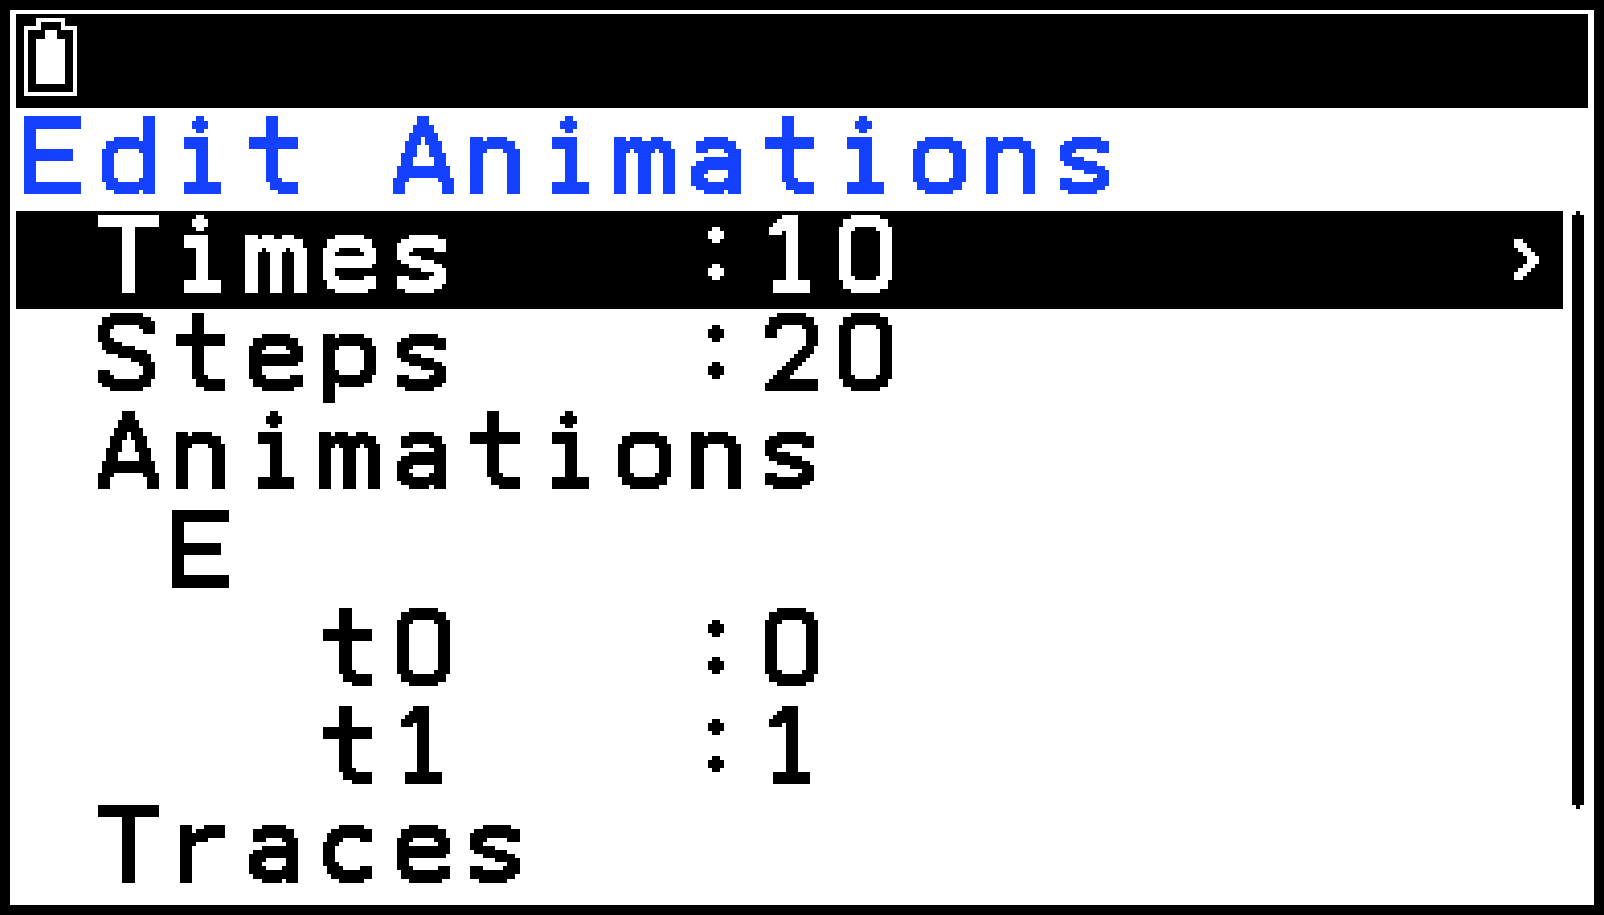
Times:
This setting specifies how many times the animation should be executed when you select T > [Animate] > [Go(repeat)]. The initial default value is 10, which can be changed to a value from 0 to 20. Inputting 0 here causes the animation to repeat until you press b or a to stop it.
Steps:
This setting specifies how many steps point E takes to move line segment AB. The initial default value is 20, which can be changed to a value from 2 to 100.
Animations:
The “E” under “Animations” indicates that point E is the point moved by the animation. When you are building multiple animations, a list of all applicable points appears here. Selecting T > [Delete] while a letter is highlighted deletes the applicable animation. Selecting T > [Delete] while “Animations” is highlighted deletes all the animations.
“t0” and “t1” specify the range of movement of point E on line segment AB. The initial default values are t0 = 0 and t1 = 1. During animation, the length of AB is considered to be one unit. The default values specify that movement of point E is from start point A (point where length equals 0) up to end point B (point where length equals 1). You can input a number from -10 to 10 for t0 and t1.
Changing the value of t0 to 0.5 causes point E to move from the middle of line segment AB to point B. Changing the value of t0 to -1 causes point E to begin at a point outside line segment AB (in this case, the distance from point A to point E equals the length of line AB) and end with point B. Changing the values to t0 = 1, t1 = 0 causes point E to move from point B to point A.
Traces:
This item shows the specified trace point. Selecting T > [Delete] while a letter is highlighted cancels the applicable trace point setting. Selecting T > [Delete] while “Traces” is highlighted cancels all the trace point settings.
Generating an Animation Table
Under default settings, an animation causes a specified point to move along a specified line segment, circle, arc, or function in 20 steps. You can configure the calculator to generate a table, called an “animation table”, which records the coordinates of each step, the length of the line segment, the area of the object, etc.
Any of the following data can be added to the animation table: coordinates (, ), distance/length, slope, radius, circumference, perimeter, area, angle, supplementary angle, vector segments (, ), and expression.
You can also select a single column of the animation table and save it as a list, or save the entire animation table as spreadsheet data. The saved data can then be used for analysis with the Statistics app or the Spreadsheet app.
To add columns to the animation table
The steps below continue from the procedure of Example 2 under To trace a locus of points. First, the coordinates of point F are added to the animation table. Then the angles of line segments EC and AB connecting point E and point C are added to the animation table.
-
Here we will generate an animation table for the coordinates (, ) of point F, so first select point F.
-
Press V to display the measurement box.*1
-
Use r to highlight the up arrow button on the right side of the measurement box and then press O.
-
On the menu that appears, select [Add Table] and then press O.
-
Press b to close the animation table screen.
-
Press b twice to make the drawing screen active.
-
Press a, and then draw a line segment that connects point E and point C (line segment CE).
-
Select line segments CE and AB, and then press V.*1
-
Perform steps 3 through 4 above.
-
To exit the animation table screen, press b.
If the ![]() (coordinates) icon does not appear on the left edge of the screen, highlight the up arrow to the left of the measurement box and then press O. On the icon palette that appears, select the
(coordinates) icon does not appear on the left edge of the screen, highlight the up arrow to the left of the measurement box and then press O. On the icon palette that appears, select the ![]() icon.
icon.
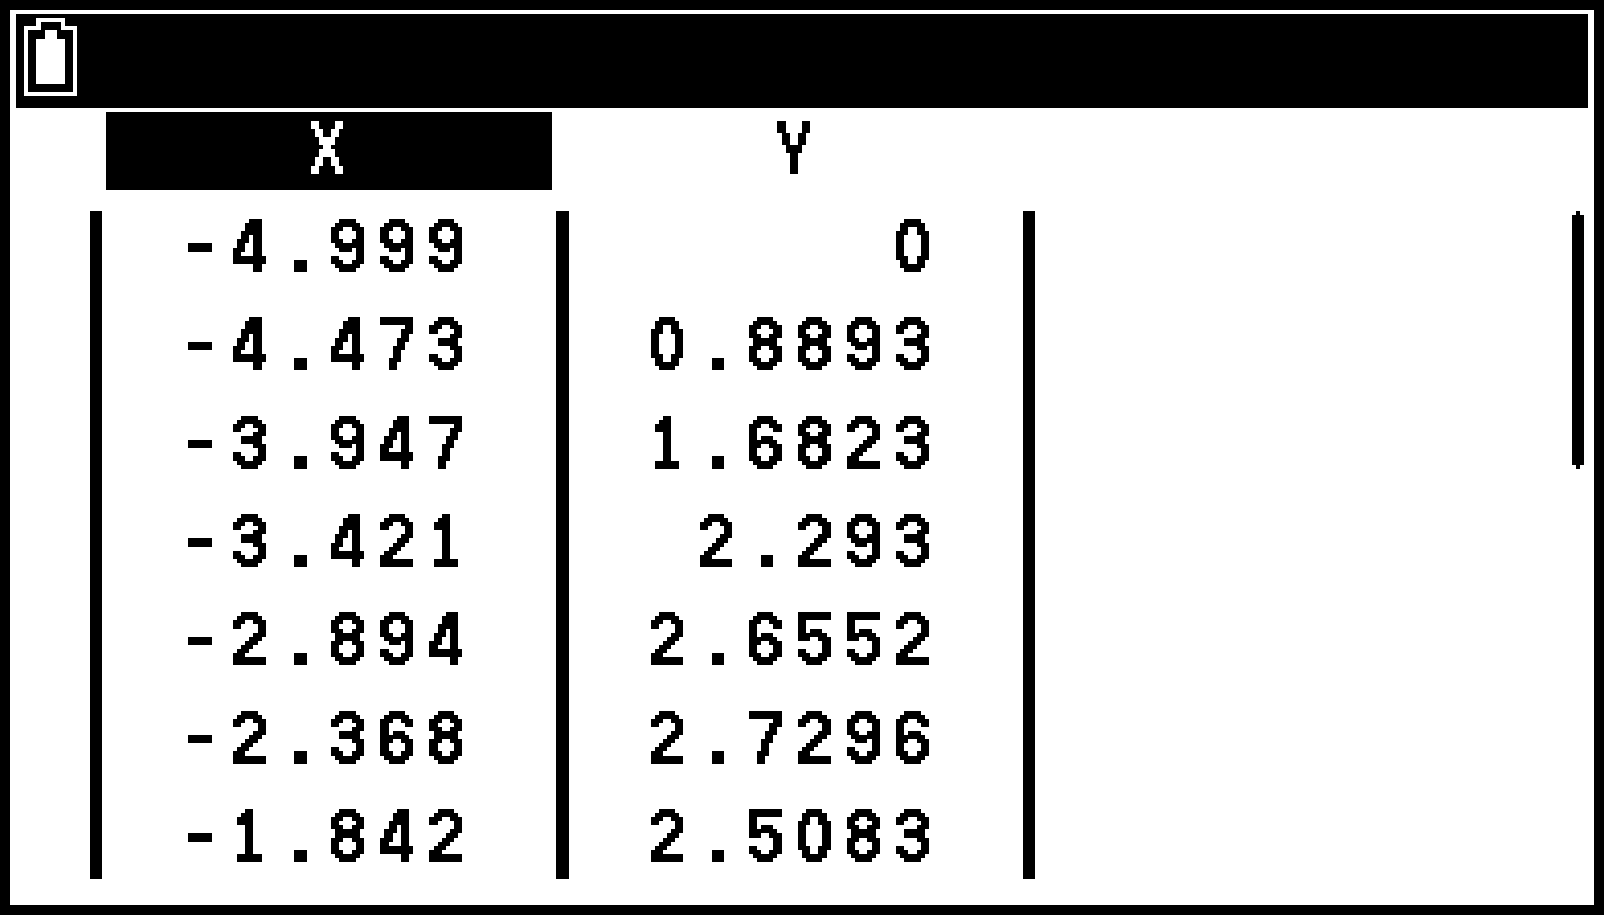
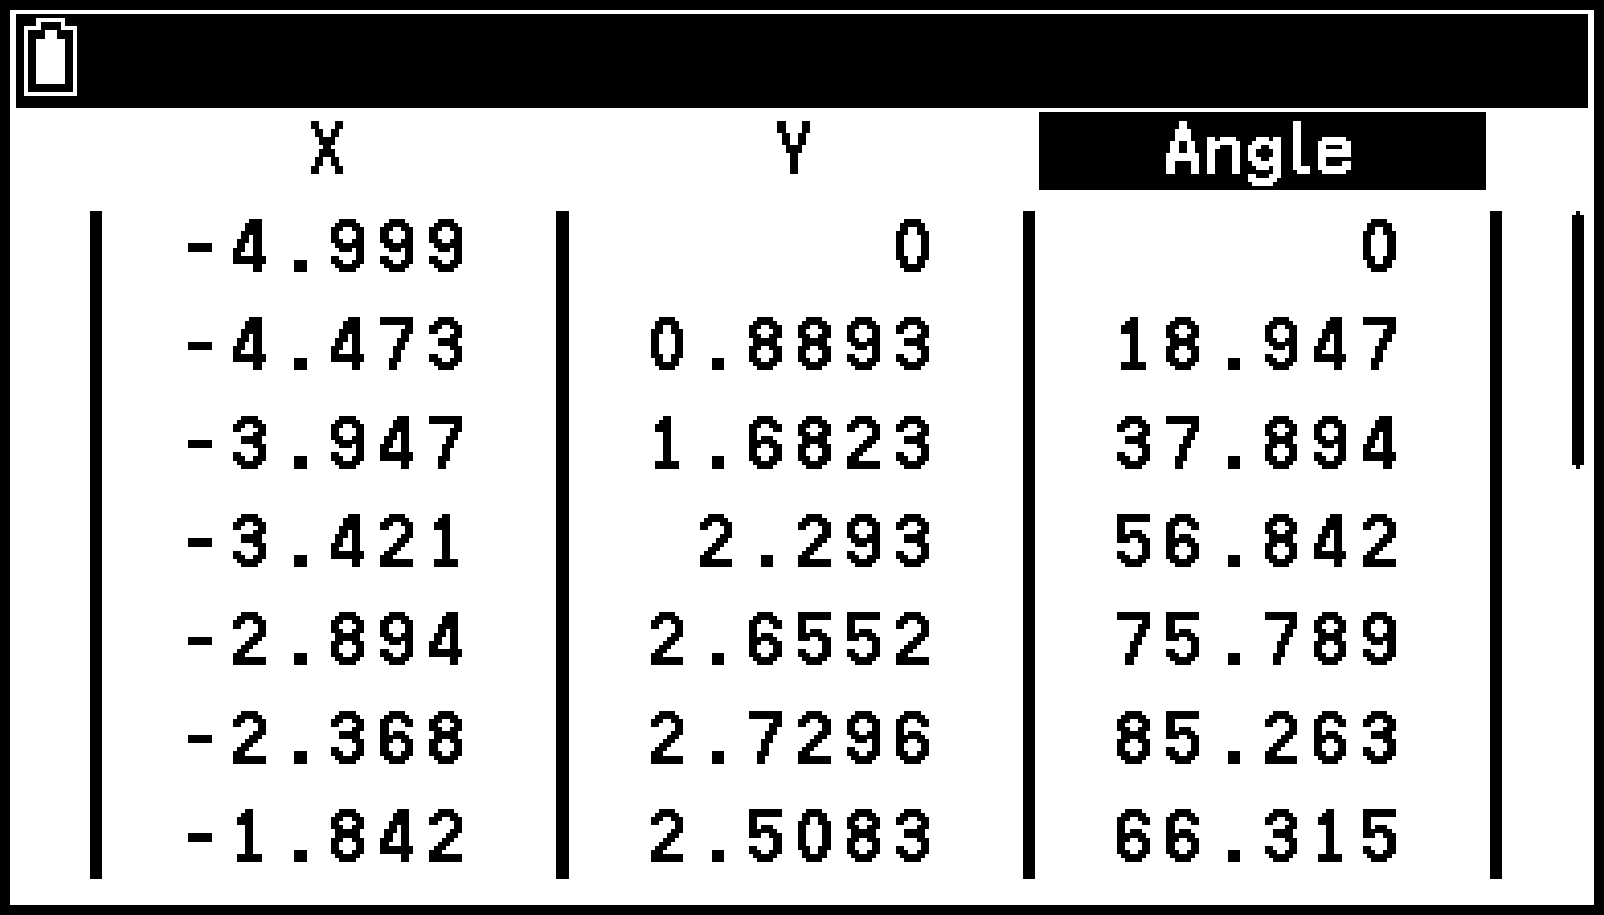
This displays an animation table that shows the coordinates of point F at each step of the animation in columns labeled “X” and “Y”.
If the ![]() (angle) icon does not appear on the left edge of the screen, highlight the up arrow to the left of the measurement box and then press O. On the icon palette that appears, select the
(angle) icon does not appear on the left edge of the screen, highlight the up arrow to the left of the measurement box and then press O. On the icon palette that appears, select the ![]() icon.
icon.
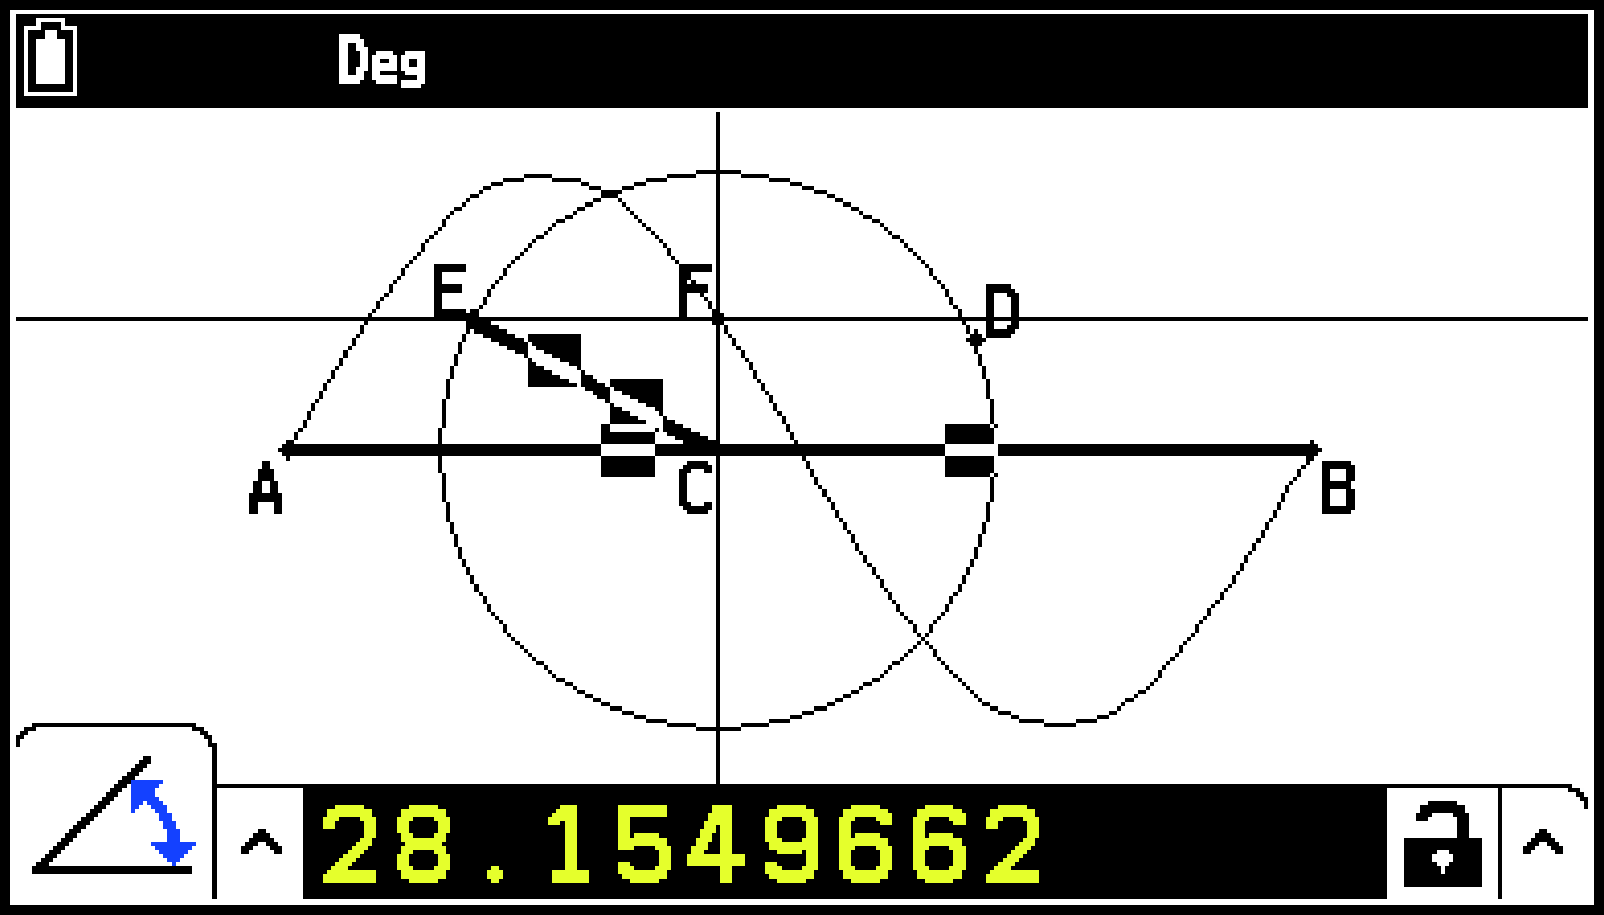
An “Angle” column is added to the right of the “X” and “Y” columns that were added in step 4, above.*2
Instead of using the measurement box, you can also add an animation table by selecting T > [Animate] > [Add Table]. However, this operation does not allow you to specify the type of measurement to be added to the table. The first measurement that appears when the measurement box is displayed is added.
When angle and supplementary angle are added to the animation table, the angle unit follows the setting of S > [Angle] that is in effect at the time of addition. Changing the S > [Angle] setting does not affect the values in the animation table that are already added.
Note
You can add up to 26 columns to an animation table.
Animation table contents are cleared whenever one of the operations below is performed.
Using the Edit Animations screen to change an animation
Adding or replacing an animation
Specifying a new trace point
Deleting a geometric element (line segment, point, etc.) used in an animation
Launching an application other than the Geometry app
To display the animation table
To display the animation table you generated with the procedure under To add columns to the animation table, select T > [Animate] > [Display Table].
To save an animation table column to a list
-
Display the animation table.
-
Use l and r to highlight the column you want to save as list data.
-
Select T > [Store] > [List].
-
Use the dialog that appears to input a list number and then press O.
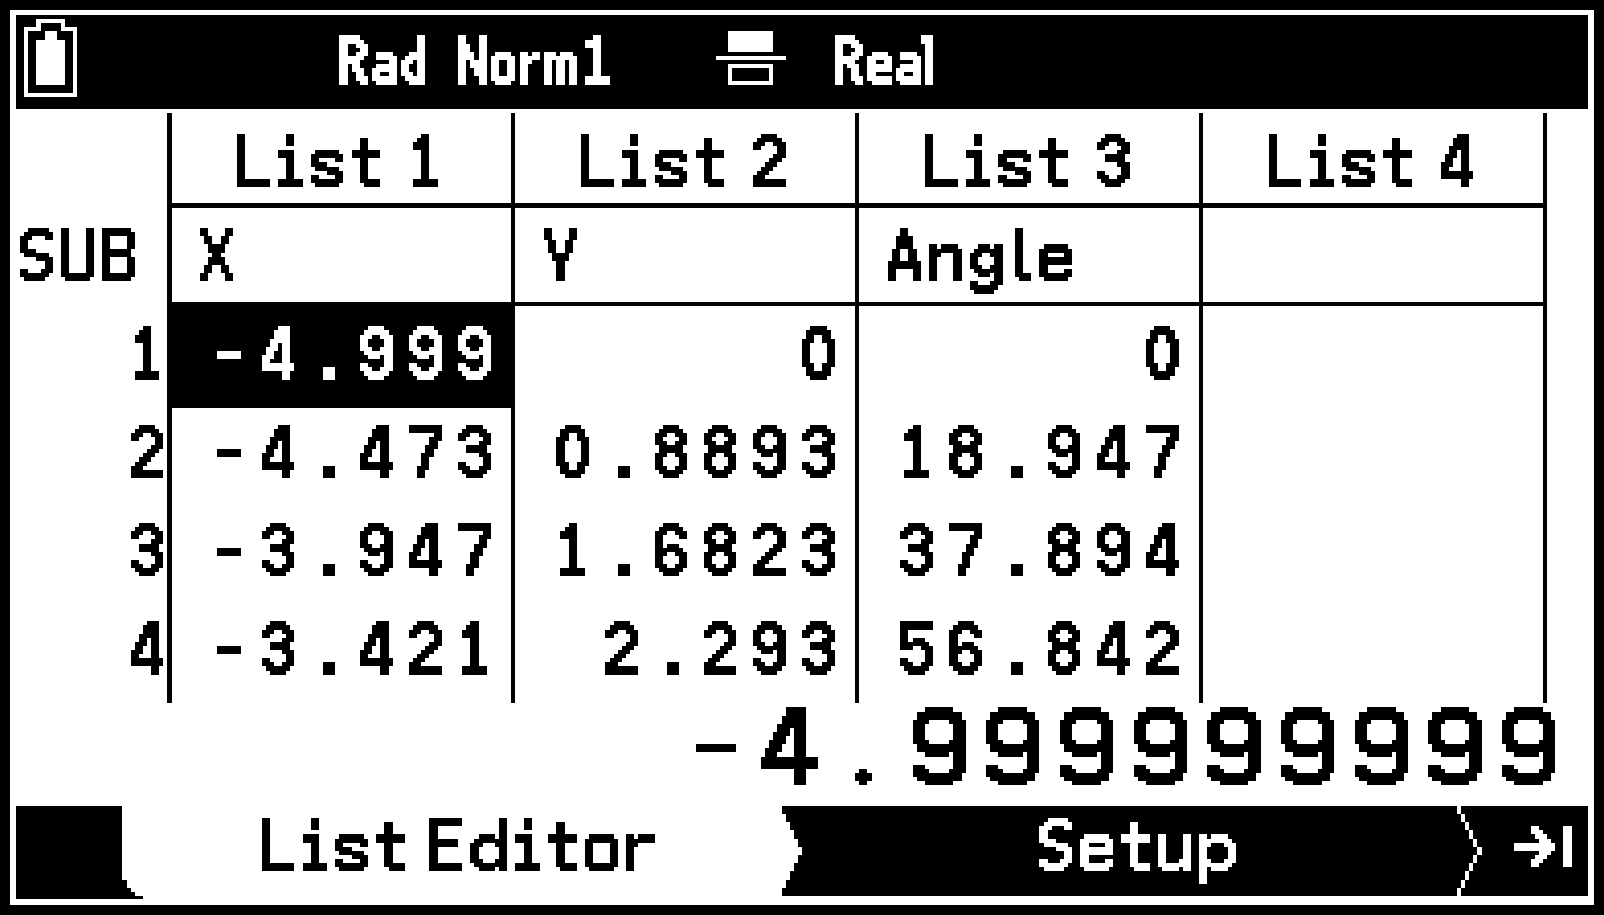
Note
The lists saved during the above operation can be viewed using the Statistics app’s List Editor. For example, following step 9 of the procedure under To add columns to the animation table, you can save each column of the animation table to a list from List 1 to List 3, and then launch the Statistics app to view a list as shown on the example screen to the right.
To save an entire animation table as a spreadsheet file
-
Display the animation table.
-
Select T > [Store] > [Spreadsheet].
-
Use the dialog that appears to input up to eight characters for the file name and then press O.
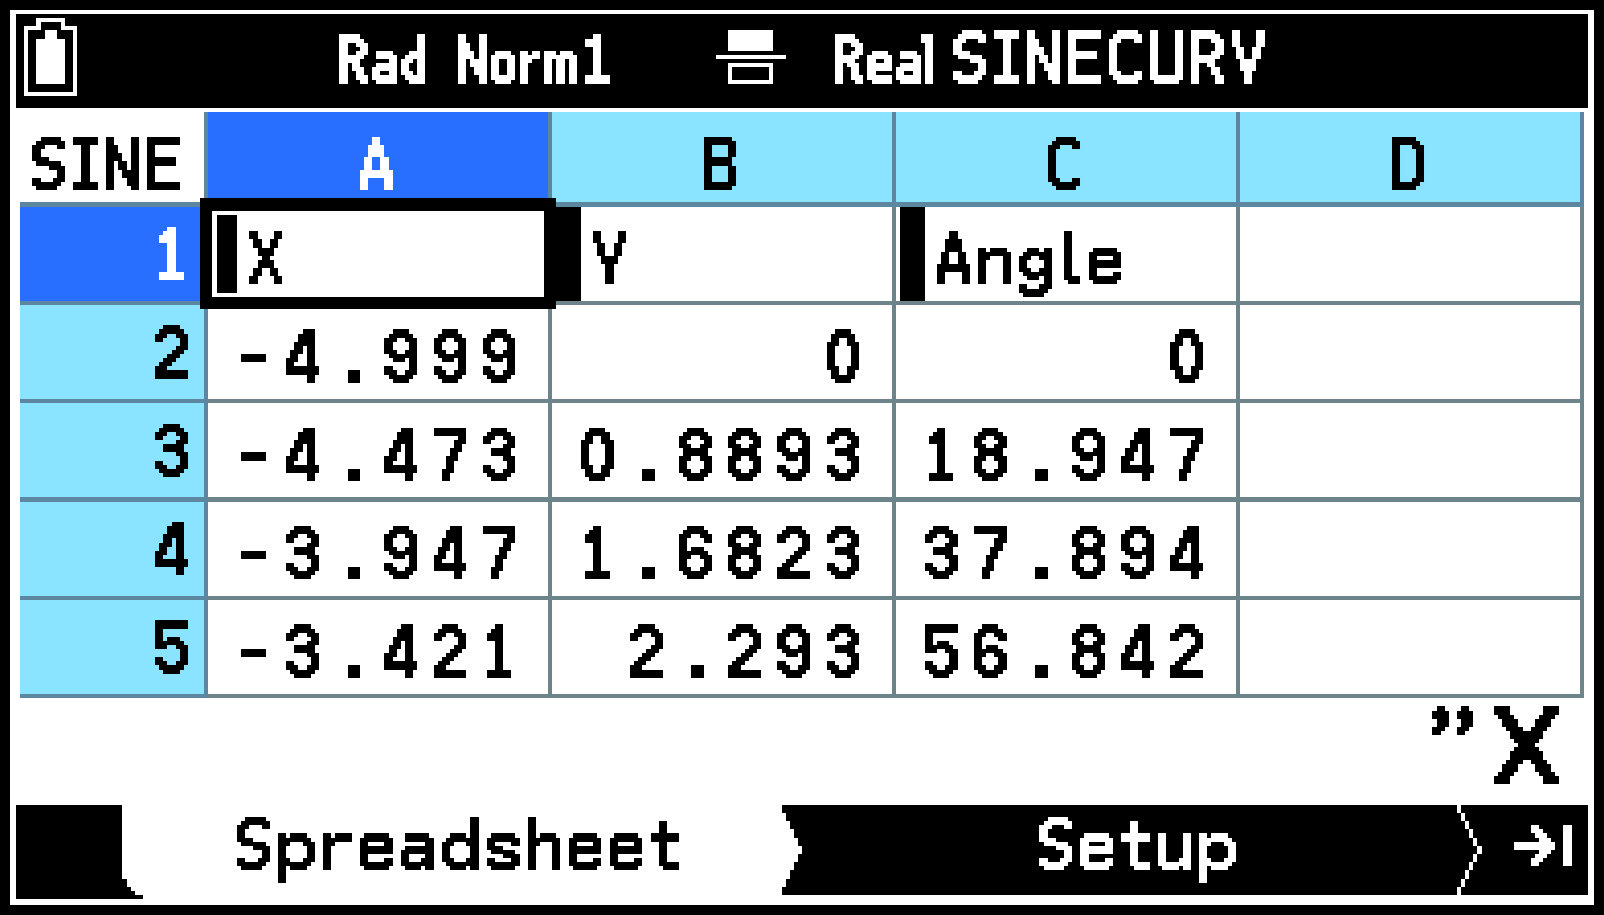
Note
The spreadsheet file saved by the above operation opens automatically the next time you start up the Spreadsheet app. For example, if you save the animation table to a spreadsheet file following step 9 of To add columns to the animation table, starting up the Spreadsheet app displays the table as shown on the example screen to the right.
To delete a particular column from an animation table
-
Display the animation table.
-
Use l and r to highlight the column you want to delete.
-
Select T > [Delete] > [Delete].
To delete all of the columns from an animation table
-
Display the animation table.
-
Select T > [Delete] > [Delete All].
-
In response to the confirmation dialog that appears, select [OK].
Using Key Help
Pressing the 0 key or selecting T > [Key Help] displays the Key Help window, which provides information about the function assigned to each key in the Geometry app. Note that the key operations shown on the Key Help window apply to the drawing screen only.
Geometry App Settings Menu Items
The Settings menu items described below are specific to the Geometry app.
|
S > [Angle Unit] … |
Specifies whether to include units when displaying angles for a figure on the drawing screen. |
|
S > [Length Unit] … |
Specifies whether to include units when displaying lengths for a figure on the drawing screen. |
|
S > [Grid Space] … |
Specifies the pitch (spacing) of the grid points and lines on the drawing screen. |