Python App
The Python app supports a version of MicroPython Version 1.9.4, which has been adapted to run on this calculator.
Important!
Note that generally, MicroPython is different from the Python that runs on a computer. Also, the Python app does not support all of the functions, commands, modules, and libraries of MicroPython.
The Python app performs executions using the MicroPython processing system. Because of this, calculation results and other data produced by this app may differ from execution results of other function apps.
Operation Flow
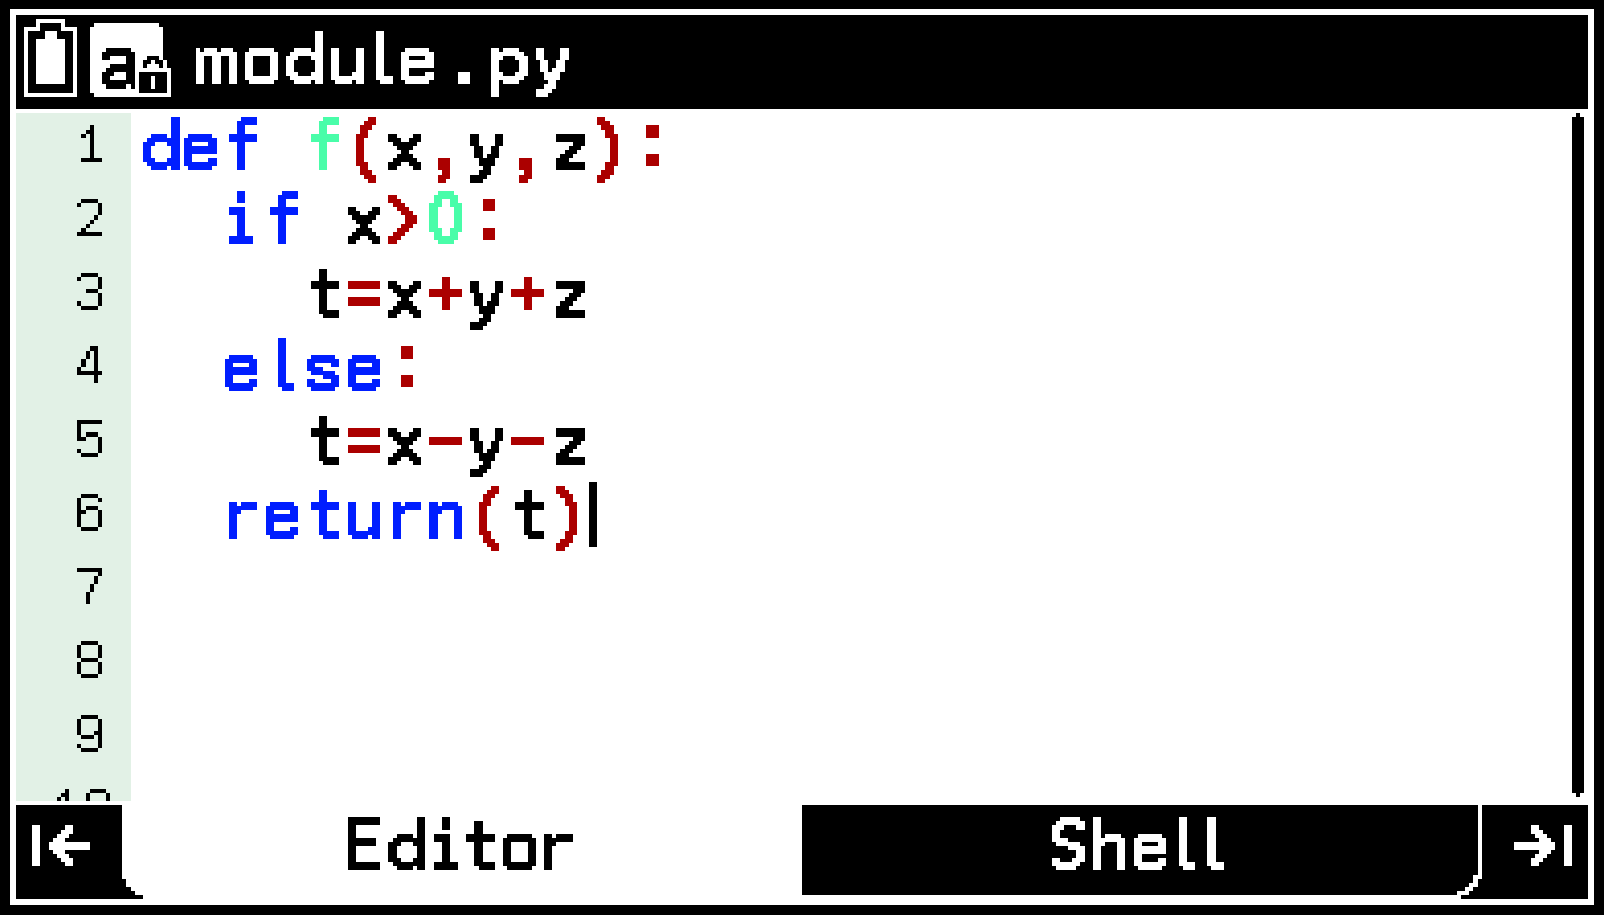
Example: To create the script shown below and then execute it
|
Input |
Meaning |
|---|---|
|
def f(x,y,z): if x>0: t=x+y+z else: t=x-y-z return(t) |
Defines a user-defined function with function name f, and arguments x, y, and z. If variable x is greater than 0, Defines variable t as the execution result of x+y+z. Otherwise (if variable x is 0 or less), Defines variable t as the execution result of x-y-z. Makes t the return value. |
-
h > Python
-
Input the script.
-
To execute the resulting script, press >.
-
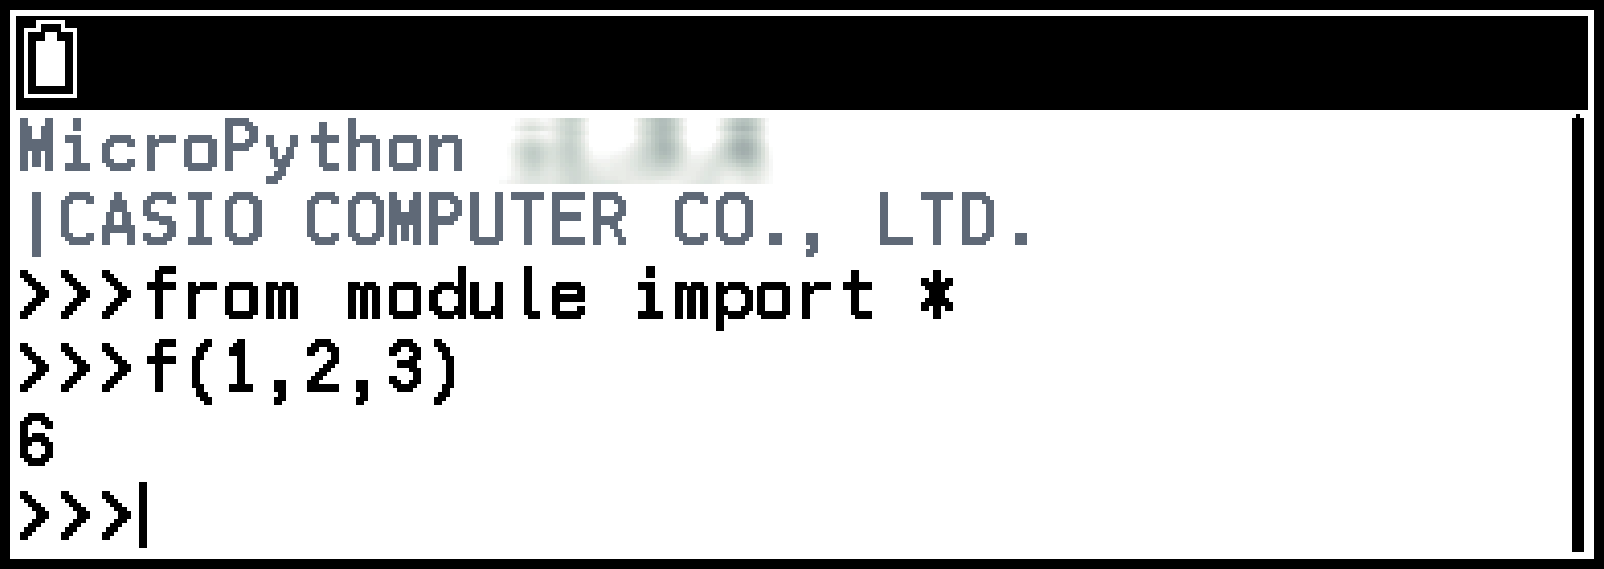
Call user-defined function f and then input 1, 2, 3 for arguments x, y, and z, respectively.
-
Press V to display the Variable menu.
-
Select f(,,) and then press O.
-
Input 1, 2, and 3 as f arguments.
-
Press E to execute f(1,2,3).
-
To return to Editor, press b.
This displays Editor and opens a py file named “module.py”.
For information about input operations, see App Alpha Character and Numeric Input and Input Operations (Same for Editor and Shell).
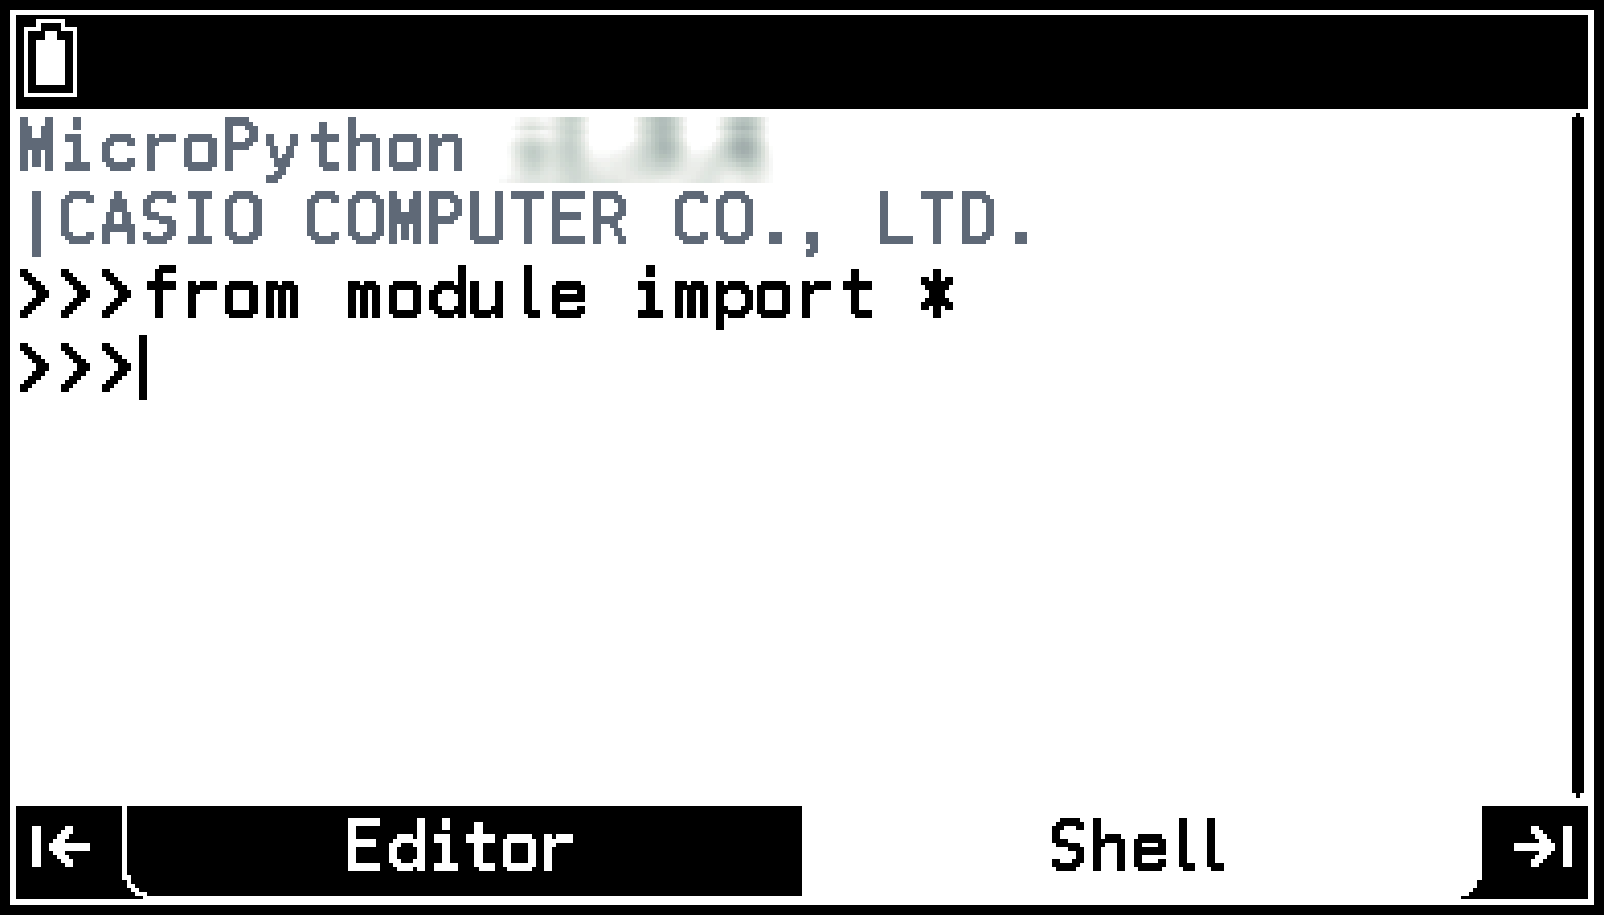
The imports module.py into Shell.
Since x>0, t=x+y+z (=1+2+3) is executed and a value of t=6 is returned.
Using Editor
The first thing you will see when you enter the Python app from the HOME screen is Editor. A py file named “module.py” will always open automatically immediately after you enter the Python app.
Creating and Editing Scripts
You can input your scripts directly into “module.py” or edit another py file by performing the operations below.
|
To do this: |
Select this menu item: |
|---|---|
|
Close the currently open file and create a new file |
T > [File] > [New] |
|
Close the currently open file and open another file |
T > [File] > [Open] |
|
Save the currently open file under a different name |
T > [File] > [Save As] |
The Python app lets you input up to 255 characters × 300 lines (text, functions, commands) for each file. For information about inputting text, functions, and commands into the Editor, see Input Operations (Same for Editor and Shell).
To toggle alpha lock on and off
Whenever you enter the Python app, the Editor alpha lock setting is lowercase characters, which is indicated by ![]() in the status bar. Press P to change the alpha lock setting to uppercase character input. This causes
in the status bar. Press P to change the alpha lock setting to uppercase character input. This causes ![]() to appear in the status bar. Press P again to unlock alpha lock.
to appear in the status bar. Press P again to unlock alpha lock.
To copy or cut scripts within Editor
-
Move the cursor to the start of the range that you want to copy or cut.
-
Press s0($).
-
Move the cursor to the end of the range of data you want to copy or cut.
-
Select [Copy] or [Cut] in the menu that appears when you press O.
This displays ![]() in the status bar until you press O in step 4.
in the status bar until you press O in step 4.
You can specify the end point first if you want.
To paste a copied or cut script within Editor
-
Move the input cursor to the location where you want to paste the script.
-
Press s.(%).
To move the cursor to a specified line
Select T > [Jump]. Use the dialog that appears to input a line number that specifies the move destination.
To save the currently open py file and overwrite its previous version
Select T > [File] > [Save].
To delete all scripts in Editor
Press a or select T > [Delete All].
To delete a py file
-
Select T > [File] > [Delete].
-
Use the file list that appears to select the file you want to delete and then press O.
-
In response to the confirmation dialog that appears, select [OK].
You cannot use this operation to delete a currently open file.
If you delete “module.py,” a new “module.py” file will be created automatically and opened the next time you start up the Python app.
Executing a Script
Use the operation below to execute the script that is currently displayed in Editor.
-
Press > (or <), or select T > [Run].
-
If the script (py file) has not been saved, use the dialog that appears to select an operation.
If the script (py file) has already been saved, this will go to Shell and execute the script.
|
To do this: |
Select this: |
|---|---|
|
Save a py file, go to Shell and execute a script |
[Yes] |
|
Go to Shell without saving the py file and execute a script |
[No] |
|
Return to Editor without executing the script |
[Cancel] |
Input Operations (Same for Editor and Shell)
To use the Character Select menu to input characters
Select T > [Character Select] to display a character list along the bottom of Editor.
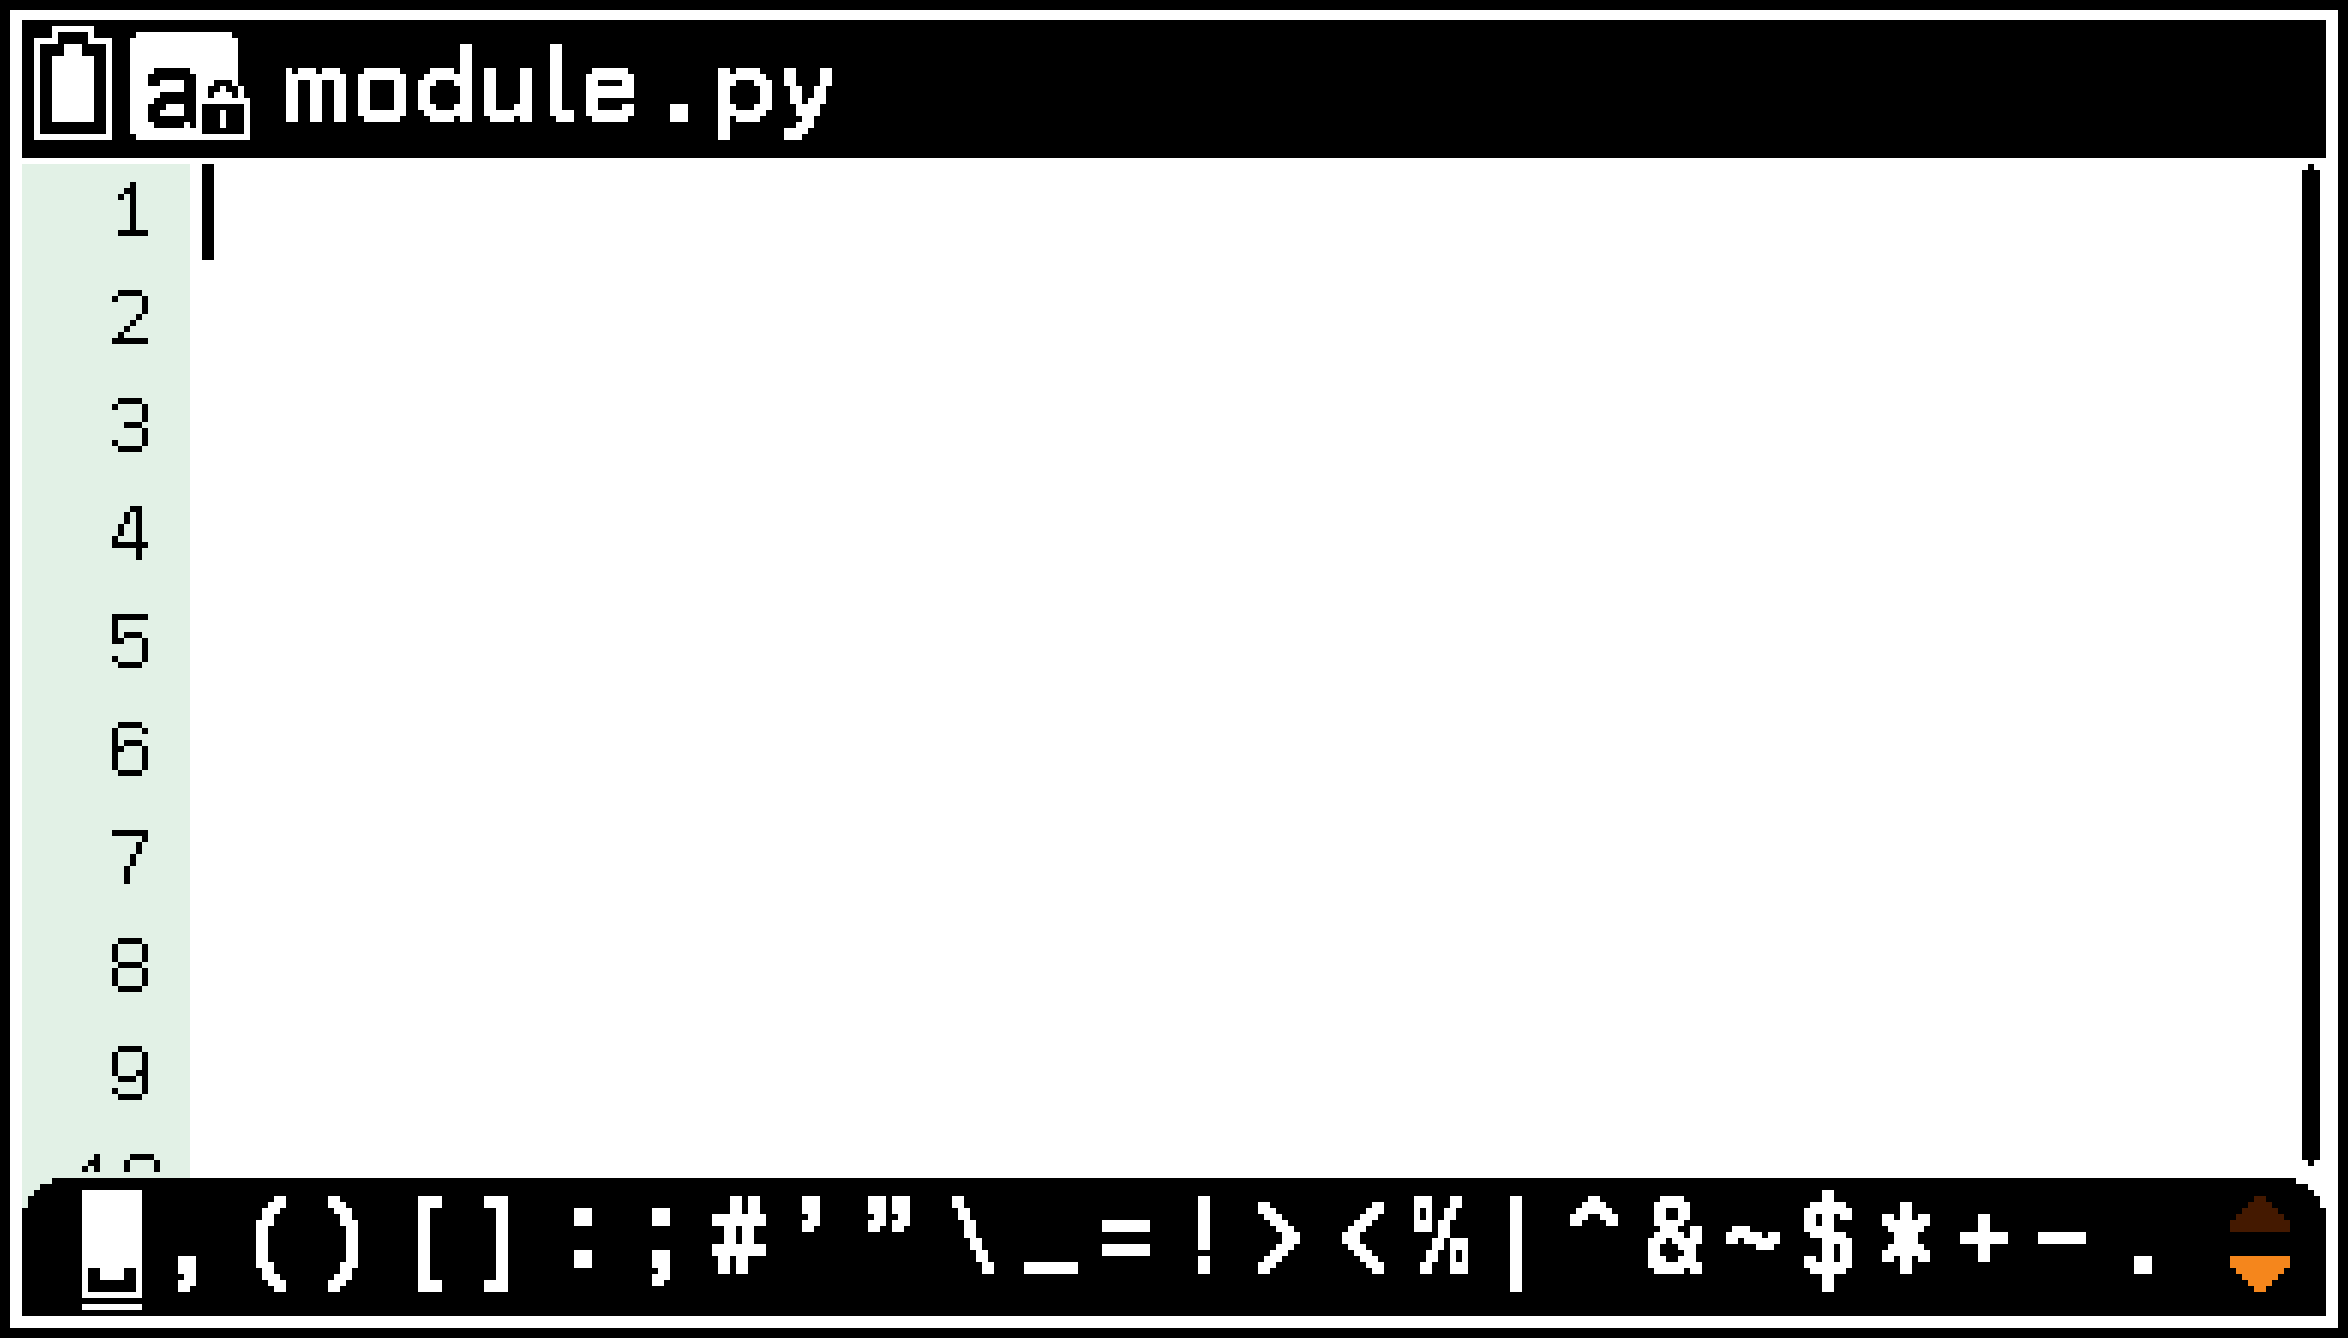
You can use this list to input alpha characters, symbols, and operators. To input a character, use the cursor keys to move the highlight to the character you want to input and then press O. To hide the character list, press b or a.
To use keys to input characters and functions
The table below shows the characters and functions that you can input using keys.
|
Key |
Input Character |
Key |
Input Character |
Key |
Input Character |
|---|---|---|---|---|---|
|
0 to 9 |
0 to 9 |
` |
, |
s`(:) |
: |
|
i |
**2 |
/ |
* |
sv(sin-1) |
asin() |
|
g |
** |
* |
/ |
sc(cos-1) |
acos() |
|
X |
x |
+ |
+ |
st(tan-1) |
atan() |
|
v |
sin() |
- |
- |
s((=) |
= |
|
c |
cos() |
k |
*10** |
s4([) |
[ |
|
t |
tan() |
j |
sqrt() |
s5(]) |
] |
|
( |
( |
N |
exp() |
s7() |
pi |
|
) |
) |
sN(ln) |
log() |
s9() |
1j |
|
. |
. |
si(log) |
log10() |
|
|
Autocomplete during input into Editor
Autocomplete is enabled while you are inputting into Editor. Inputting alpha-characters causes the corresponding candidate commands to appear on the display.
You can perform the following operations while input candidates are displayed.
|
To do this: |
Do this: |
|---|---|
|
Scroll through candidates (when multiple candidates are available) |
Use d/u. |
|
Input the currently displayed candidate |
Press r or O. |
|
Stop display of input candidates |
Press l. (This causes the cursor to move one character back.) |
Note
The autocomplete function only displays the commands in the menu that appears when you press C.
Autocomplete cannot be disabled.
To input commands and functions from the Catalog menu
-
Select the menu for the item you want to input.
-
Highlight the item you want to input and then press O.
|
When you want to input this: |
Select this menu item: |
|---|---|
|
Built-in Python commands and functions |
C > [Built-in] |
|
math module commands and functions |
C > [math] |
|
random module commands and functions |
C > [random] |
|
matplotlib.pyplot module commands and functions |
C > [matplotlib.pyplot] |
|
turtle module commands and functions |
C > [turtle] |
|
casioplot module commands and functions |
C > [casioplot] |
|
Symbols and operators |
C > [Symbol] |
|
Commands and functions from an alphabetic list |
C > [All] > [a] to [z] |
This displays a list of items.
You can jump to an item in the list by using the XA to 0Z keys to input the first characters of the item name.
Auto Indent Upon Newline
Pressing E while editing a script in Editor inputs a newline.
Pressing E after the colon (:) at the end of a line, adds two more spaces at the beginning of the new line (Auto Indent).
Pressing E while in an indented line will add the same indent (space) to the new line.
Statement Block Input
When inputting to Editor, selecting a command that has a multi-line syntax such as “if:else” or “for:range()” from the Catalog menu inputs a statement block that includes line breaks and spaces.
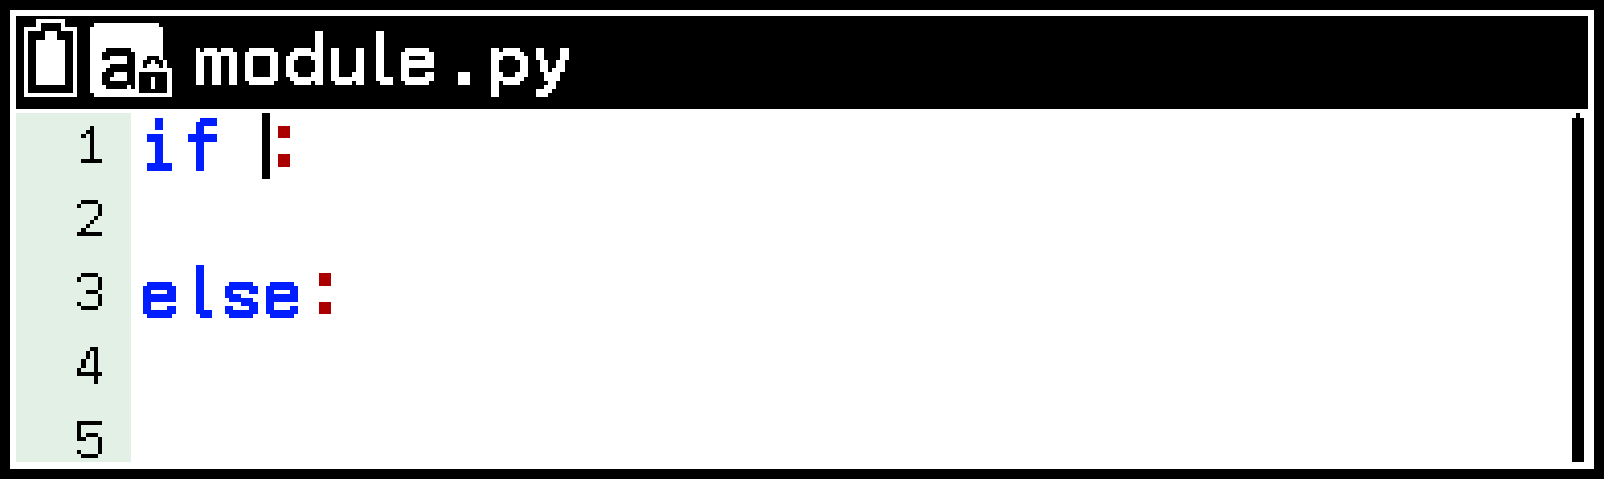
Example: To select “if:else” and add the multi-line context shown below, where “□” indicates a space
if□:
□□
else:
□□
When inputting into Shell, only the first line of the block is input.
To input user-defined variables and functions
-
Press V to display the Variable menu.
-
Highlight the variable or function you want to input and then press O.
The Variable menu displays variables and functions as described below.
|
When V is pressed while Editor is displayed |
Displays global variables and user-defined functions that are defined in the displayed py file. |
|
When V is pressed while Shell is displayed |
Displays global variables and user-defined functions that were defined in the last py file executed before Shell initialization.* |
See Initializing Shell.
Note
The items below are not shown on the Variable menu.
Local variables, functions within functions, function arguments, user-defined classes
Variables and functions contained in a py file imported from the currently open py file
Variables defined with Shell
Variables and functions contained in py files imported from Shell
Variables displayed when you press V in other apps are not displayed in the Python app.
Using Shell
Shell is an interactive command line. From the Shell >>> prompt, you can input commands*1 and press E to obtain the result*2 immediately. Shell history stores up to 200 of the latest prompt and result lines.*3
Up to 255 characters. For information about inputting text, functions, and commands into the Shell, see Input Operations (Same for Editor and Shell).
Result output has up to 509 characters per line.
Until you select T > [Delete All] or start up another app.
To display Shell
While Editor is displayed, execute a script or select T > [Shell].* Shell is initialized at this time.
Selecting T > [Shell] does not execute the script currently displayed by Editor.
Initializing Shell
Shell stores variables and functions defined in the most recently executed script in the Shell heap area (temporary memory area for storage). Whenever you go from Shell to Editor, the Shell heap area contents up to that point are cleared. This clearing of Shell heap area contents is called “SHELL initialization.” When Shell is initialized, the message “* SHELL Initialized *” is inserted on the line that corresponds to when it was initialized.
To clear all Shell history contents
Press a or select T > [Delete All].
matplotlib.pyplot Module
The matplotlib.pyplot module provides functions for drawing graphs with the Python app.
Important!
The matplotlib.pyplot module of the Python app is a proprietary module created to run on this calculator. It is different from the matplotlib.pyplot module that runs on PC-based Python.
The functions included in the matplotlib.pyplot module in the Python app of this calculator may differ from those of the matplotlib.pyplot module of PC-based Python in terms of behavior, supported arguments, and other specifications. Each function supports only the format and arguments specified here.
Note
To use functions in the matplotlib.pyplot module, you must import the matplotlib.pyplot module.
To import the matplotlib.pyplot module
-
Select C > [matplotlib.pyplot].
-
On the menu that appears, select the commands below.
from matplotlib.pyplot import *
import matplotlib.pyplot
In the syntax of each function shown in this section, anything included in square brackets ([ ]) can be omitted.
The functions included in the matplotlib.pyplot module of the Python app are described below.
Displaying the Drawing Screen
show()
Shows graphs, grids, and axes that have been specified for drawing on the drawing screen.
Syntax: show() (no argument)
To return to Shell after displaying the drawing screen, press b.
Note
Execution of clears all of the following items that were specified prior to execution.
Graphs that were specified for drawing
Axis settings (Returned to initial default settings.)
Grid settings (Returned to initial default settings.)
If a script contains multiple calls, the graphs, grids, and axes that were described or configured between the second-to-last and the final will be displayed on the drawing screen.
Axis and Grid Settings
axis()
This function can be used to specify the display range of an axis and to change axis settings.
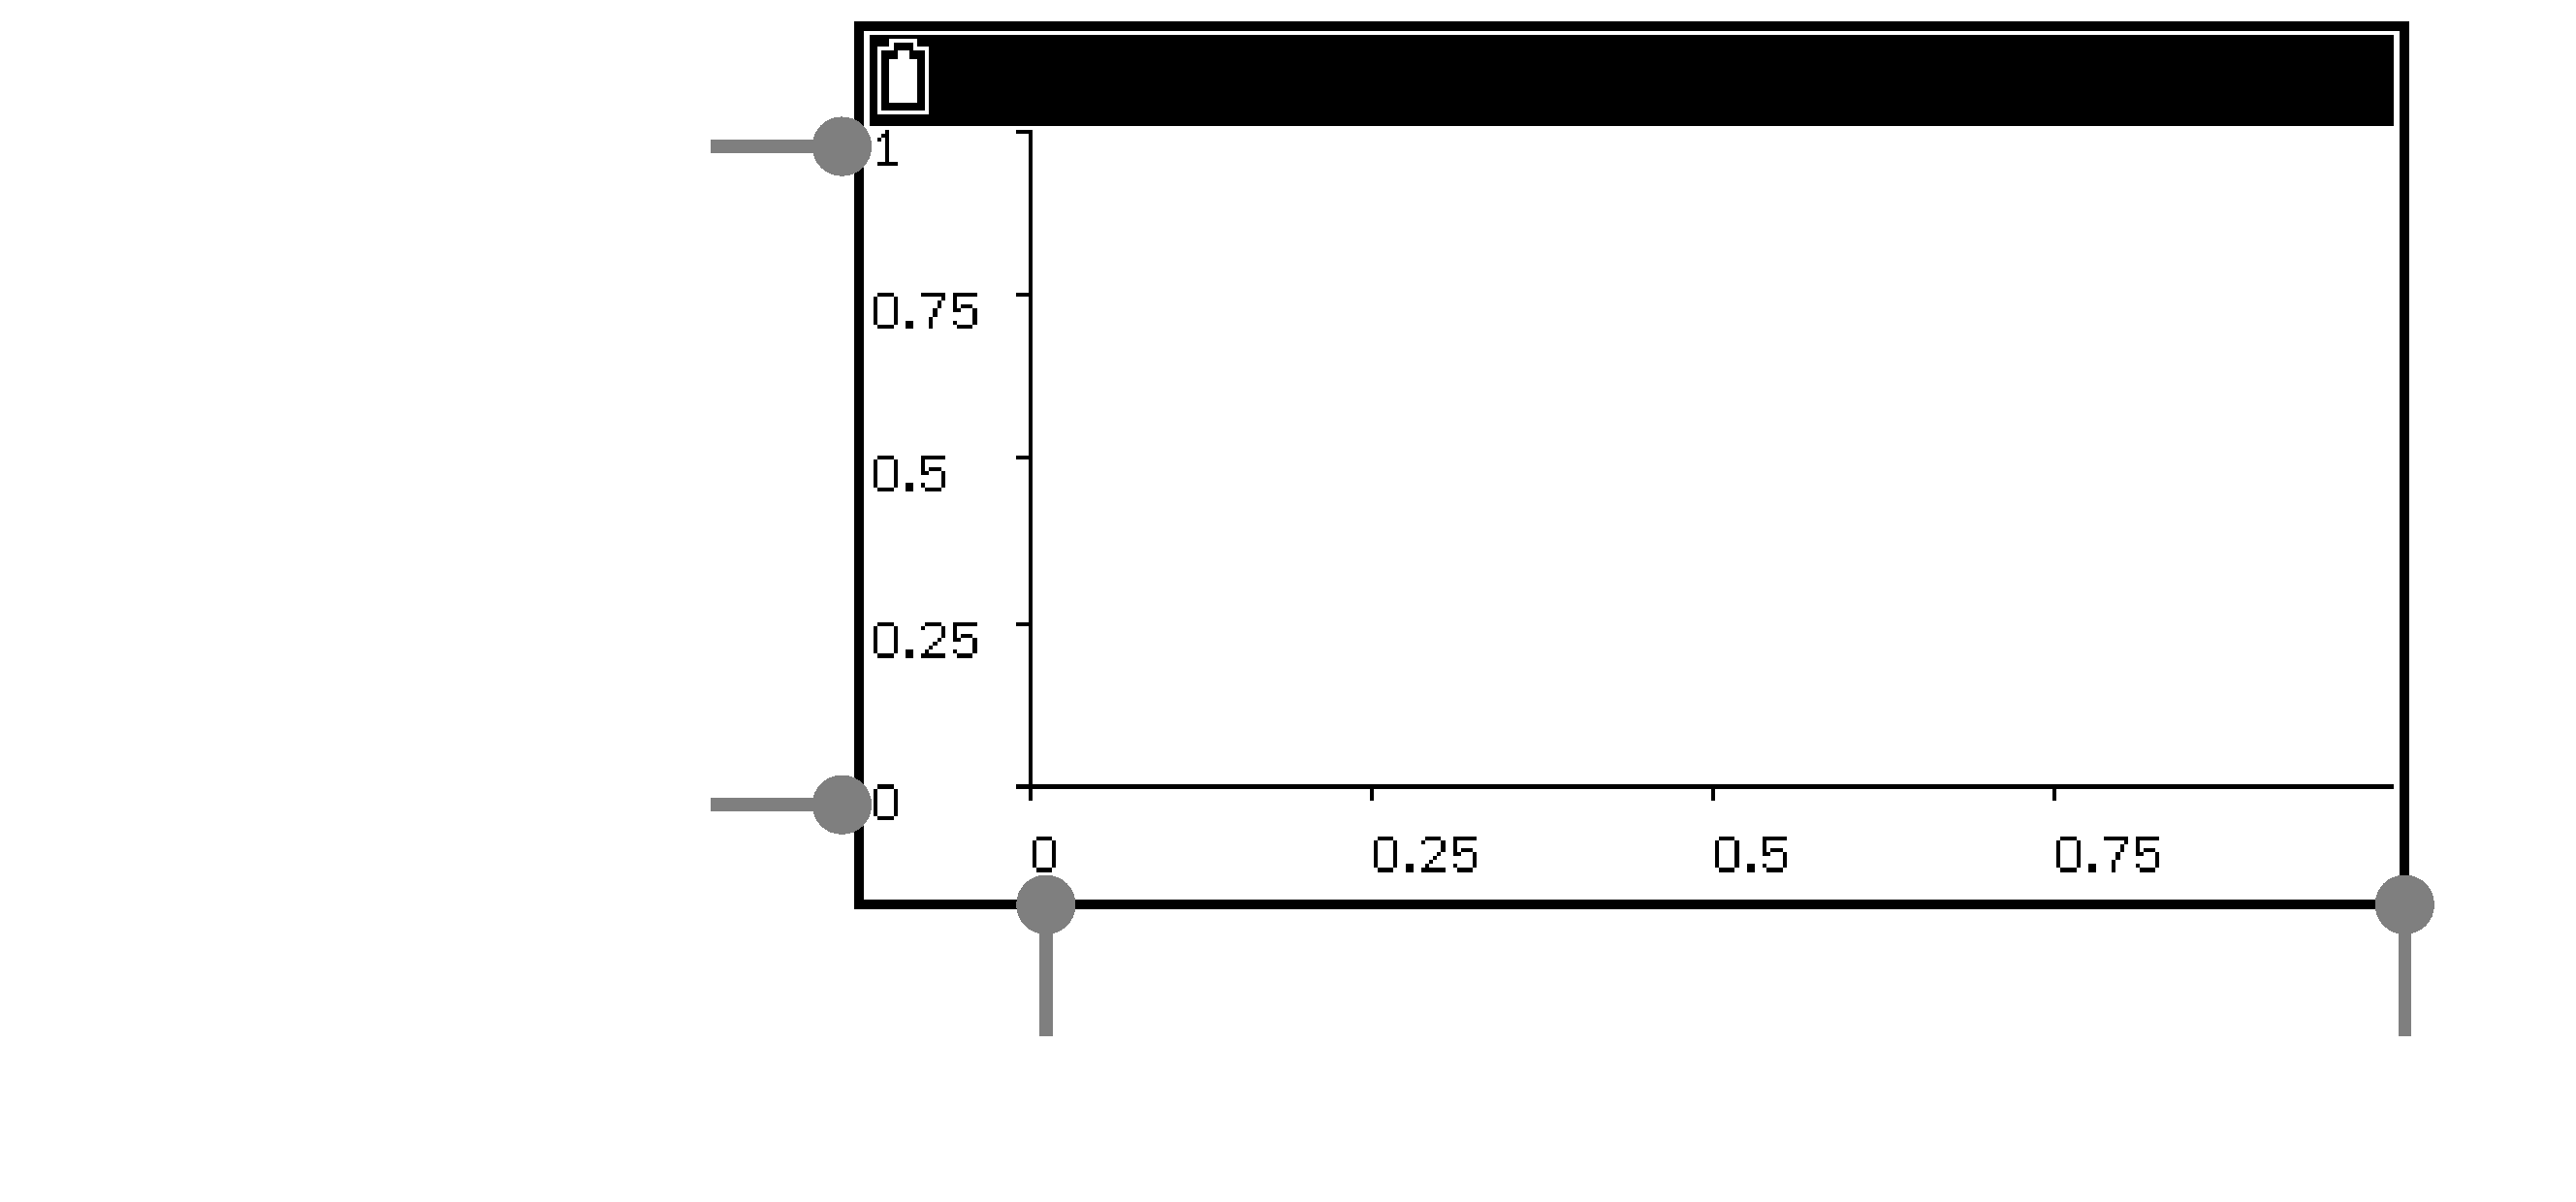
Syntax 1: axis(list)
Input the axis display range in the form [min,max,min,max] for the argument list. The coordinates of the lower left corner of the screen are determined by min and min.
|
min |
-axis minimum value |
|
max |
-axis maximum value |
|
min |
-axis minimum value |
|
max |
-axis maximum value |
list type: list or tuple
list element type: int or float
Initial defaults: [0,1,0,1]
min
max
min
max
Syntax 2: axis(option)
Specifies the axis setting by inputting one of the keywords (type: str) into the option argument.
"on": Show axis
"off": Hide axis
"auto": Automatically set the axis range to match the graph*1
Syntax 3: axis() (no argument)
Returns to the display range of the currently specified axis.*2
axis("auto") is valid only when it comes after the graph drawing function.
When executed with Shell. To write to a py file and output the setting values, you need to write “print(axis())”.
Note
The axis display color is always black.
grid()
Use this function to show or hide the grid and to specify the grid color.
Syntax 1: grid(option[,color])
Specifies show/hide grid. You can also specify the grid color at the same time.
option argument: Specifies show/hide grid.
To specify using str type, use the keywords below.
"on", "True", or "true": Show grid
"off", "False", or "false": Hide grid
To specify using bool type, use the terms below.
True: Show grid
False: Hide grid
color argument: Specifies the grid color.
Type: str
How to specify: Use the syntax grid(option,color="keyword") to specify the grid color. For information about text strings that can be specified as keywords, see Color Keywords.
Operation when omitted: The grid is drawn with solid gray lines. (The grid is not shown if the "Hide grid" argument option is specified.)
Syntax 2: grid(color)
Specifies the grid color. Also switches to "Show grid." (This is the same as when grid("on") is specified in Syntax 1.)
color argument: Specifies the grid color. The type and method for specifying the color are the same as that for Syntax 1.
Syntax 3: grid() (no argument)
Toggles the grid setting between show and hide.
For example, calling grid() after grid("on") toggles the grid from show to hide.
Calling grid() after grid("off") toggles the grid from hide to show. In this case, the grid is drawn as solid gray.
Note
If was used to hide the axis, the grid will also be hidden.
Drawing Graphs and Text Strings
plot()
Plots a point or draws a line segment.
Syntax 1: plot(,[,color])
Plots a point at the specified coordinates. You can also specify the color of the point.
, arguments: Specifies coordinates (, ).
Type: int or float
color argument: Specifies the color.
Type: str
How to specify: Use the syntax plot(,,"keyword") to specify the color. For information about text strings that can be specified as keywords, see Color Keywords.
Operation when omitted: The color is specified automatically. For details, see Auto Color Specification.
Syntax 2: plot([list,]list[,color])
Draws a line segment connecting multiple specified coordinates. You can also specify the color of the line segment.
list, list arguments: Specifies multiple coordinates (, ; , ; , ; …).
list, list type: list or tuple
list, list element type: int or float
Omitting list automatically assigns list = [0,1,2,3,…].
When both list and list are specified, both lists must contain the same number of elements.
The color argument is the same as that for Syntax 1.
Note
The form of a point drawn at the coordinates specified by is always a cross (+).
Executing without specifying anything for causes the axis to be adjusted automatically.
If you input a "shape keyword" that is supported by PC-based Python for the color argument, the keyword will be ignored without causing an error. If you input only a shape keyword for the color argument, the color argument will be treated as if no argument was input. The behavior is the same as when it is omitted.
bar(,)
Draws a bar chart.
Syntax 1: bar(,[,width])
Draws a single bar chart.
argument: Specifies the bar chart -coordinate.
argument: Specifies the bar chart height.
, type: int or float
width argument: Specifies the bar chart width (scale width along the -axis). Specifying 0 draws using a width of one dot.
Type: int or float
Initial default: 0.8 (0.8 when omitted)
Syntax 2: bar(list,list[,width])
Draws a bar chart with one or multiple bars.
list argument: Each list element specifies the -coordinate each bar.
list argument: Each list element specifies the height of each bar.
list, list type: list or tuple
list, list element type: int or float
The number of elements in list and list must match.
The width argument is the same as that for Syntax 1.
Note
Executing without specifying anything for causes the axis to be adjusted automatically.
The color of a bar chart drawn using is specified automatically. For details, see Auto Color Specification.
scatter(,)
Draws a scatter plot.
Syntax 1: scatter(,)
Plots a point at the specified coordinates.
, arguments: Specifies coordinates (, ).
, type: int or float
Syntax 2: scatter(list,list)
Draws a scatter plot by plotting points at all of the specified coordinates.
list, list arguments: Specifies multiple coordinates (, ; , ; , ; …).
list, list type: list or tuple
list, list element type: int or float
The number of elements in list and list must match.
Note
The form of a point drawn at the coordinates specified by is always a cross (+).
Executing without specifying anything for causes the axis to be adjusted automatically.
The color of the points drawn using is automatically specified. For details, see Auto Color Specification.
hist()
This function draws a histogram (a frequency distribution chart in which the horizontal axis represents classes and the vertical axis represents frequencies).
Syntax 1: hist([,bins]) or hist(,listbins)
Draws a histogram where the number of data points is 1 (frequency=1).
argument: Inputs a data value.
type: int or float
bins argument: Specifies the number of bins in the histogram as an integer greater than or equal to 1.
bins type: int
Initial default: 10 (10 when this argument is omitted)
How to specify: To specify four bins, for example, use hist(,bins=4), or hist(,4).
listbins argument: Specifies multiple values for the histogram class division points.
listbins type: list or tuple
listbins element type: int or float
For example, hist(1,[0,2,4]) would result in two intervals of 0-to-2 and 2-to-4.
Syntax 2: hist(list[,bins]) or hist(list,listbins)
Draws a histogram with multiple data points.
list argument: Input a data value for each element.
list type: list or tuple
list element type: int or float
The bins and listbins arguments are the same as that for Syntax 1.
Note
Executing without specifying anything for causes the axis to be adjusted automatically.
The color of the histogram drawn by is specified automatically. For details, see Auto Color Specification.
Values input for the listbins argument are automatically sorted into ascending order. For example, inputting [4,0,2] is treated as [0,2,4].
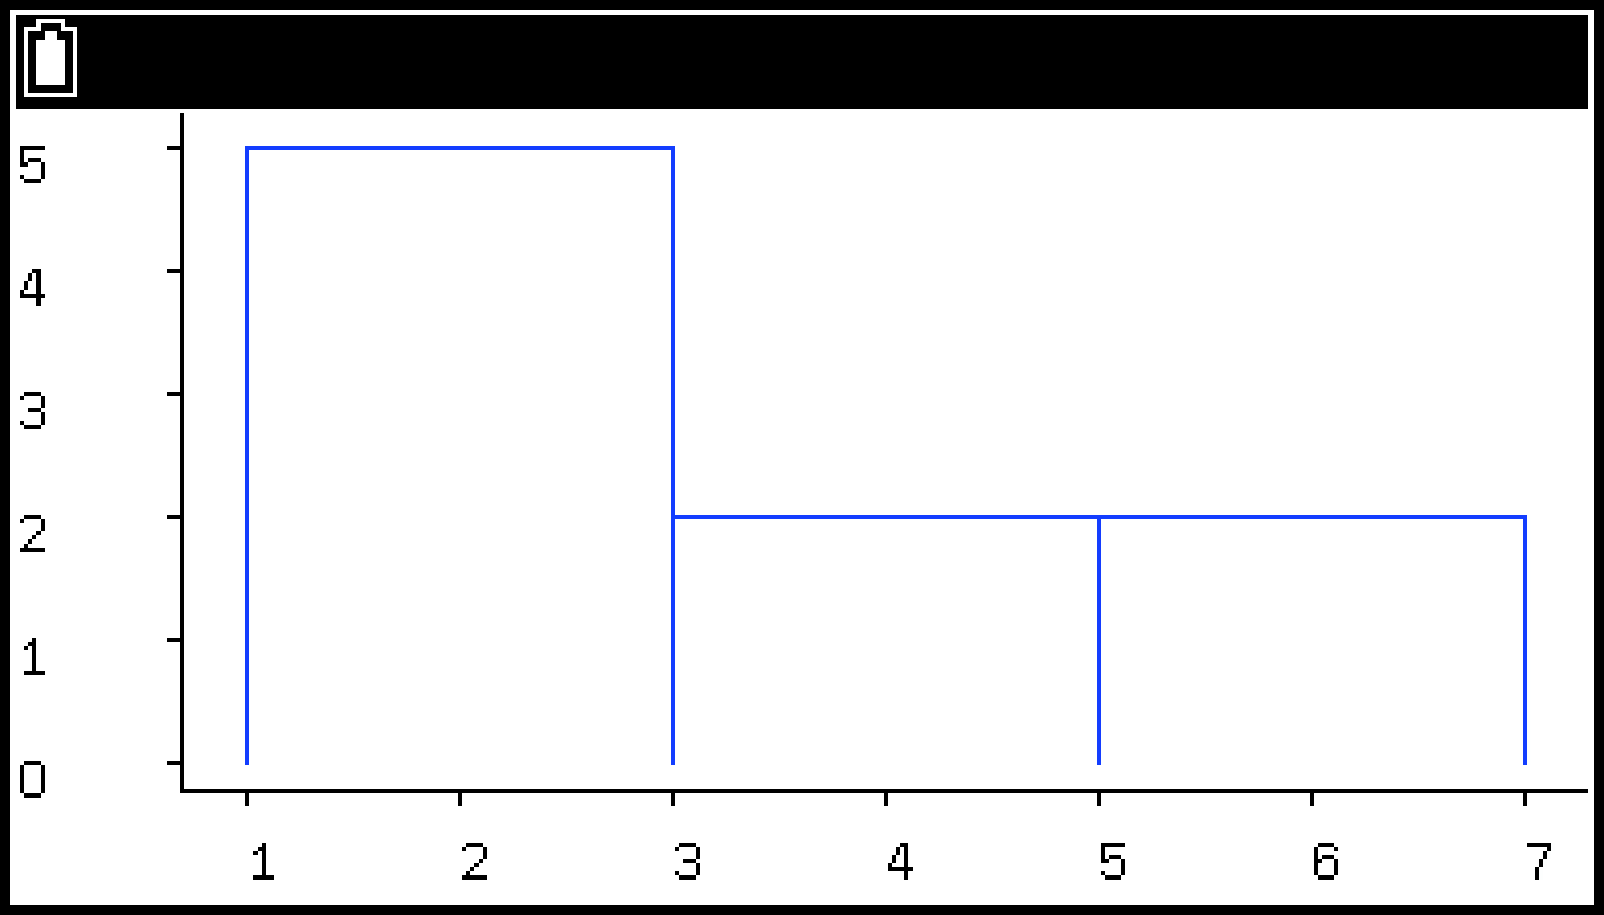
Data values at the division point of a class are included in the class above the division point, except in the case of the maximum value. For example, executing hist([1,1,2,2,2,3,4,5,7],3) specifies 3 for the bins argument, so the classes are 1-to-3, 3-to-5, and 5-to-7. Data value 3 at the division point would be included in the 3-to-5 class, and data value 5 in the 5-to-7 class. However, the maximum value of 7 will be included in the 5-to-7 class.
arrow(,,,)
Draws an arrow.
Syntax: arrow(,,,[,edgecolor[,facecolor[,head_width[,head_length]]]])
, arguments: Specify the coordinates (, ) of the draw start point of the arrow.
, arguments: Specify the end point* of the arrow, which will be at the coordinates (+, +).
, , , type: int or float
End point of the line segment that does not include the arrowhead.
edgecolor argument: Specifies the arrow edge color.
facecolor argument: Specifies arrowhead face color.
edgecolor, facecolor type: str
edgecolor initial value: black; facecolor initial color: blue (These colors are used when these arguments are omitted.)
head_width argument: Specifies the arrowhead width.
head_length argument: Specifies the arrowhead length.
head_width, head_length type: int or float
head_width initial value: 0.003; head_length initial value: head_width × 1.5
If a negative value is specified for head_width or head_length, the absolute value of the value is applied.
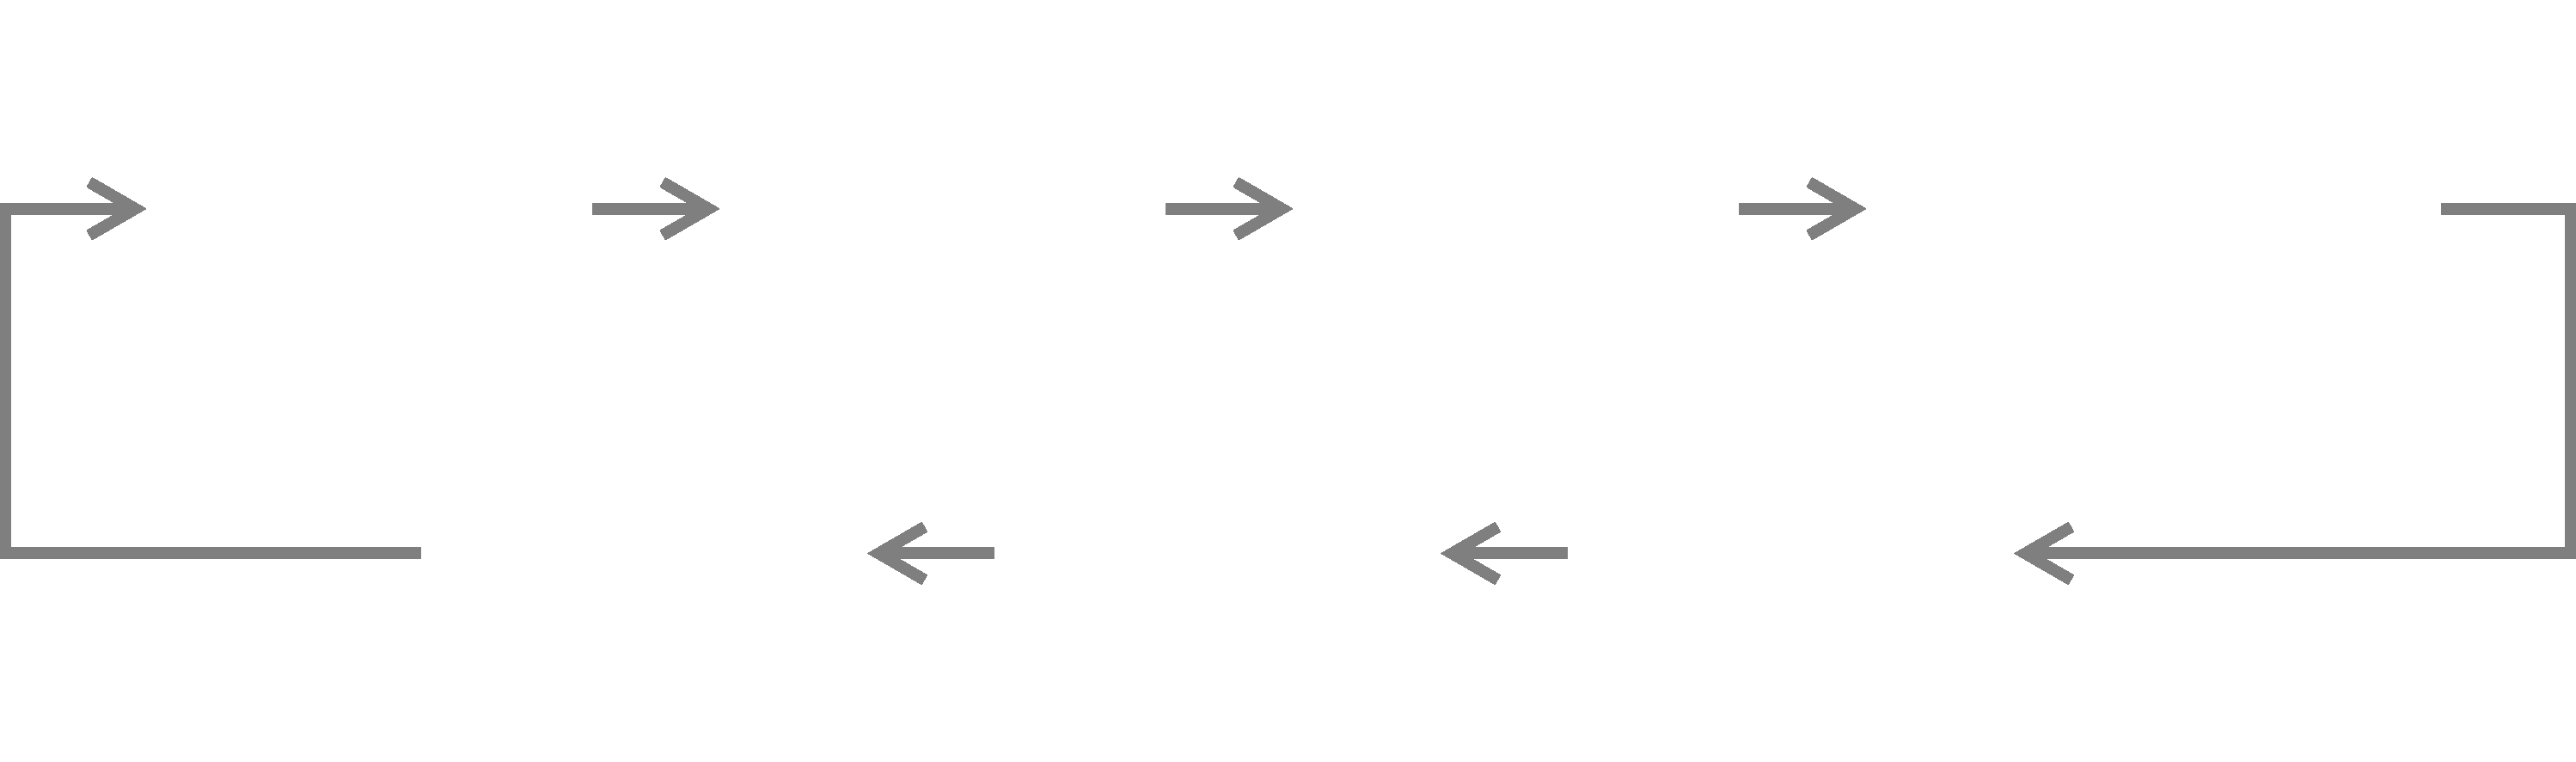
Example: To draw an arrow with coordinates (0, 0) as its start point and coordinates (0.5, 0.5) as its end point. Specify blue for the arrow edge color, red for the arrowhead face color, and 0.5 for the head width and length.
from matplotlib.pyplot import *
arrow(0,0,0.5,0.5,edgecolor="blue",facecolor="red",head_width=0.5,head_length=0.5)
show()
Operation results are shown below.
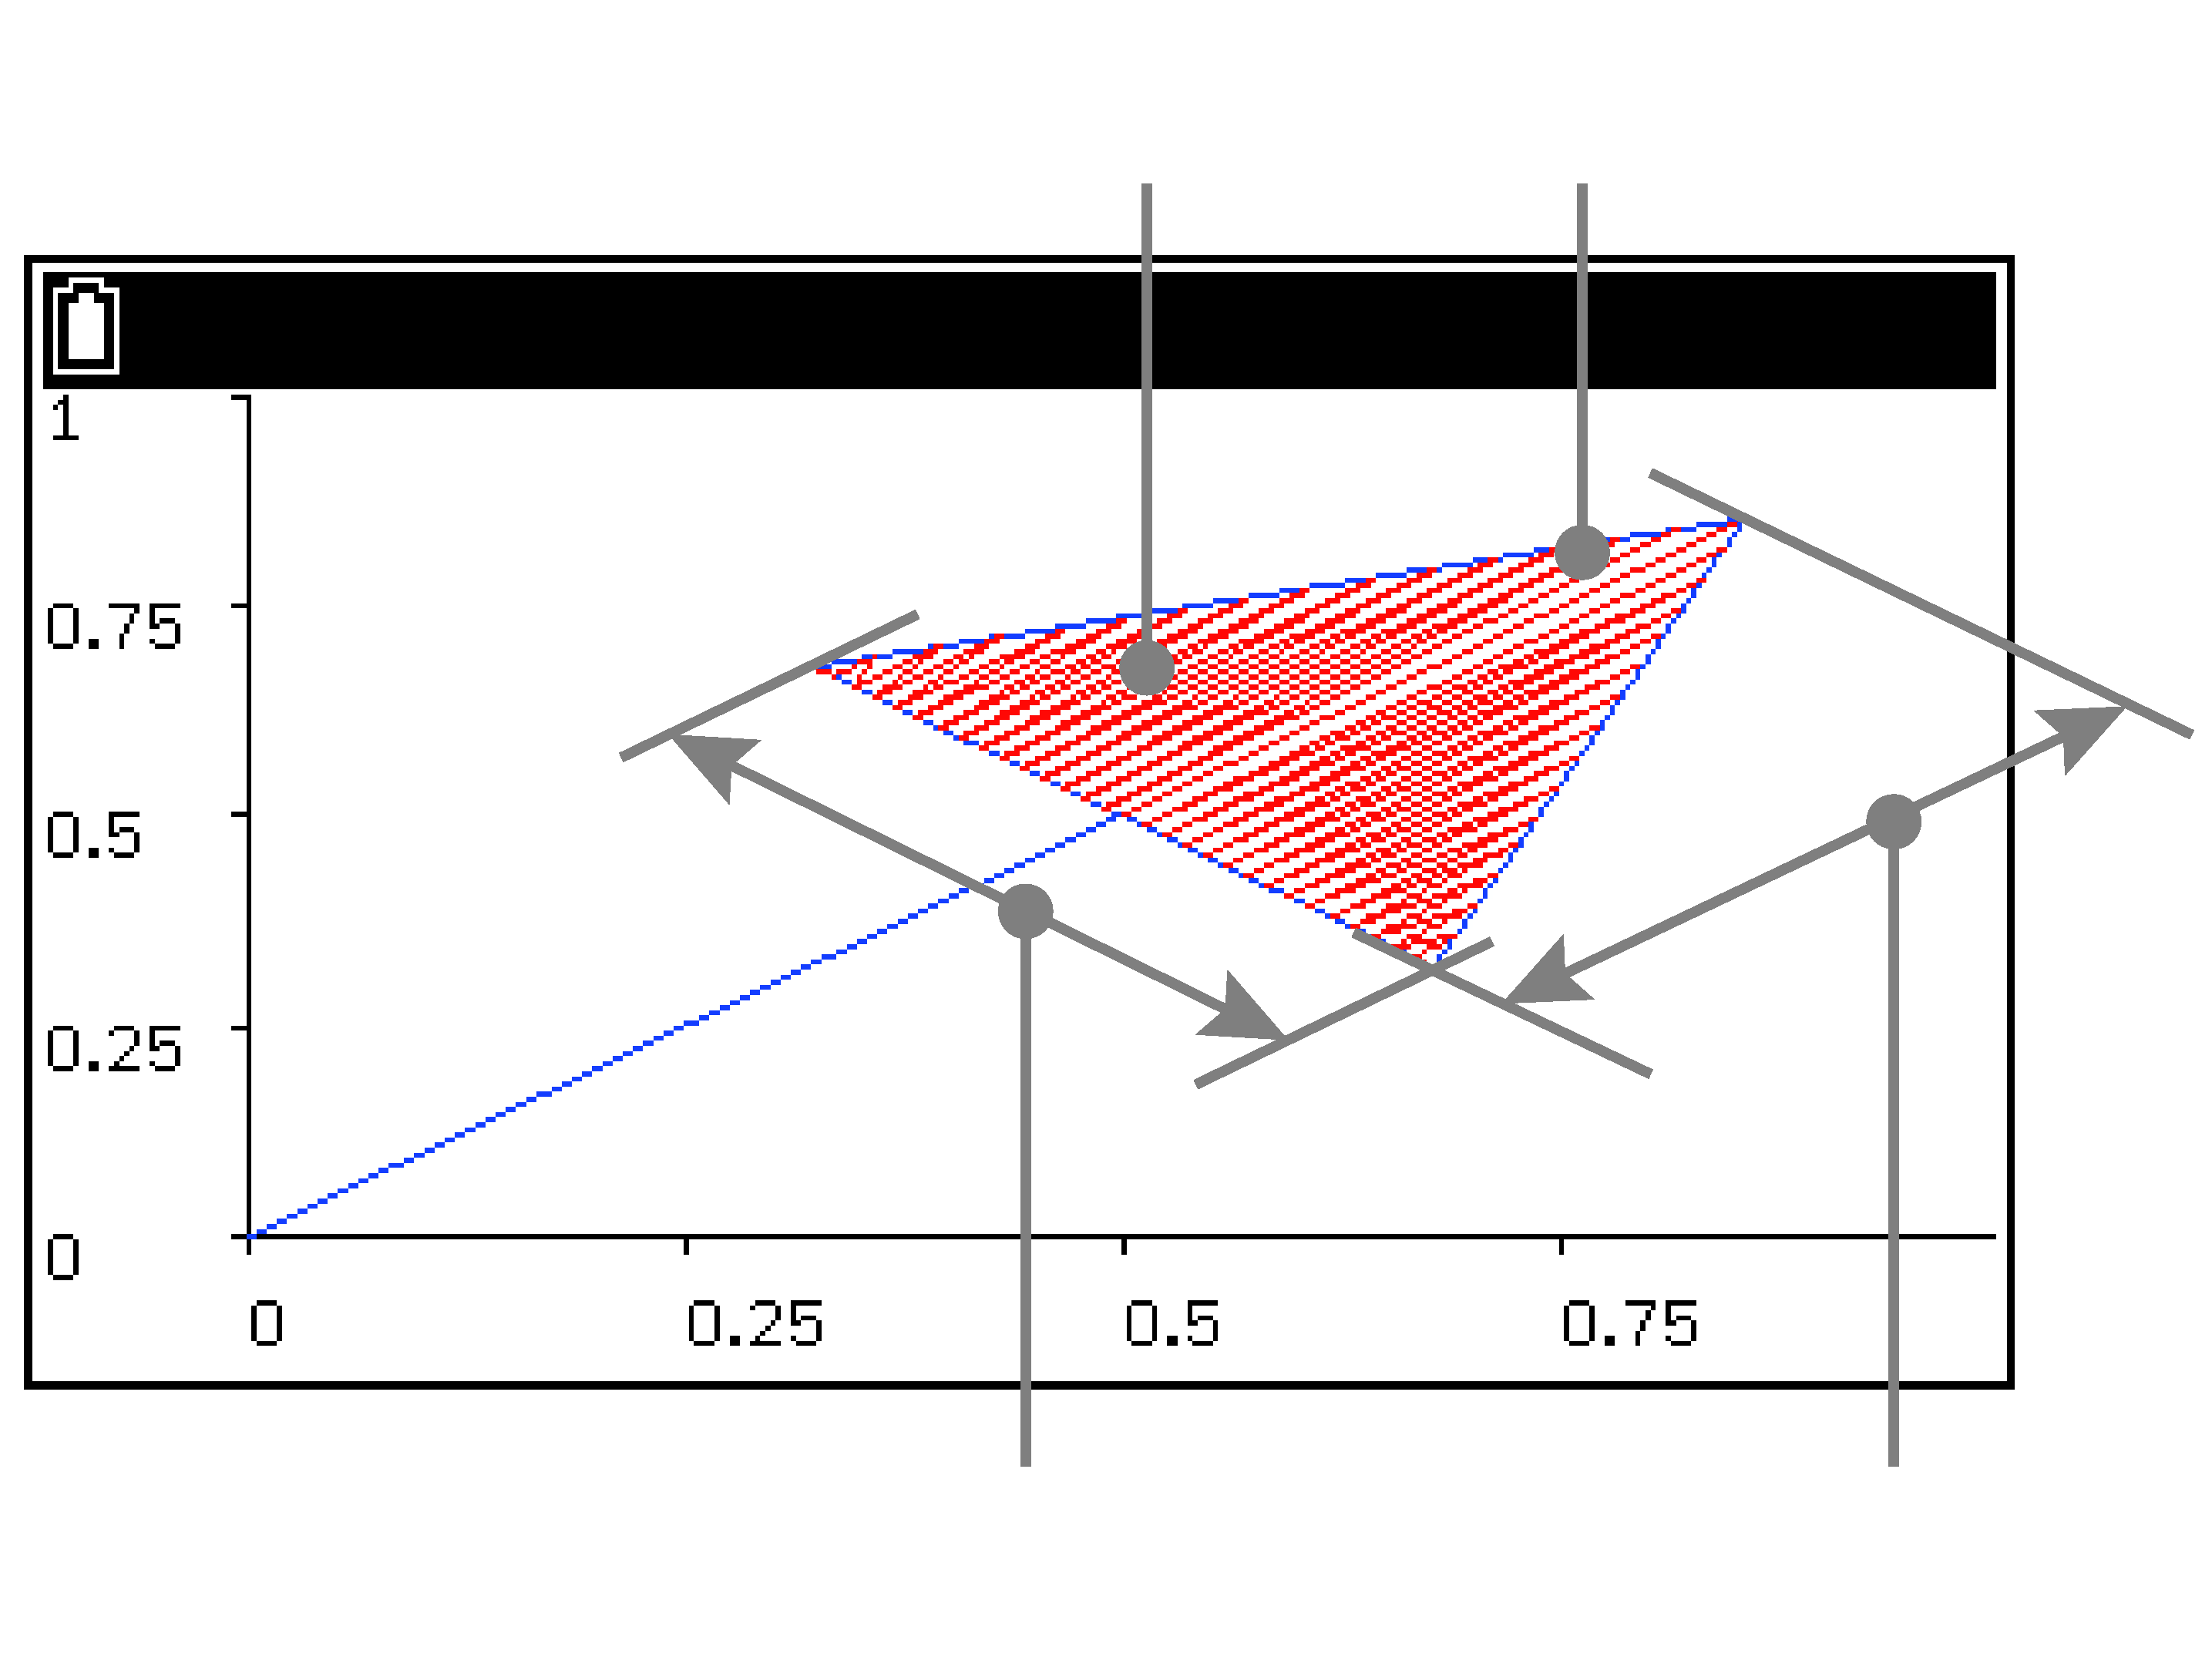
facecolor
edgecolor
head_width
head_length
Note
When specifying the edgecolor, facecolor, head_width, and head_length arguments, you should always write a string that specifies an argument (edgecolor= part) as shown in the Example above. The text string specifying each argument can be entered using C > [matplotlib.pyplot].
See Color Keywords for keywords like blue, red, etc. that can be used to specify colors.
The axis is not adjusted automatically if you execute without specifying anything for . If the arrow extends beyond the drawing screen, specify the axis manually.
text(,,)
Draws a text string at the specified coordinates.
Syntax: text(,,text)
, arguments: Specify the coordinates (, ) of the left end of the string.
, type: int or float
text argument: Specifies a text string.
There are no restrictions on the text argument’s type. Any text string can be entered by enclosing it within double quotes (" ").
Note
The axis is not adjusted automatically if you execute without specifying anything for . If the text string extends beyond the drawing screen, specify the axis manually.
The color of text strings drawn with is always black.
Color Keywords
The keywords shown in the tables below can be used as , , and arguments to specify colors.
|
To specify this color: |
Use this keyword: |
|---|---|
|
Blue |
"b" or "blue" |
|
Red |
"r" or "red" |
|
Green |
"g" or "green" |
|
Magenta |
"m" or "magenta" |
|
Black |
"k" or "black" |
|
Cyan |
"c" or "cyan" |
|
Yellow |
"y" or "yellow" |
|
White |
"w" or "white" |
|
Grey |
"grey" |
|
Orange |
"orange" |
|
Purple |
"purple" |
|
Brown |
"brown" |
|
Pink |
"pink" |
Note
Color keywords can be input using C > [matplotlib.pyplot].
Auto Color Specification
When a graph is drawn using a single execution of *, , , or , blue is automatically specified as the color. When these functions are executed in succession to draw graphs, the graph colors are automatically specified in the following sequence:
blue
red
green
magenta
black
cyan
yellow
Each execution of causes the auto graph color sequence to return to blue.
For the function, the color is automatically assigned only when the color argument is omitted.
Example: To use and to draw two graphs in succession. Omit the color argument.
from matplotlib.pyplot import *
plot([1,1.5,2.5])
plot([0,0.5,0.2])
bar(1,1)
bar([2,3],[2,3])
show()
Operation results are shown below.
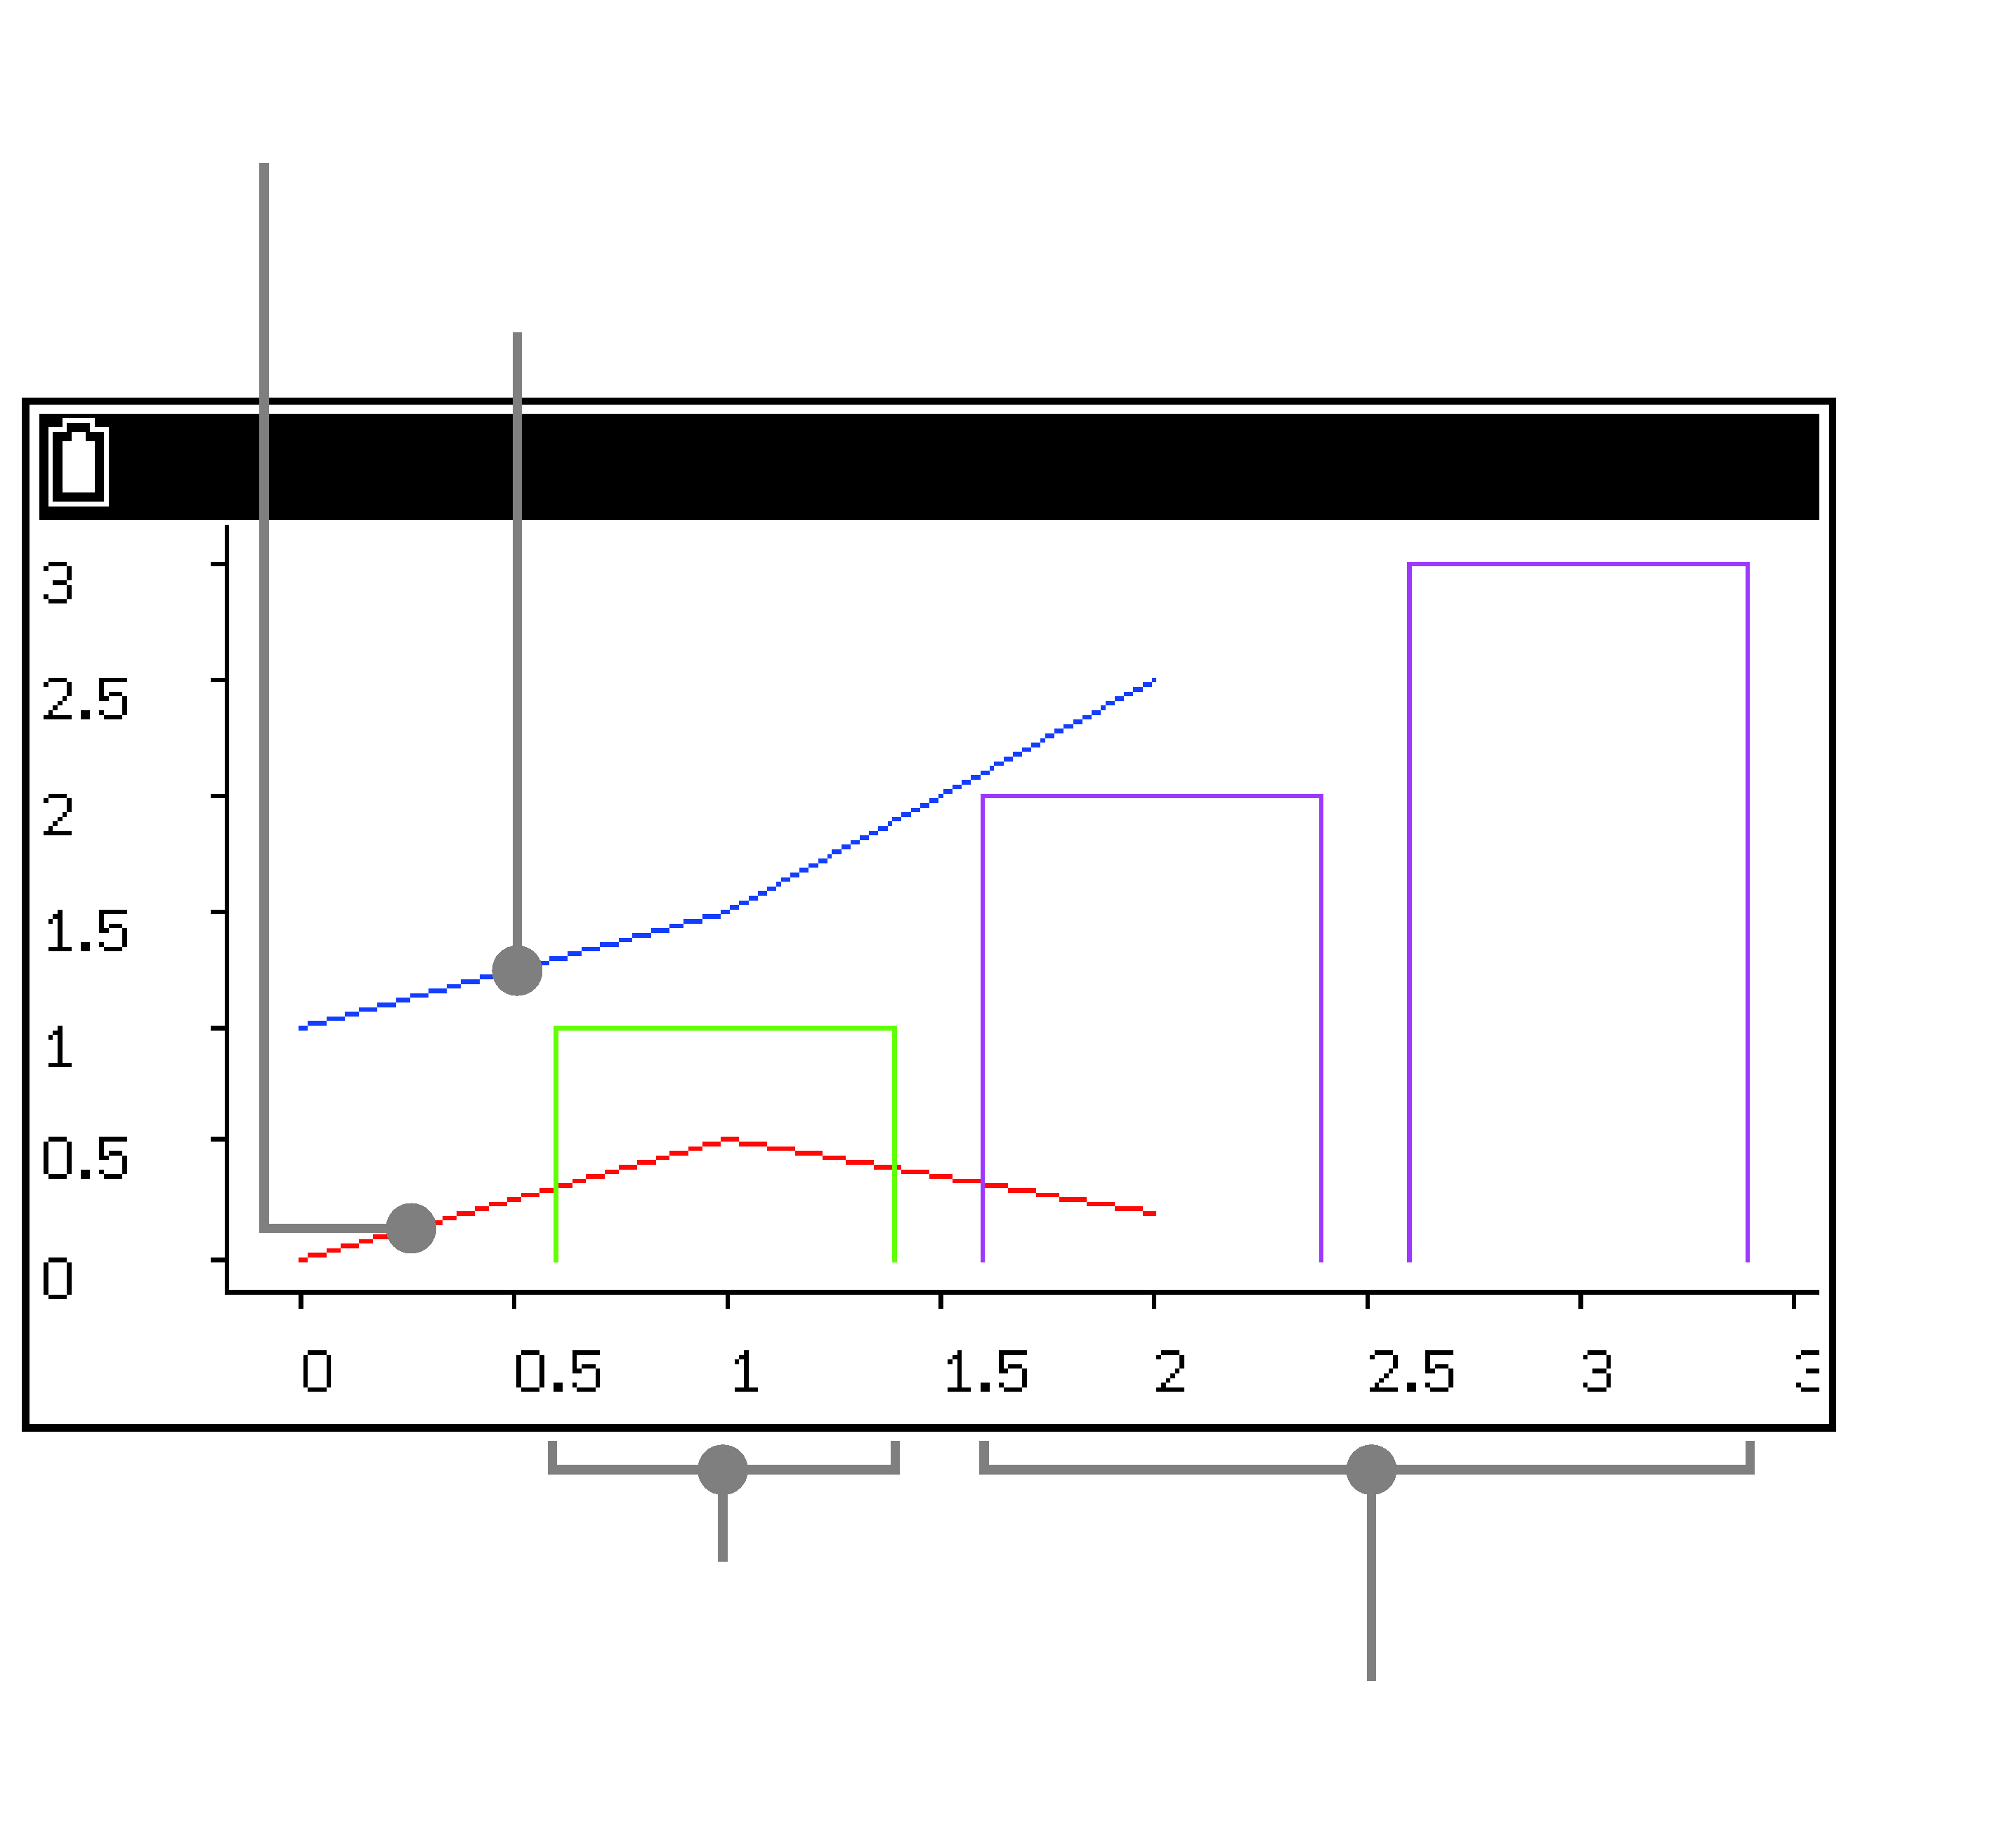
plot([1,1.5,2.5])
plot([0,0.5,0.2])
bar(1,1)
bar([2,3],[2,3])
turtle Module
The turtle module provides functions to manipulate a virtual "turtle" (![]() ) with the pen. You can make the turtle draw shapes and patterns.
) with the pen. You can make the turtle draw shapes and patterns.
Important!
The turtle module of the Python app is a proprietary module created to run on this calculator. It is different from the turtle module that runs on PC-based Python.
The functions included in the turtle module in the Python app of this calculator may differ from those of the turtle module of PC-based Python in terms of behavior, supported arguments, and other specifications. Each function supports only the format and arguments specified here.
Note
To use functions in the turtle module, you must import the turtle module.
To import the turtle module
-
Select C > [turtle].
-
On the menu that appears, select the commands below.
from turtle import *
import turtle
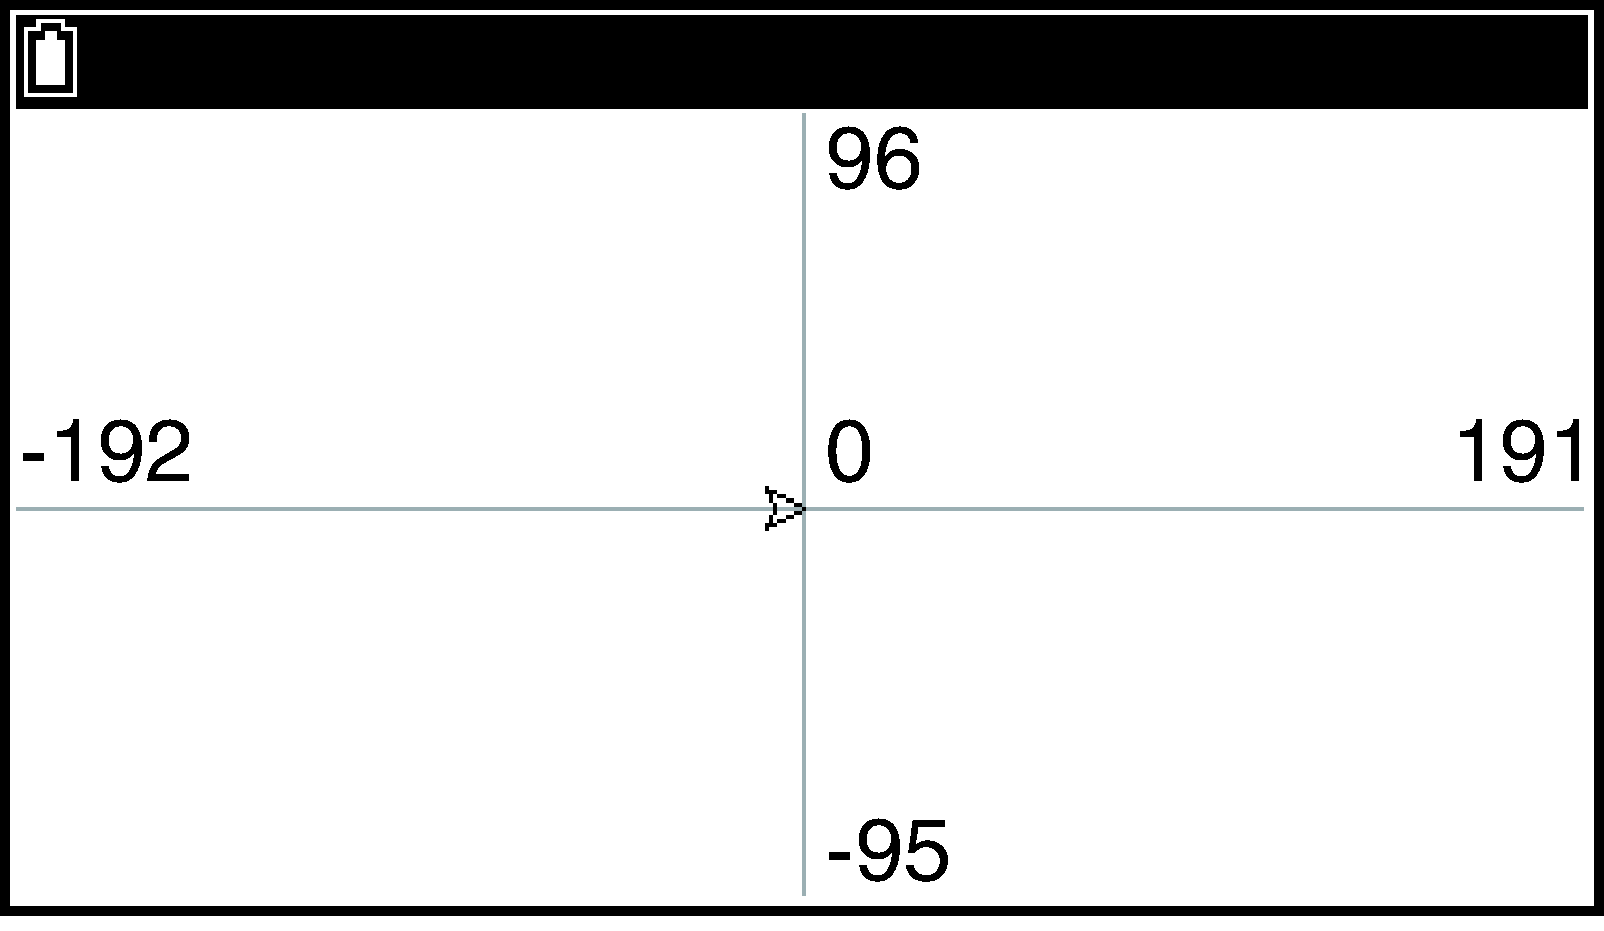
When using the turtle module with the Python app, the coordinates are fixed as shown below.
Origin: 0, 0
-axis minimum value: -192, maximum value: 191
-axis minimum value: -95, maximum value: 96
The functions below can be written as is only when executed with Shell. To write them to a py file and output the setting values, you need to write them inside print(), such as print(pencolor()).
pencolor(), pensize(), width(), shape(), speed(), isvisible(), isdown(), xcor(), ycor(), position(), distance(,), towards(,), heading()
In the syntax of each function shown in this section, anything included in square brackets ([ ]) can be omitted.
The functions included in the turtle module of the Python app are described below.
Specifying a Pen
pendown()
Lowers the pen, enabling drawing.
Syntax: pendown() (no argument)
When you move the turtle with the pen down, a line is drawn from the current location of the turtle to its destination. To move the turtle, use the functions under Specifying Direction and Forward/Back Movement and Moving to Specified Coordinates.
penup()
Raises the pen, disabling drawing.
Syntax: penup() (no argument)
When the pen is up, nothing is drawn if the turtle is moved.
pencolor()
Specifies the line drawing color or returns the value of the line drawing color.
Syntax 1: pencolor(colorstring)
colorstring argument: Uses a keyword to specify the line drawing color.
Type: str
How to specify: Use the syntax pencolor("keyword") to specify the color. The text strings below can be specified as keywords
black, blue, green, red, cyan, yellow, magenta, white, orange, purple, brown, pink, grey
Syntax 2: pencolor(list)
list argument: Uses RGB values to specify the line drawing color.
Type: list or tuple
Element type: int or float
How to specify: Use the syntax [r,g,b] (0 ≤ r ≤ 1, 0 ≤ g ≤ 1, 0 ≤ b ≤ 1) to specify RGB values. Each RGB value corresponds to a Syntax 1 keyword as shown in the table below.
|
Keyword |
RGB Values |
|---|---|
|
black |
[0,0,0] |
|
blue |
[0,0,1] |
|
green |
[0,1,0] |
|
red |
[1,0,0] |
|
cyan |
[0,1,1] |
|
yellow |
[1,1,0] |
|
magenta |
[1,0,1] |
|
white |
[1,1,1] |
|
orange |
[1,0.65,0] |
|
purple |
[0.66,0,0.66] |
|
brown |
[0.75,0.25,0.25] |
|
pink |
[1,0.75,0.8] |
|
grey |
[0.66,0.66,0.66] |
Syntax 3: pencolor() (no argument)
Returns the RGB values (or the keyword if applicable) of the current line drawing color.
pensize(), width()
Specifies the line width or returns the value of the current line width.
Syntax 1: pensize(n)
width(n)
n argument: Specifies the line width as a real number from 0 to 5. The greater the number, the wider the line.
Type: int or float
Syntax 2: pensize() (no argument)
width() (no argument)
Returns the value of the current line drawing width.
Specifying Direction and Forward/Back Movement
right()
Rotates the turtle to the right by a specified angle so its head is pointed in a desired orientation.
Syntax: right(a)
a argument: Specifies in degrees the angle (0° ≤ a < 360°) which the turtle should be rotated.
Type: int or float
left()
Rotates the turtle to the left by a specified angle so its head is pointed in a desired orientation.
Syntax: left(a)
argument a is the same as that for .
setheading()
Specifies the absolute orientation of the turtle’s head, with east being 0° (right), 90° north (top), 180° west (left), and 270° south (bottom).
Syntax: setheading(a)
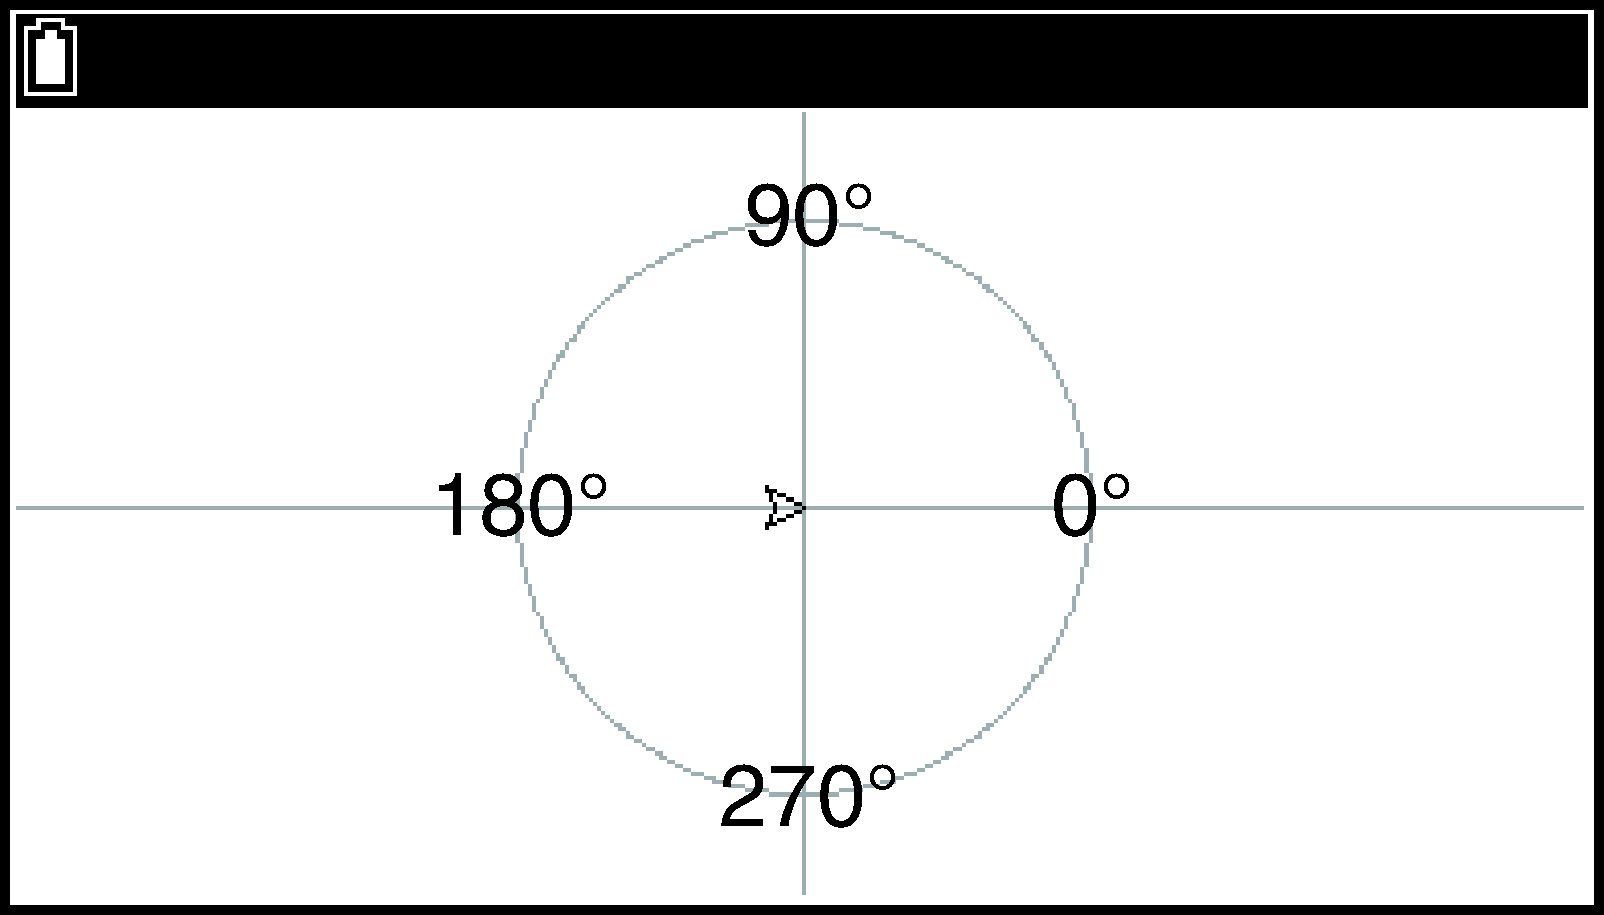
a argument: Specifies the orientation of the head of the turtle in degrees (0° ≤ a < 360°).
Type: int or float
forward()
Moves the turtle forward in the direction of the current turtle head orientation. The head orientation does not change.
Syntax: forward(n)
n argument: Specifies the distance of turtle movement.
Type: int or float
backward()
Moves the turtle back, in the direction opposite that of the current turtle head orientation. The head orientation does not change.
Syntax: backward(n)
The argument n is the same as that for .
Moving to Specified Coordinates
goto(,)
Moves the turtle to the specified coordinates. The head orientation does not change.
Syntax: goto(,)
, arguments: Specify the coordinates (, ) of the turtle’s destination.
, type: int or float
setposition(,)
Moves the turtle to the specified coordinates. The head orientation does not change.
Syntax: setposition(,)
The , arguments are the same as those for .
setx()
Moves the turtle to the specified -coordinate without changing its current -coordinate. The head orientation does not change.
Syntax: setx()
argument: Specifies -coordinate of the turtle’s destination.
type: int or float
sety()
Moves the turtle to the specified -coordinate without changing its current -coordinate. The head orientation does not change.
Syntax: sety()
argument: Specifies -coordinate of the turtle’s destination.
type: int or float
home()
Moves the turtle to the origin (0,0) and returns the head to its initial orientation (rightward).
Syntax: home() (no argument)
Drawing Circles and Text
circle()
Draws a circle or an arc from the current turtle location. The circle or arc is drawn counterclockwise starting from the current turtle location. The figure on the right shows the relationship between the arguments in the following syntax and the arc being drawn, assuming that the current position of the turtle is (, ).
radius
extent
(, )
Syntax: circle(radius[,extent=360])
radius argument: Specifies a circle radius.
Type: int or float
extent argument: Specifies an arc angle in degrees.
Type: int or float
How to specify: For example, to set the extent to 180, use circle(radius,extent=180) or circle(radius,180).
Initial default: 360 (360 when omitted)
write()
Draws a text string from the current turtle location.
Syntax: write(text)
text argument: Specifies a text string.
There are no restrictions on the text argument’s type. Any text string can be entered by enclosing it within double quotes (" ").
Specifying the Turtle Status
shape()
Use this function to specify the turtle shape or to return the current turtle shape. There are two available turtle shapes.
|
"classic" |
"turtle" |
|---|---|
|
|
|
Syntax 1: shape(name)
Use this syntax to specify the shape of the turtle.
name argument: Uses keywords (classic, turtle) to specify the turtle shape.
Type: str
How to specify: For example, if you want a "classic" (arrow) shaped turtle, specify shape(name="classic") or shape("classic").
Initial default: "classic"
Syntax 2: shape() (no argument)
Returns the currently specified turtle shape.
speed()
Specifies the drawing speed of the turtle (the speed the turtle moves when the pen is down) or returns the currently specified turtle drawing speed.
Syntax 1: speed(speed)
Specifies the speed of turtle drawing. The speed argument can be a real number or a keyword.
Specifying by real number: Input a value from 0 to 10. 0 is the fastest speed. For non-zero values, a greater number corresponds to a faster speed. The setting defaults to 0 if a value outside of the allowable range is specified.
Type: int or float
Initial default: 5
Specifying by keyword: Use the keyword strings shown in the table below.
|
Keyword |
Corresponding Real Number |
|---|---|
|
fastest |
0 |
|
fast |
10 |
|
normal |
6 |
|
slow |
3 |
|
slowest |
1 |
Type: str
How to specify: To specify slow, for example, use speed(speed="slow"), or speed("slow")
Initial default: speed=None
Syntax 2: speed() (no argument)
Returns the real number that corresponds to the turtle’s currently specified drawing speed.
showturtle()
Displays the turtle on the drawing screen.
Syntax: showturtle() (no argument)
hideturtle()
Hides the drawing screen turtle.
Syntax: hideturtle() (no argument)
Get Status
isvisible()
Returns the current turtle show/hide status (Show: True, Hide: False).
Syntax: isvisible() (no argument)
isdown()
Returns the current pen state (Pen down: True, Pen up: False).
Syntax: isdown() (no argument)
xcor()
Returns the -coordinate of the turtle’s current location.
Syntax: xcor() (no argument)
ycor()
Returns the -coordinate of the turtle’s current location.
Syntax: ycor() (no argument)
position()
Returns the turtle’s current location (, coordinates).
Syntax: position() (no argument)
distance(,)
Returns the linear distance from the turtle’s current location to the specified coordinate.
Syntax: distance(,)
, arguments: Specify the coordinates (, ) of the point to which you want to check the linear distance from the turtle’s current location.
, type: int or float
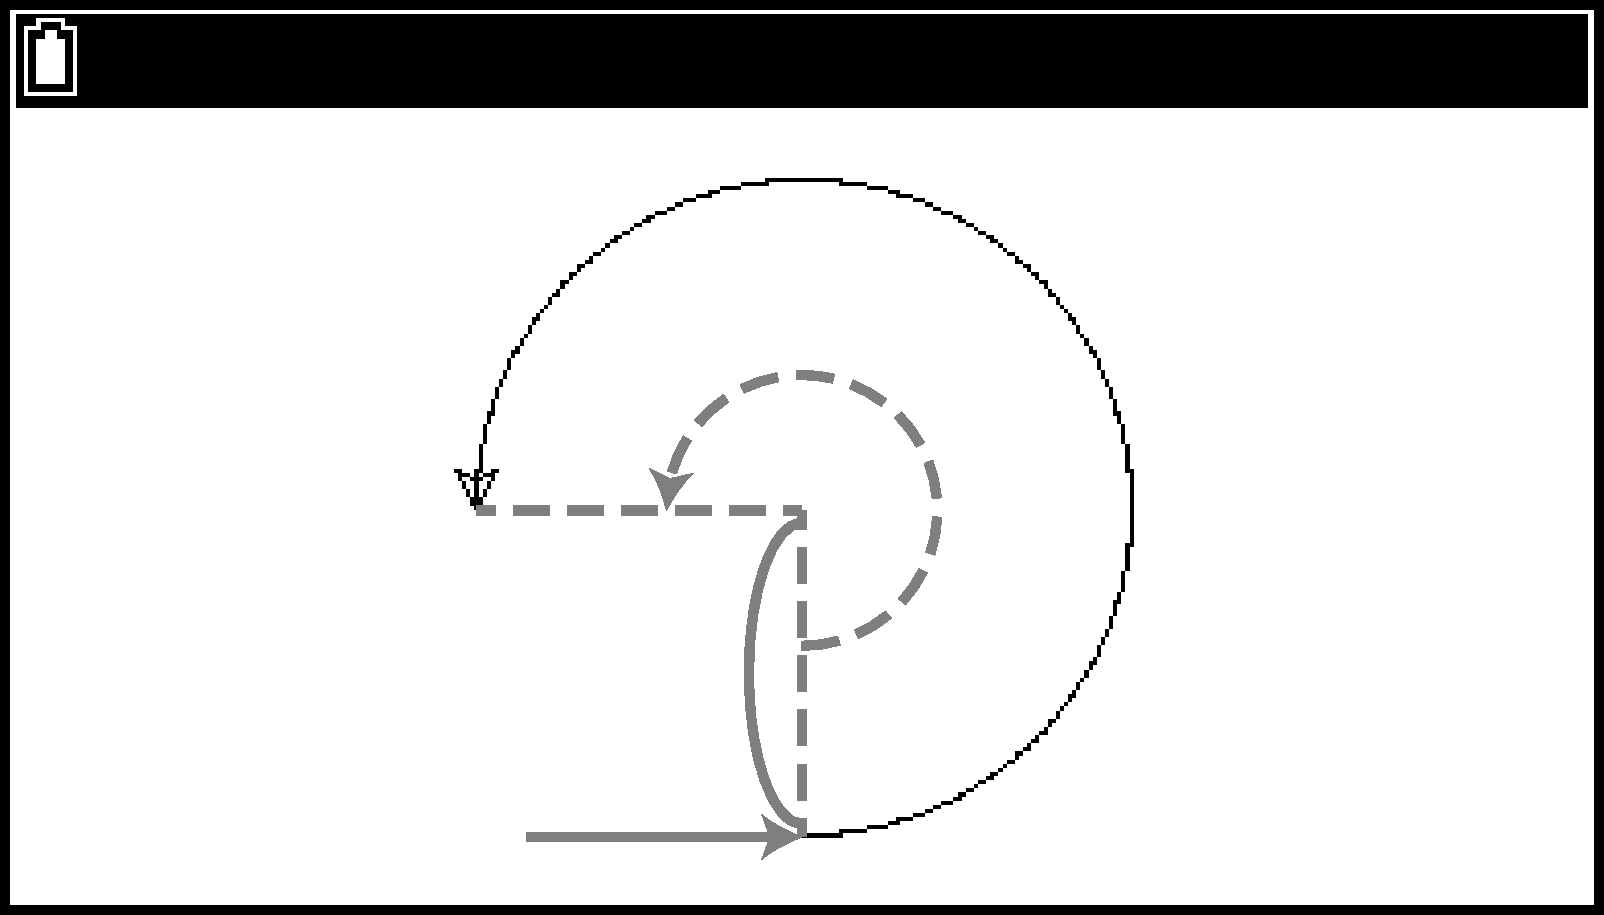
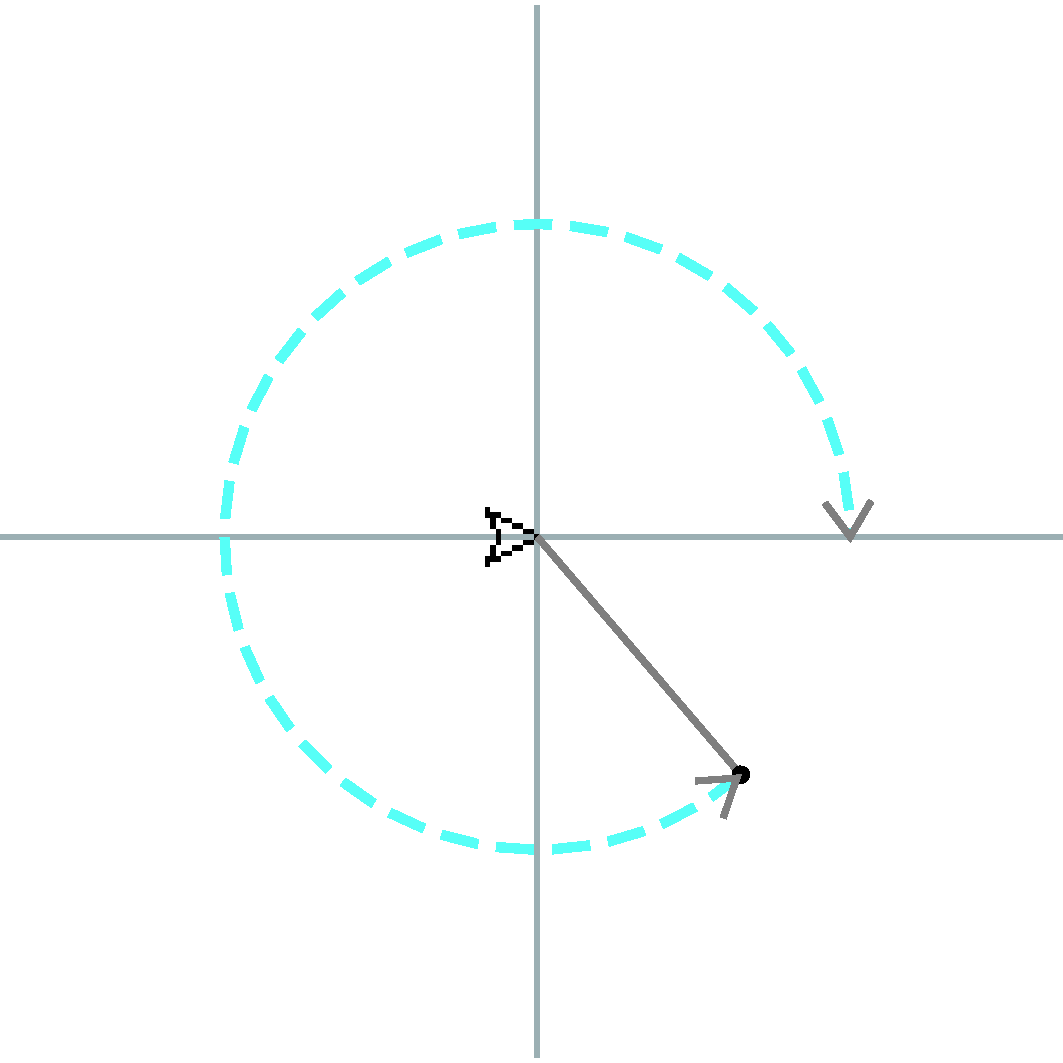
towards(,)
Returns the angle of the arc created by the current turtle location and the specified coordinates (See Note below).
Syntax: towards(,)
, arguments: Specify the coordinates (, ) at which you want to check the angle with the current turtle location.
, type: int or float
Note
If the current turtle location is (, ) and the specified coordinates are (, ), then the angle of the arc shown by the dashed line in the figure below will be returned by the towards(,) function.
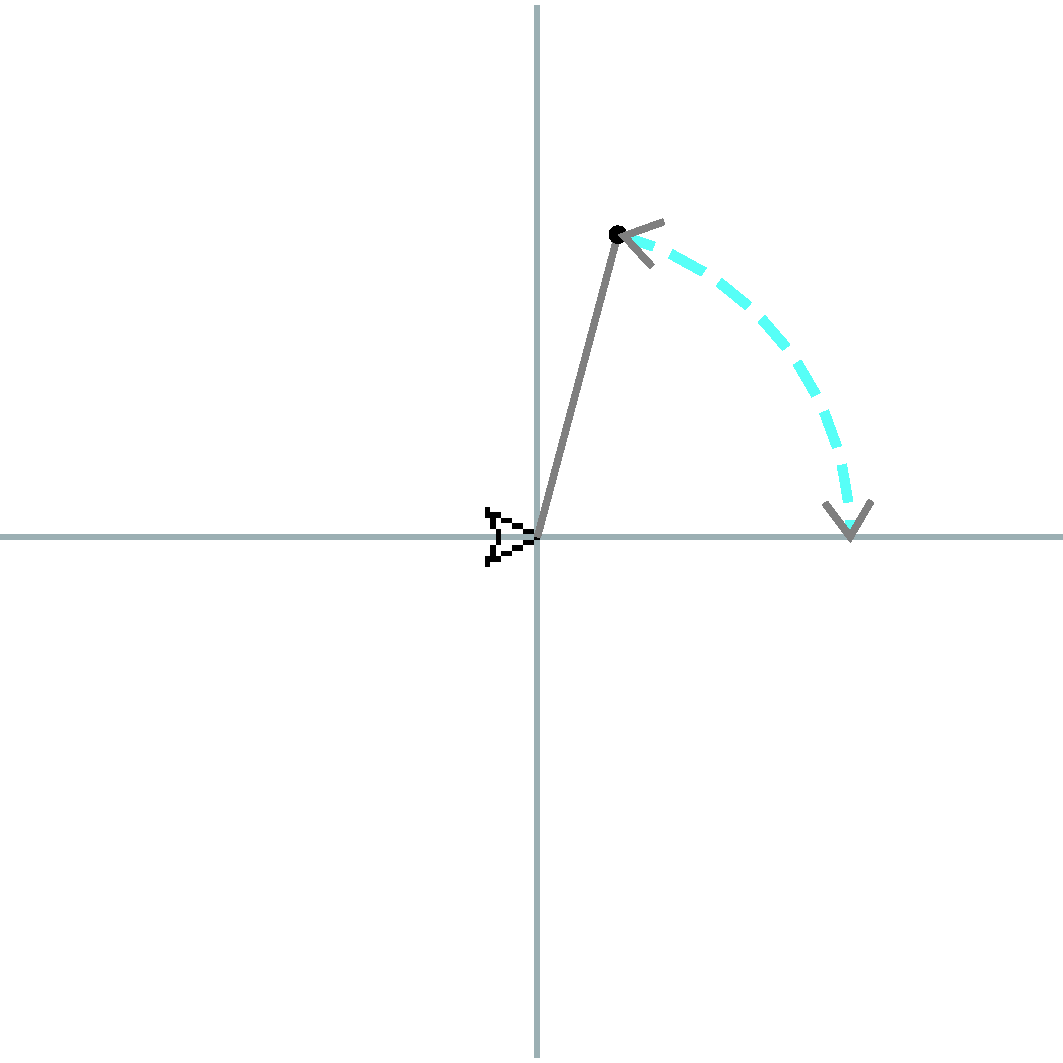
towards(,)
(,)
(, )
< , <
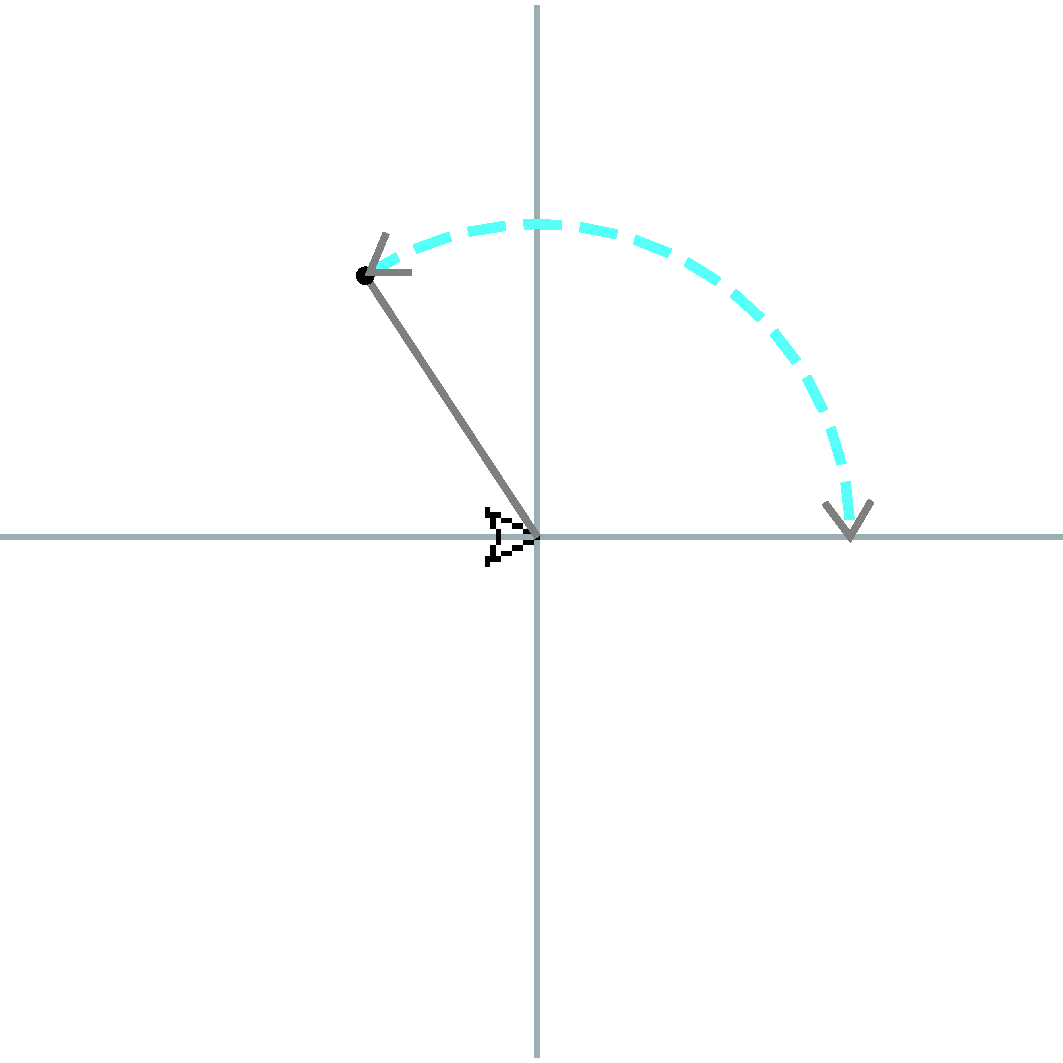
towards(,)
(,)
(, )
< , <
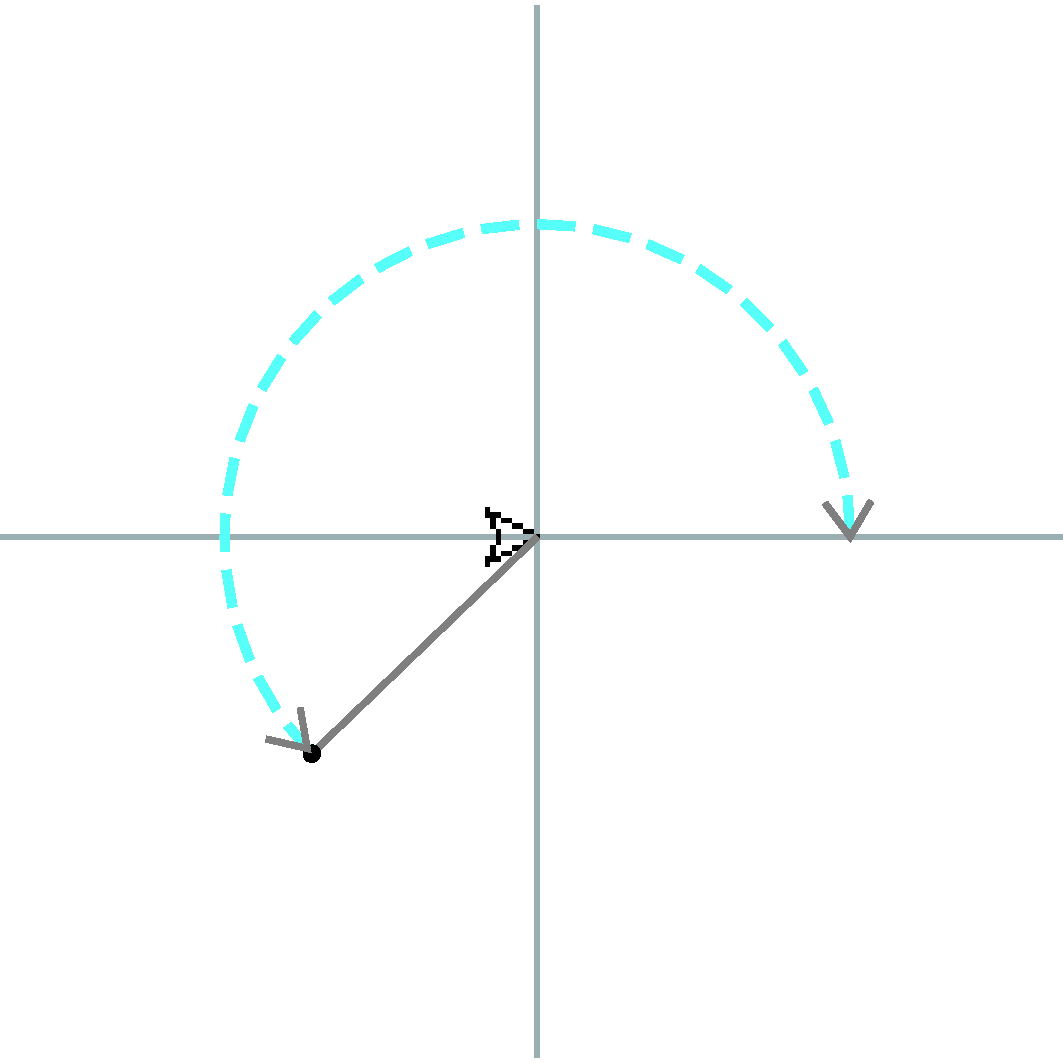
towards(,)
(,)
(, )
< , <
towards(,)
(,)
(, )
< , <
When = , = , towards(,) returns 0.
heading()
Returns the current turtle orientation. See setheading() for information about turtle orientation.
Syntax: heading() (no argument)
Turtle Reset and Drawing Screen Clear
reset()
Clears the contents of the drawing screen and initializes the turtle.
Syntax: reset() (no argument)
The initial status of the turtle is shown in the table below.
|
Status Type |
Initial Default |
|---|---|
|
Location |
(0,0) |
|
Orientation |
0° (east, right) |
|
Color |
(0,0,0) (black) |
|
Pen up/down |
Down |
|
Pen drawing width |
1 |
|
Turtle drawing speed |
5 |
|
Turtle show/hide |
Show |
|
Turtle shape |
"classic" |
clear()
Clears the contents of the drawing screen while preserving the current turtle state.
Syntax: clear() (no argument)
casioplot Module
The casioplot module is a CASIO-original module that includes draw functions for drawing pixels and character in the Python app. To input these functions, use C > [casioplot]. The functions described below are included in the casioplot module. Arguments enclosed in square brackets ([ ]) in a function syntax can be omitted.
show_screen() (No argument)
Displays the drawing screen. For details about displaying the drawing screen, drawing screen refresh and clear timing, and other information, see Drawing Screen.
Example: To display the drawing screen
from casioplot import *
show_screen()
clear_screen() (No argument)
Clears all draw contents from the drawing screen. This function is executed regardless of whether or not there are any draw contents on the drawing screen.
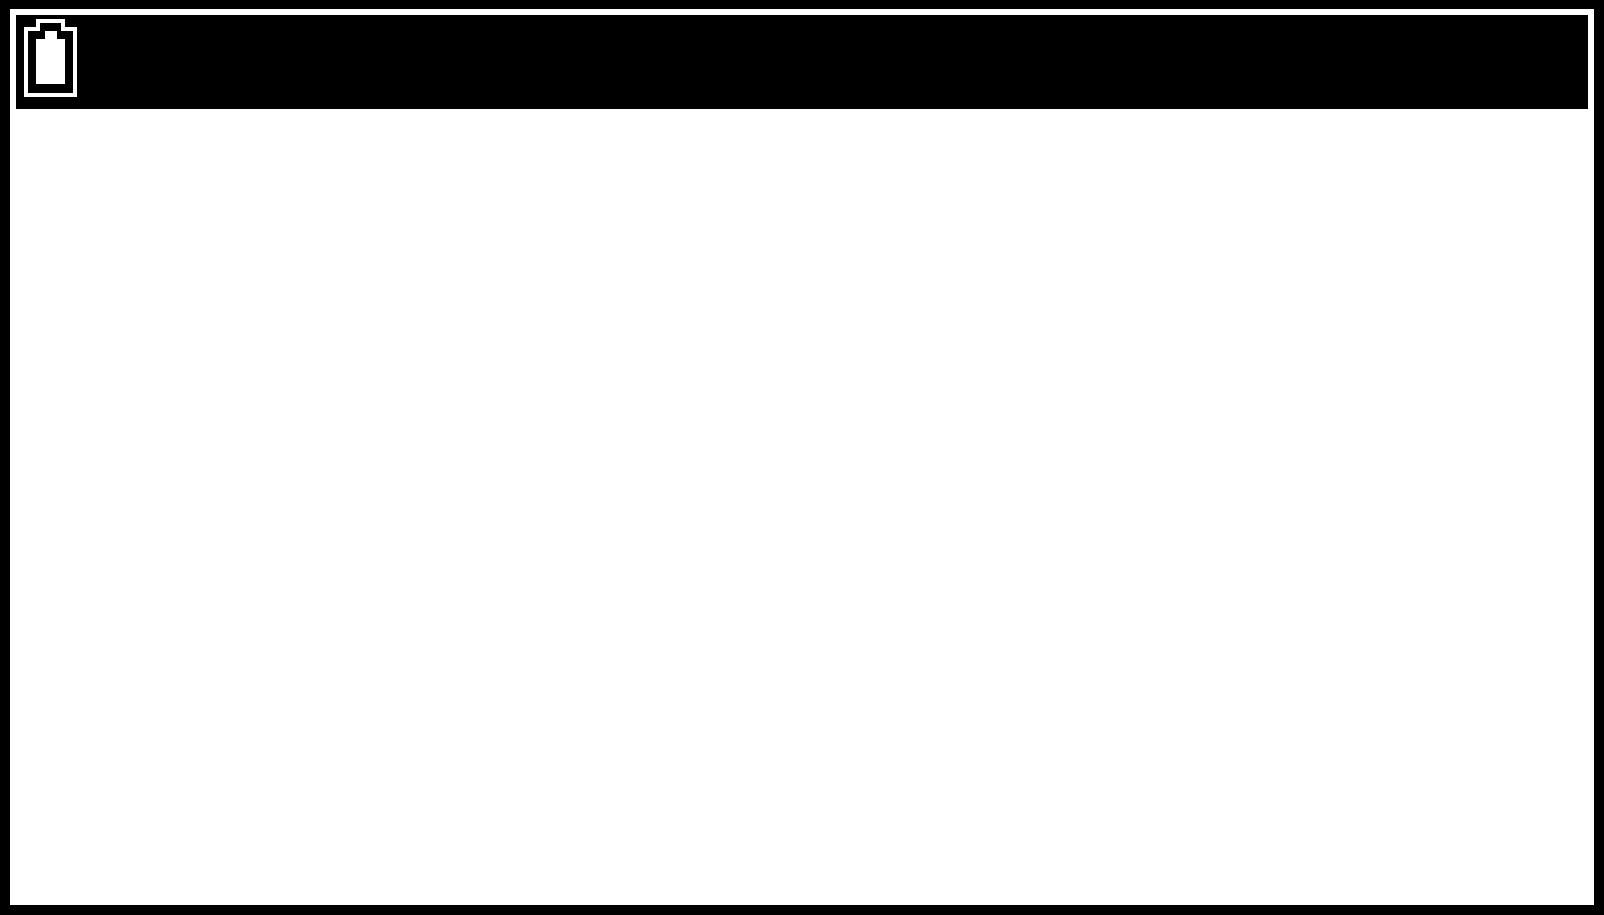
set_pixel(,[,color])
Draws a pixel of the specified color at the specified coordinates.
argument, argument:
Specifies the - and -coordinates of the pixel to be drawn. Only int type values within the following ranges can be specified: 0 ≤ ≤ 383, 0 ≤ ≤ 191
The figure below shows the relationship between coordinate values and locations on the drawing screen.
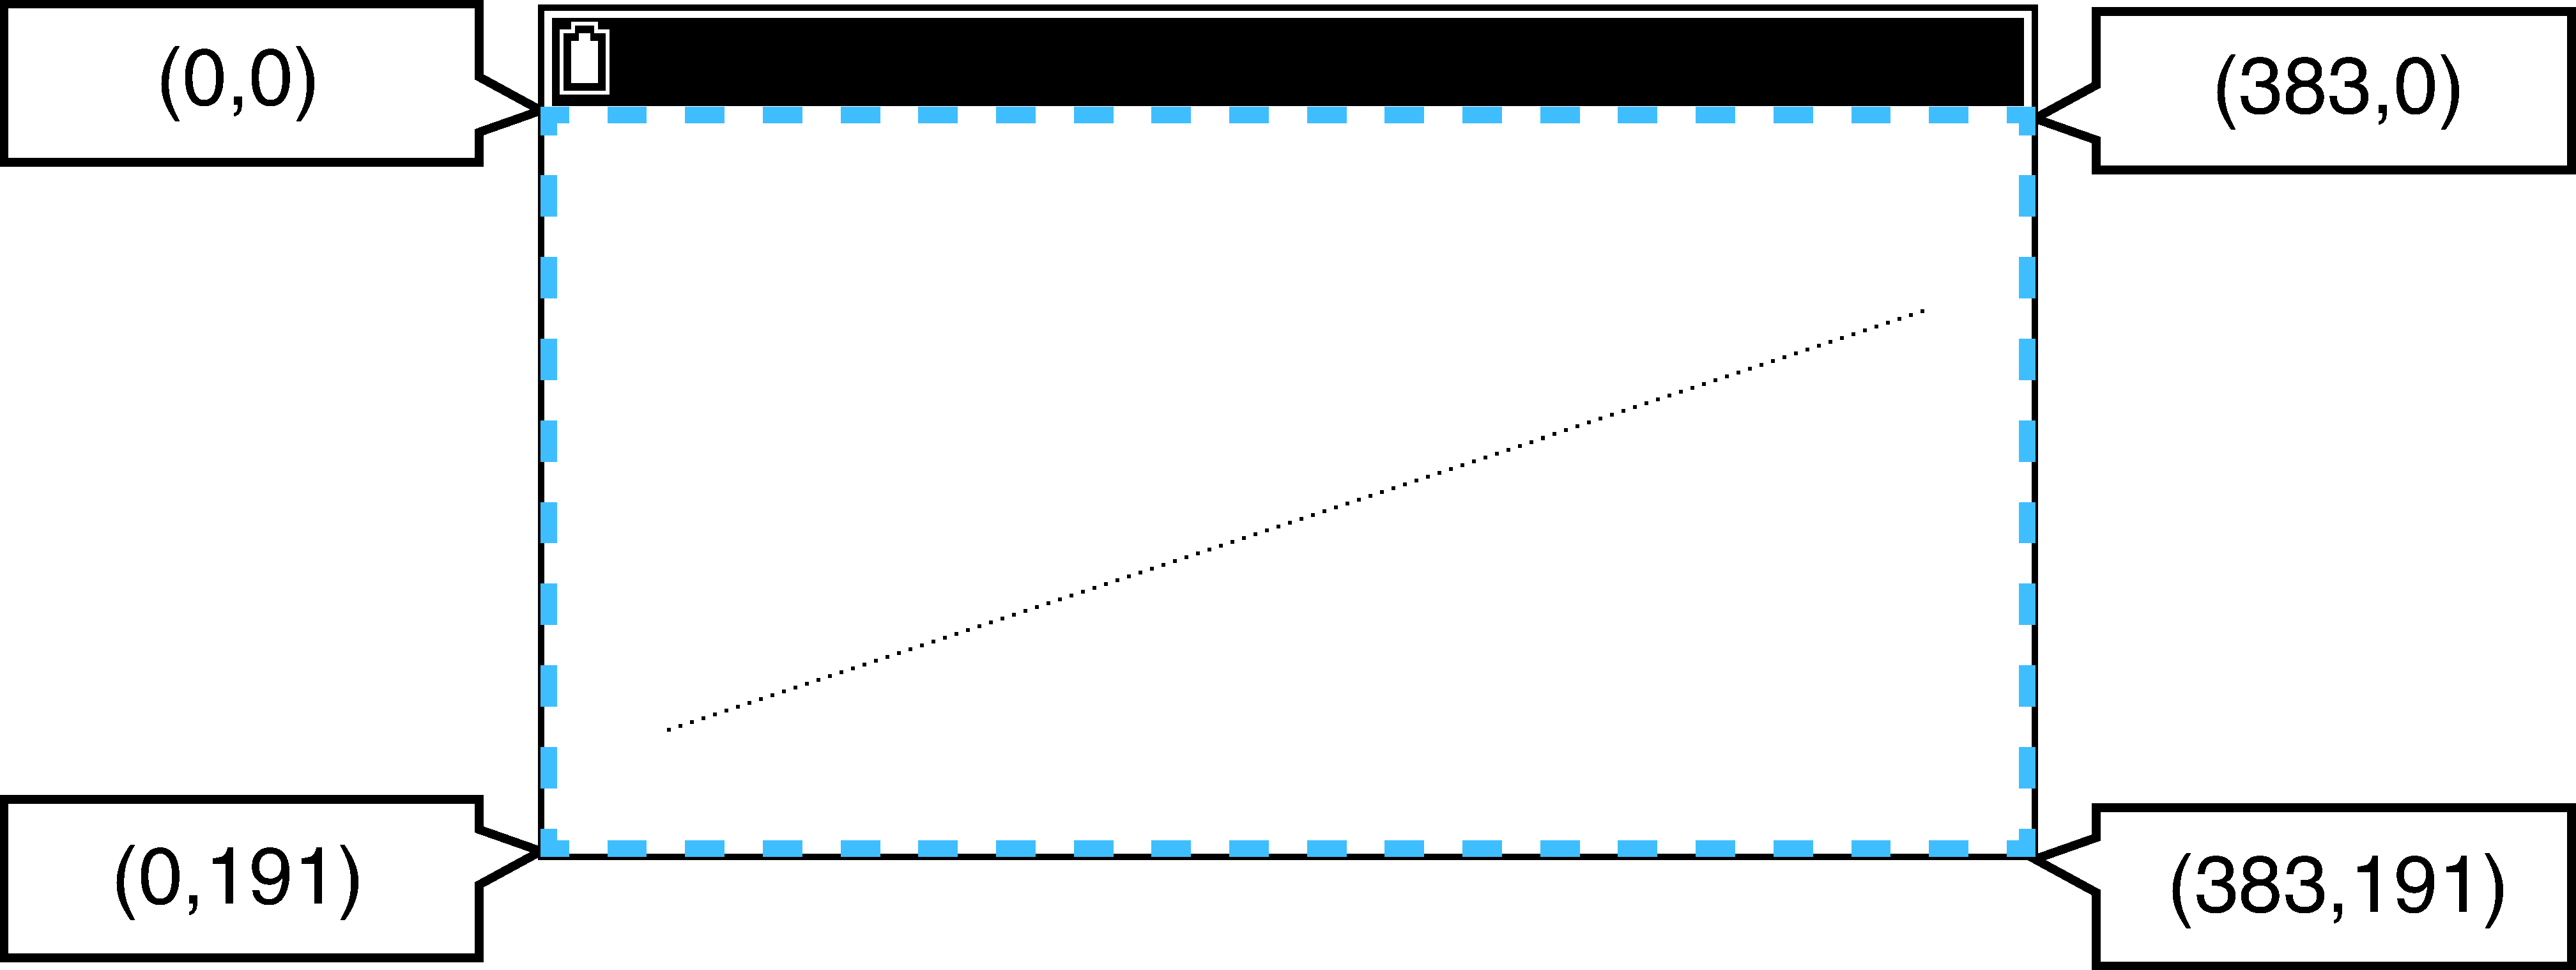
color argument:
Specifies the color of the pixel to be drawn. For details about this argument, see Draw Function color Argument.
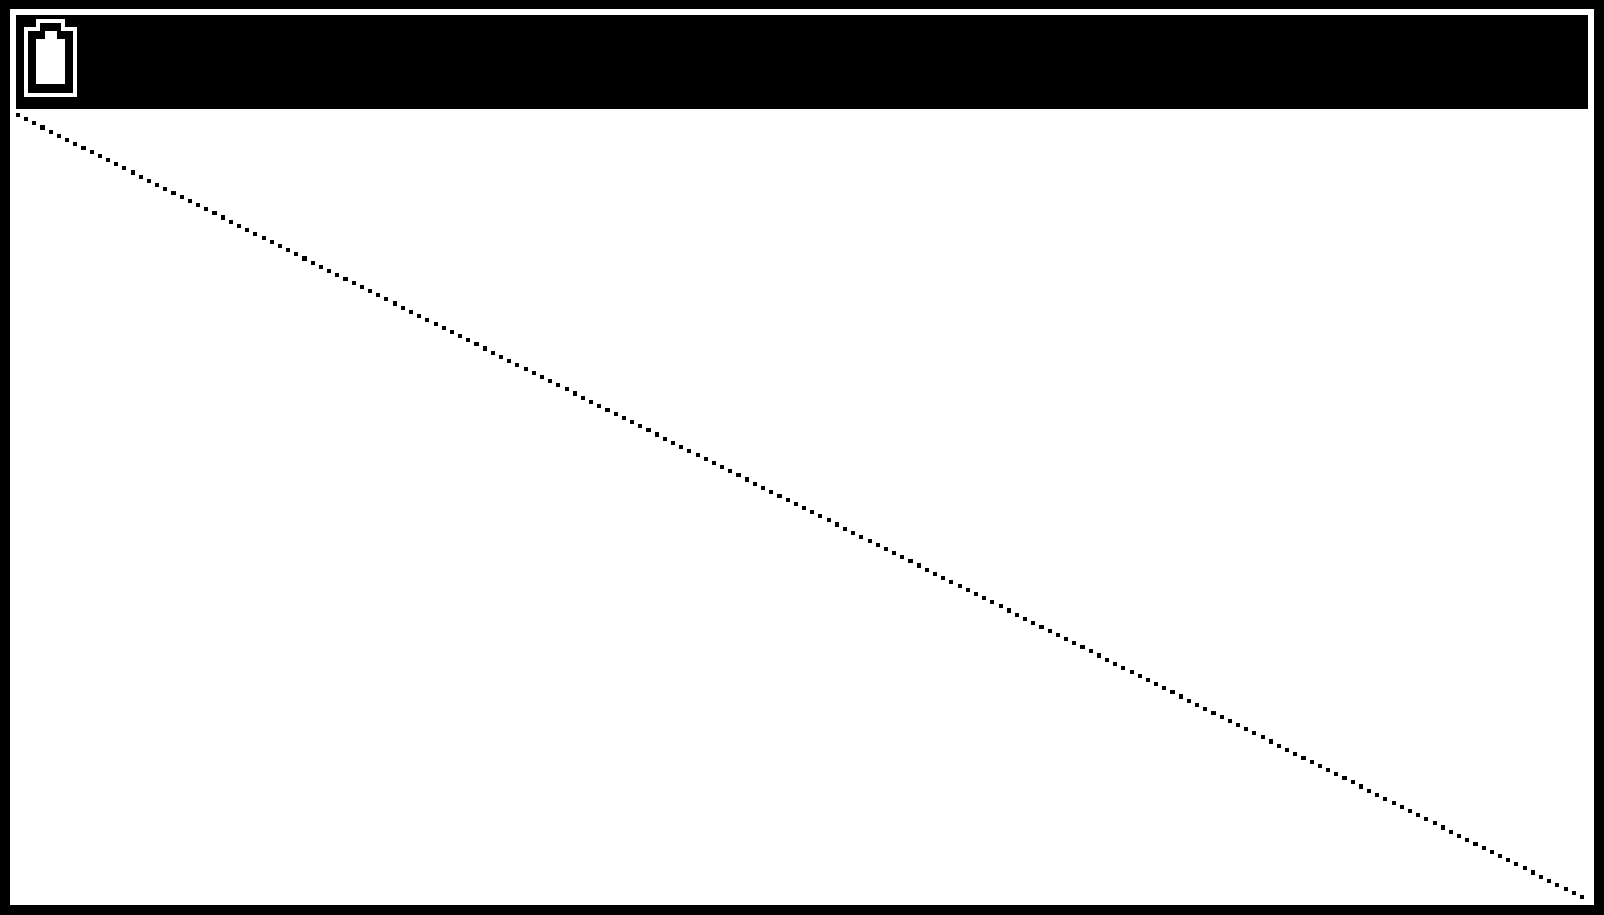
Example: To draw a straight line that runs from the upper left corner to the lower right corner of the display and display the drawing screen
from casioplot import *
for i in range(192):
set_pixel(i*2,i)
show_screen()
Note
If either the - or -coordinate value is outside of the allowable range, function execution will be ignored (nothing drawn, no error).
get_pixel(,)
Gets color information at the specified coordinates on the drawing screen.
argument, argument:
Specifies the - and -coordinates of the pixel whose color information is to be retrieved. The range and type of value that can be specified are the same as the -argument and -argument of . The retrieved color information is returned as a 256-gradation RGB value.
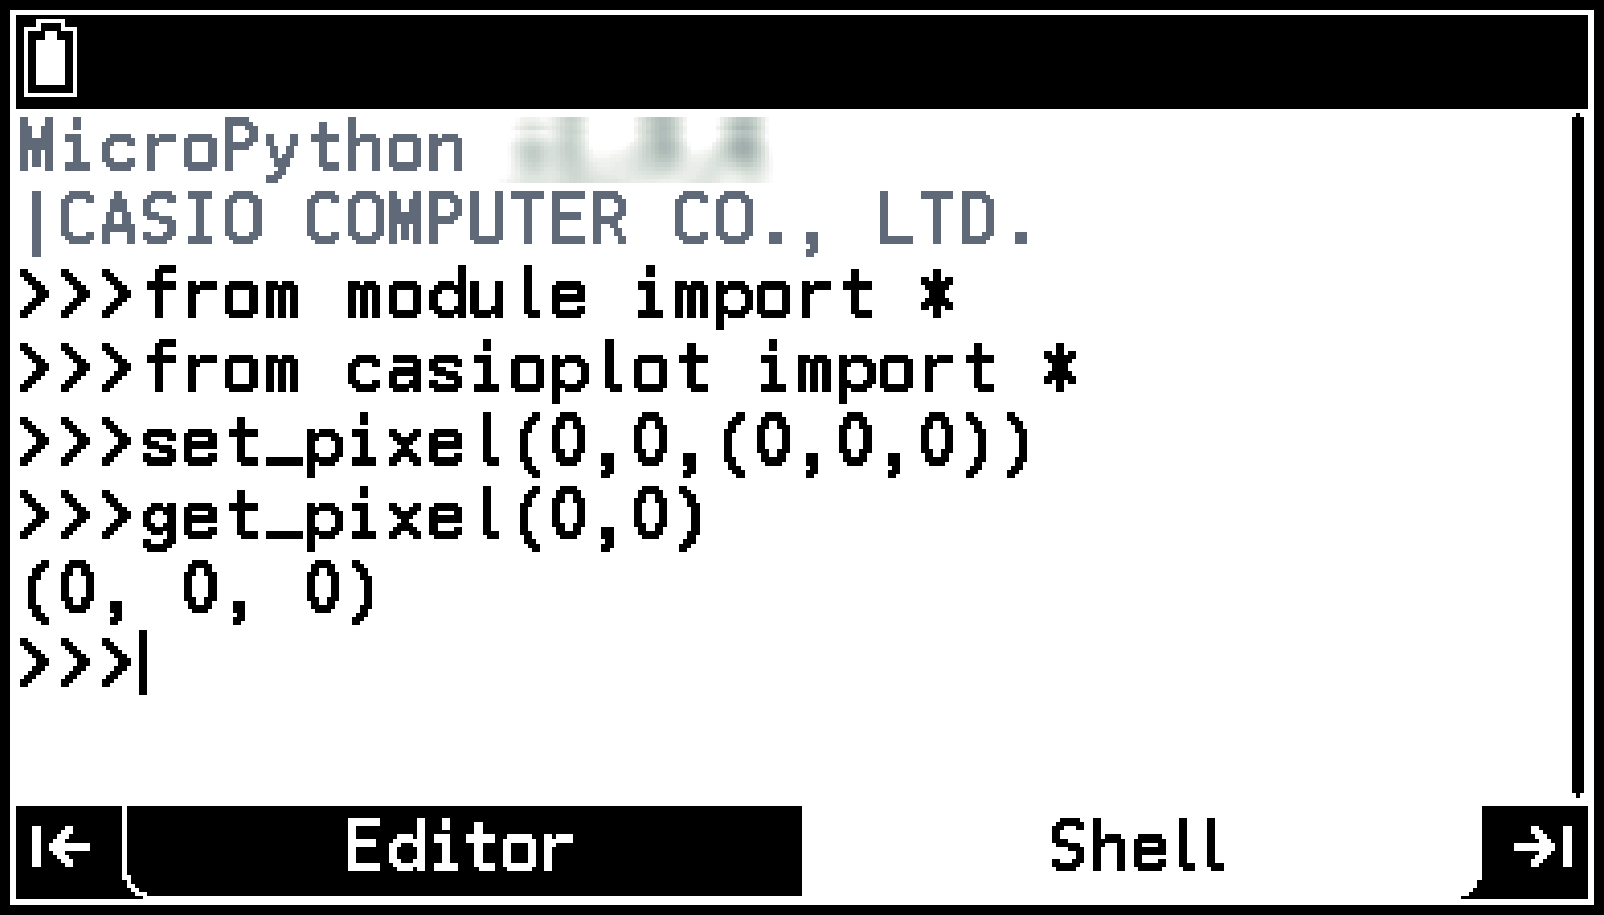
Example: To get color information (0,0,0) of coordinates (0,0)
from casioplot import *
set_pixel(0,0,(0,0,0))
get_pixel(0,0)
Note
If either the - or -coordinate value is outside of the allowable range, nothing is returned.
getkey() (No argument)
Returns the key code of the calculator key pressed at the time this function is executed.
The key codes of the keys are shown below.
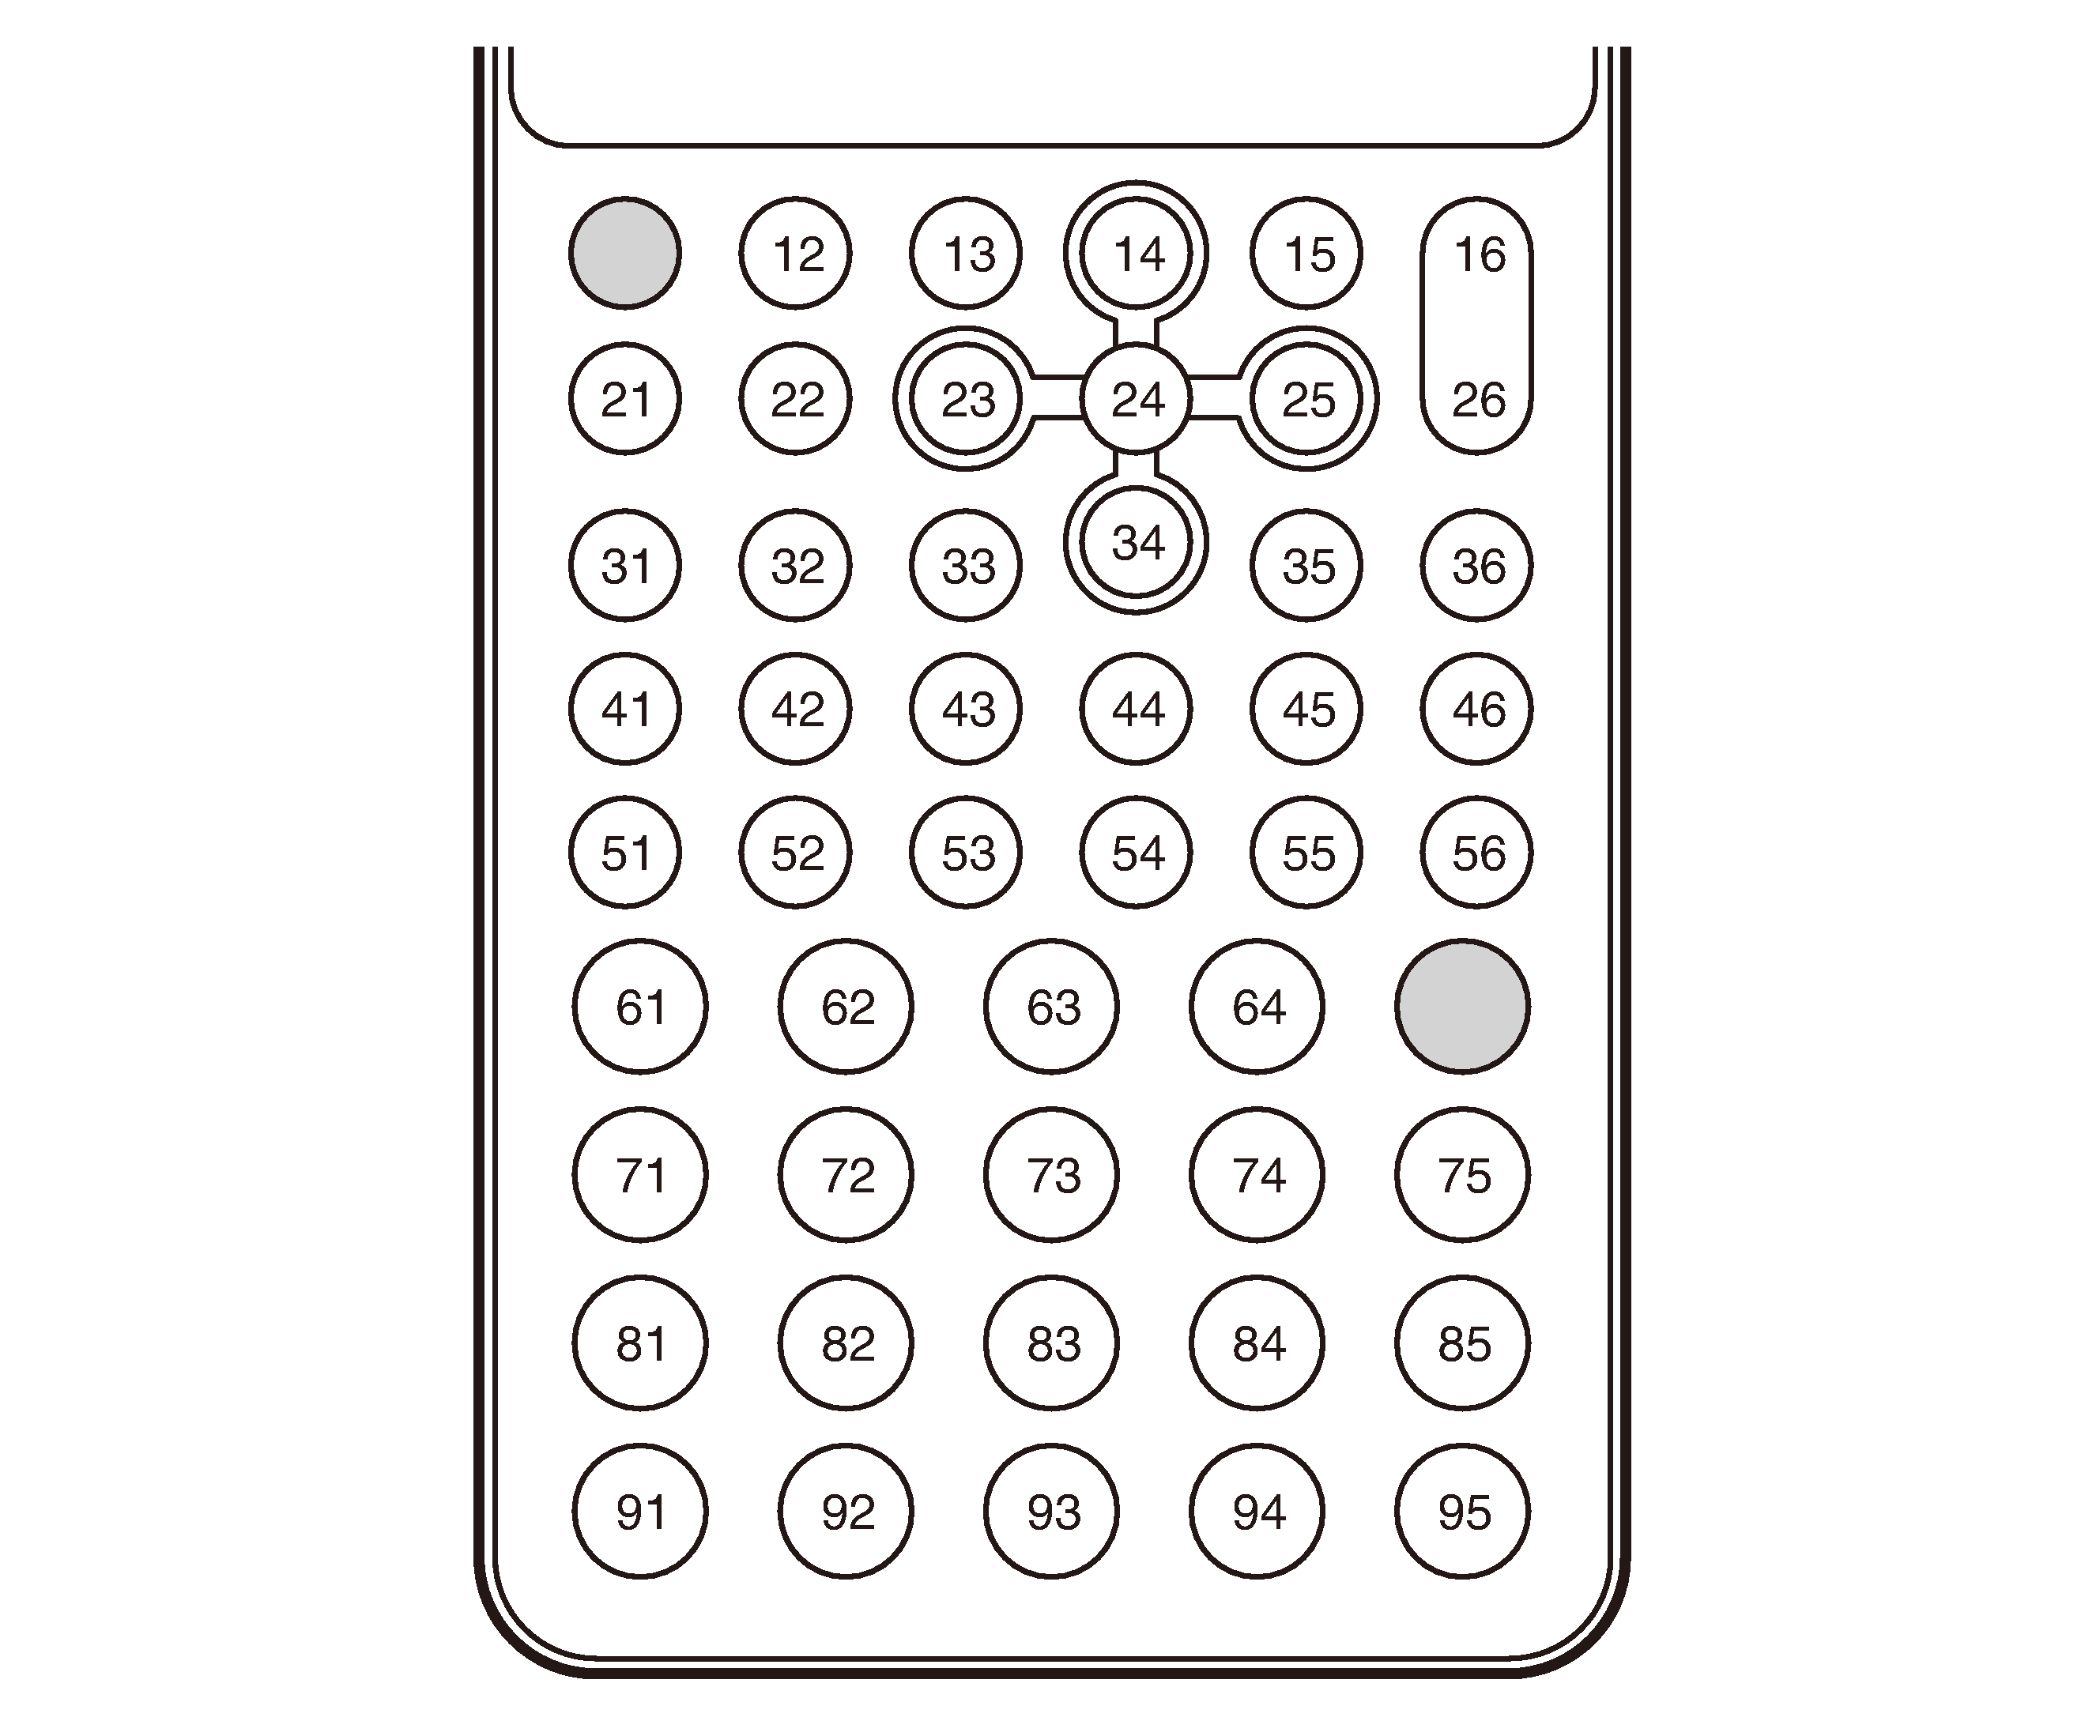
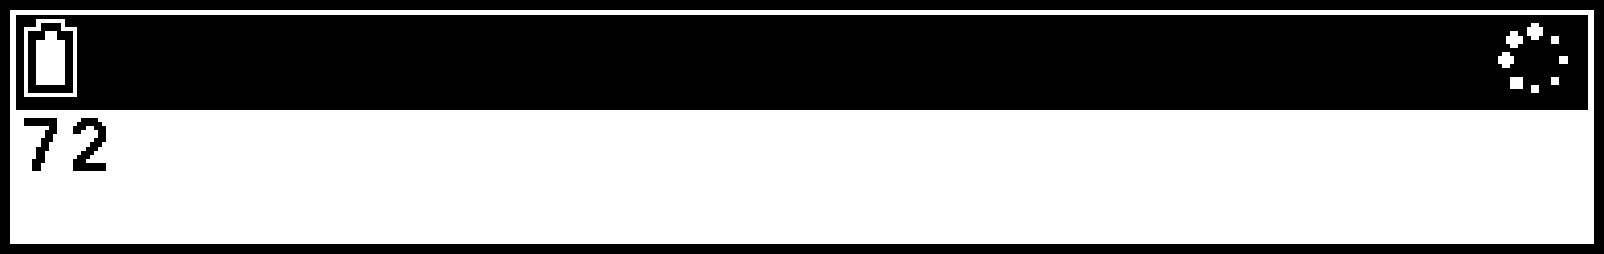
Example: To display the key code of the pressed key in the upper left corner of the drawing screen. For this example, the 5 key is held down.
from casioplot import *
while (True):
key=getkey()
clear_screen()
draw_string(0,0,str(key))
show_screen()
Note
To stop script execution, press a.
draw_string(,,[,color[,size]])
Draws a character string of the specified color at the specified coordinates.
argument, argument:
Specify the -coordinate and -coordinate of the upper left corner of the first character of the string to be drawn. The range and type of value that can be specified are the same as the -argument and -argument of .
argument:
Specifies the character string to be drawn as a str type. Only ASCII characters* can be displayed.
color argument:
Specifies the color of the character string to be drawn. For details about this argument, see Draw Function color Argument.
size argument:
Specifies one of the following as the character size of the character string to be drawn: “large”, “medium”, “small”. “medium” is applied when this argument is omitted.
A-Z a-z 0-9 ! " # $ % & ' ( ) * + , - . / : ; < = > ? @ [ \ ] ^ _ ` { | } ~ space
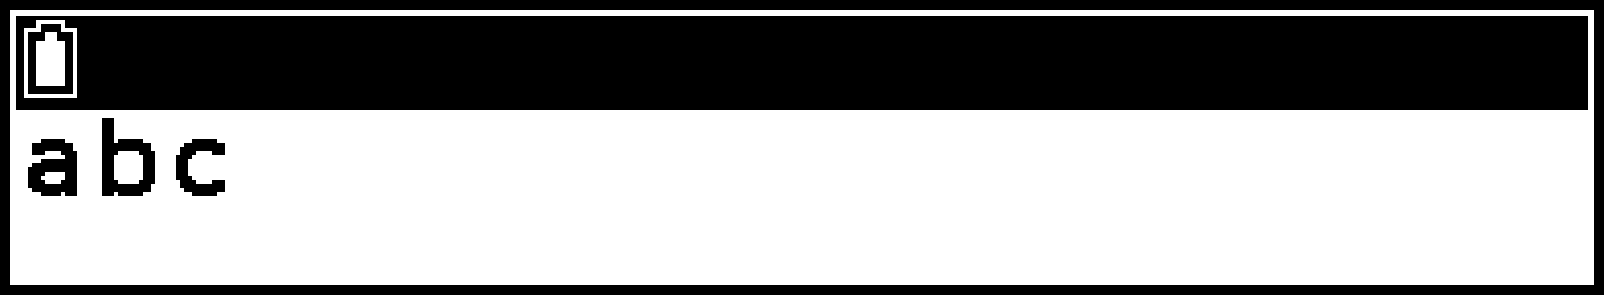
Example: To draw large size “abc” in black at coordinates (0,0) and display the drawing screen
from casioplot import *
draw_string(0,0,”abc”,(0,0,0),”large”)
show_screen()
Note
If both the - and -coordinate values are within the allowable range, the drawn character string will be displayed within the drawing screen range, even if it partially runs off of the drawing screen. If either the - or -coordinate value is outside of the allowable range, function execution will be ignored (nothing drawn, no error).
Draw Function color Argument
The color argument specifies the drawing color in 256 shades of RGB. For example, to specify black, input (0,0,0) or [0,0,0]. To specify white, input (255,255,255) or [255,255,255]. If color argument input is omitted, (0,0,0) is applied. Note that due to the performance of the display, the displayed color may be an approximation of the specified value.
Drawing Screen
Executing displays the drawing screen with the contents drawn by and are displayed.
Updating and Clearing the Drawing Screen
The drawing screen is updated each time is executed and cleared when is executed or when Shell is initialized. The currently displayed drawing screen is also updated when the py script finishes executing.
To return to Shell from the drawing screen, press b.
File Compatibility
py files can be shared between your calculator and a computer. A py file created with the calculator can be transferred to a computer for editing with a text editor or other software. A py file created on a computer can be transferred to and run on the calculator.
py files you create in the Python app are stored in the calculator’s storage memory (with file name extension py). For information about the procedure for transferring files between the calculator and a computer, see Connecting the Calculator to a Computer.
py Files Created and Saved with This Calculator
The formats of py files created and saved with this calculator are shown below.
Character Code:
ASCII code
Characters used:
ASCII*
Newline code:
CR+LF
Indent:
Spaces (two spaces for auto indent)
A-Z a-z 0-9 ! " # $ % & ' ( ) * + , - . / : ; < = > ? @ [ \ ] ^ _ ` { | } ~ space
Precautions When Using an Externally Created py File on this Calculator
The restrictions below apply whenever you are trying to use the calculator’s Python app to display (file name or file content), edit, or run a py file that was transferred to the calculator from a computer.
File Names
Your calculator recognizes only file names made up of ASCII characters.* A file name that includes any non-ASCII characters is not recognized.
The ASCII characters below are not supported.
\ / : * ? " < > | .
If the name of a py file transferred to storage memory from a computer or other source has a file name that is more than eight characters long, its name will abbreviated to eight characters when displayed on the storage memory information screen. (Example: AAAABBBBCC.py will become AAAABB~1.py.)
File Content Display and Editing
Opening a py file that satisfies conditions (A) and (B) below in the Python app will produce a normal display of all of the file contents. A py file that shows contents can be displayed normally and edited in the Python app.
-
py file written in ASCII characters only and saved using UTF-8 or other ASCII-compatible codes
-
py file with up to 300 lines, each line containing up to 255 characters
If a file is saved with character codes that are not compatible with ASCII, none of its contents will be displayed if you open it in the Python app. All of the characters will be replaced by spaces, or appear garbled.
The contents of a py file that exceeds the number of characters and/or number of lines specified above cannot be displayed in the Python app. If a file cannot be opened, use the command below to import it.
from (filename) import *
All tab codes in a py file will be replaced by two spaces when the file is opened in the Python app.
No type of newline codes (LF, CR, CR+LF) affect Python app display contents. All newline codes in a py file will be replaced by CR+LF (Windows standard newline code) when the file is opened in the Python app. Before transferring a py file that was edited and saved in the Python app to a computer for use on the computer, replace its newline codes with the type that is appropriate for the environment where the file will be used.
Running a py File
A py file in the file list that appears when you select T > [File] > [Open] may be executable with the Python app. Note the information below.
Running a py file that includes commands not supported by the calculator’s Python app will result in an error.
Using the Python app to open a py file created on a computer will cause characters and newline codes to be replaced. Because of this, opening a py file in the Python app, saving it, and running it, will change the content from the original py file, which may affect the running results. For details, see File Content Display and Editing.