3D Graph App
You can use the 3D Graph app to draw 3D graphs in three-dimensional space using -, -, and -coordinates. You can graph lines, planes, spheres, cylinders, and cones using built-in templates, or you can manually enter functions to draw lines, curved surfaces, solids of revolution, and other forms.
Operation Flow
Using a Built-in Template to Draw a Graph
Example 1:
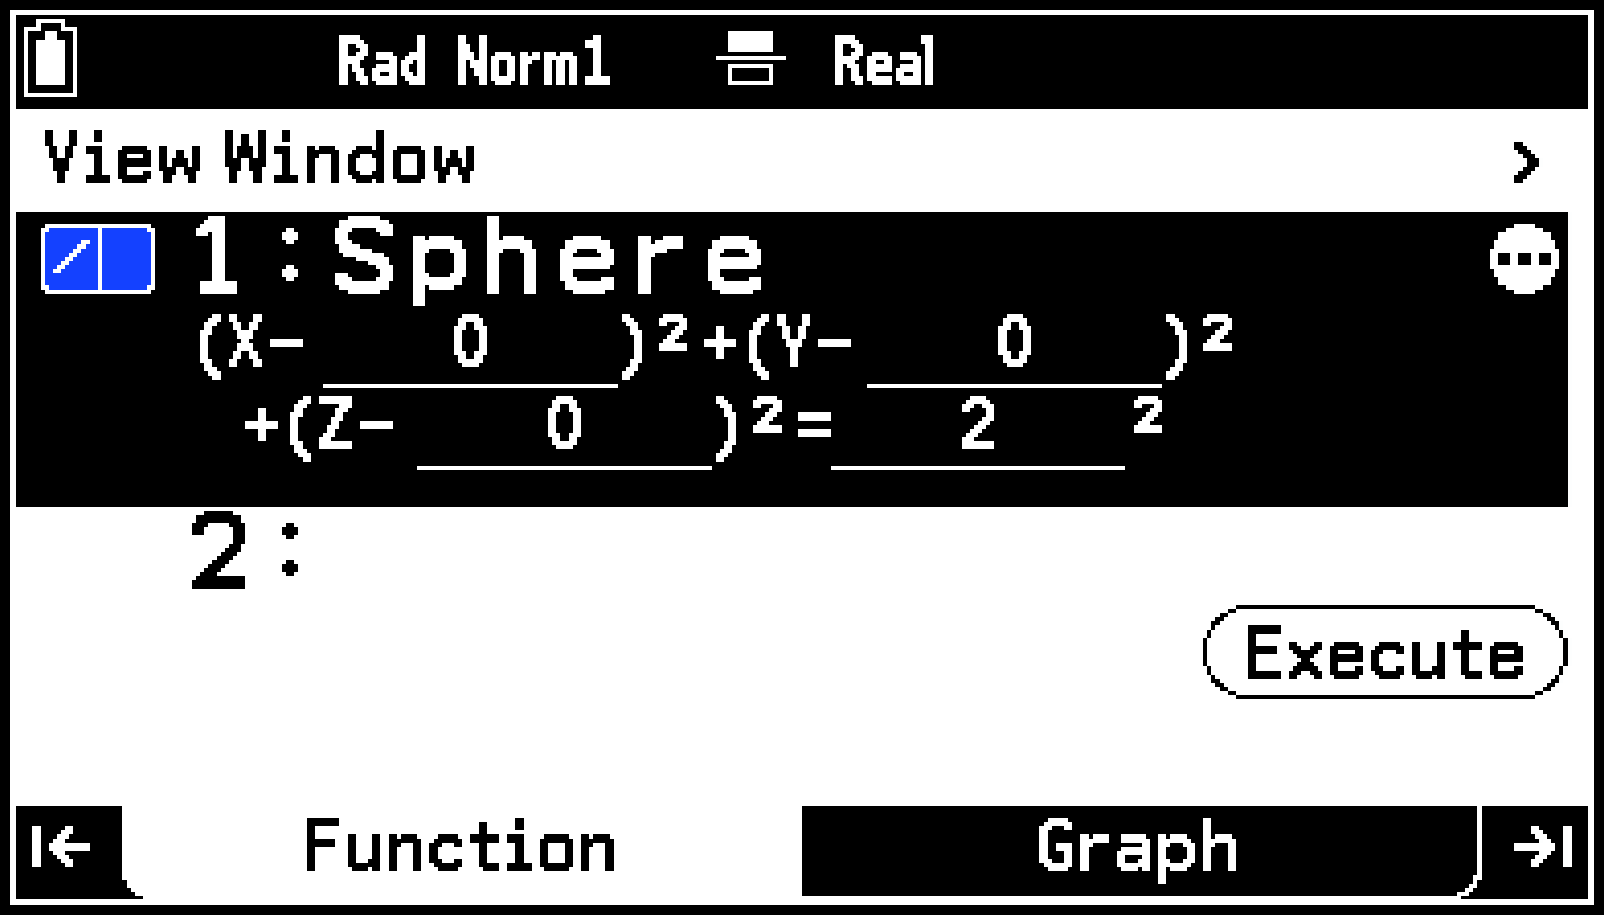
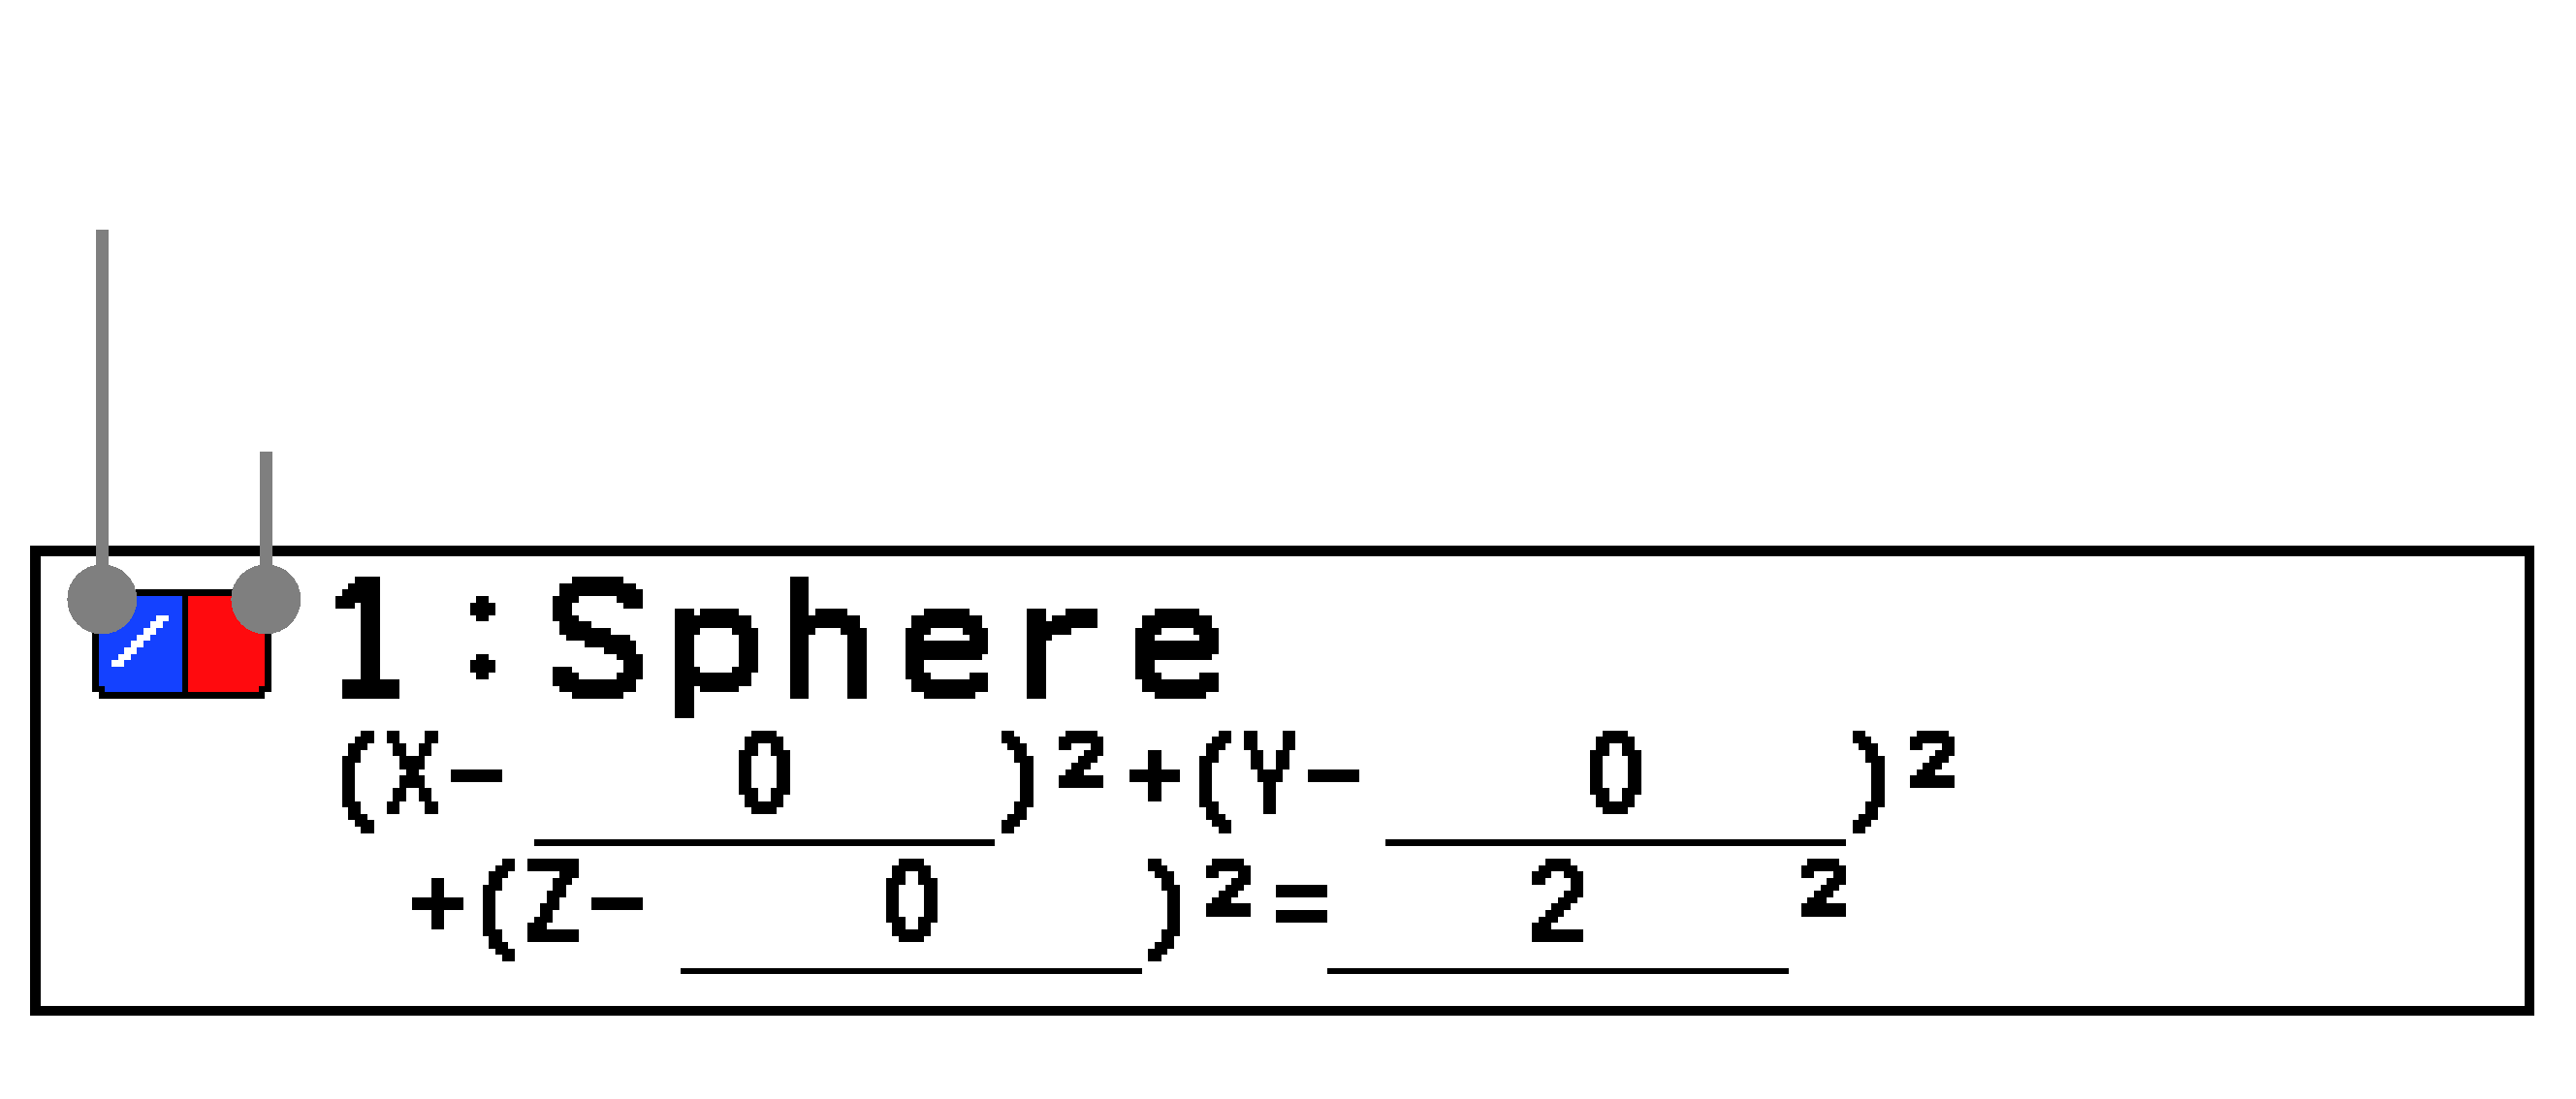
To select the [Sphere] > [ ] built-in template and draw a 3D graph of the sphere .
-
h > 3D Graph
-
Press O (or select T > [Enter Equation]) to display the Type menu.*
-
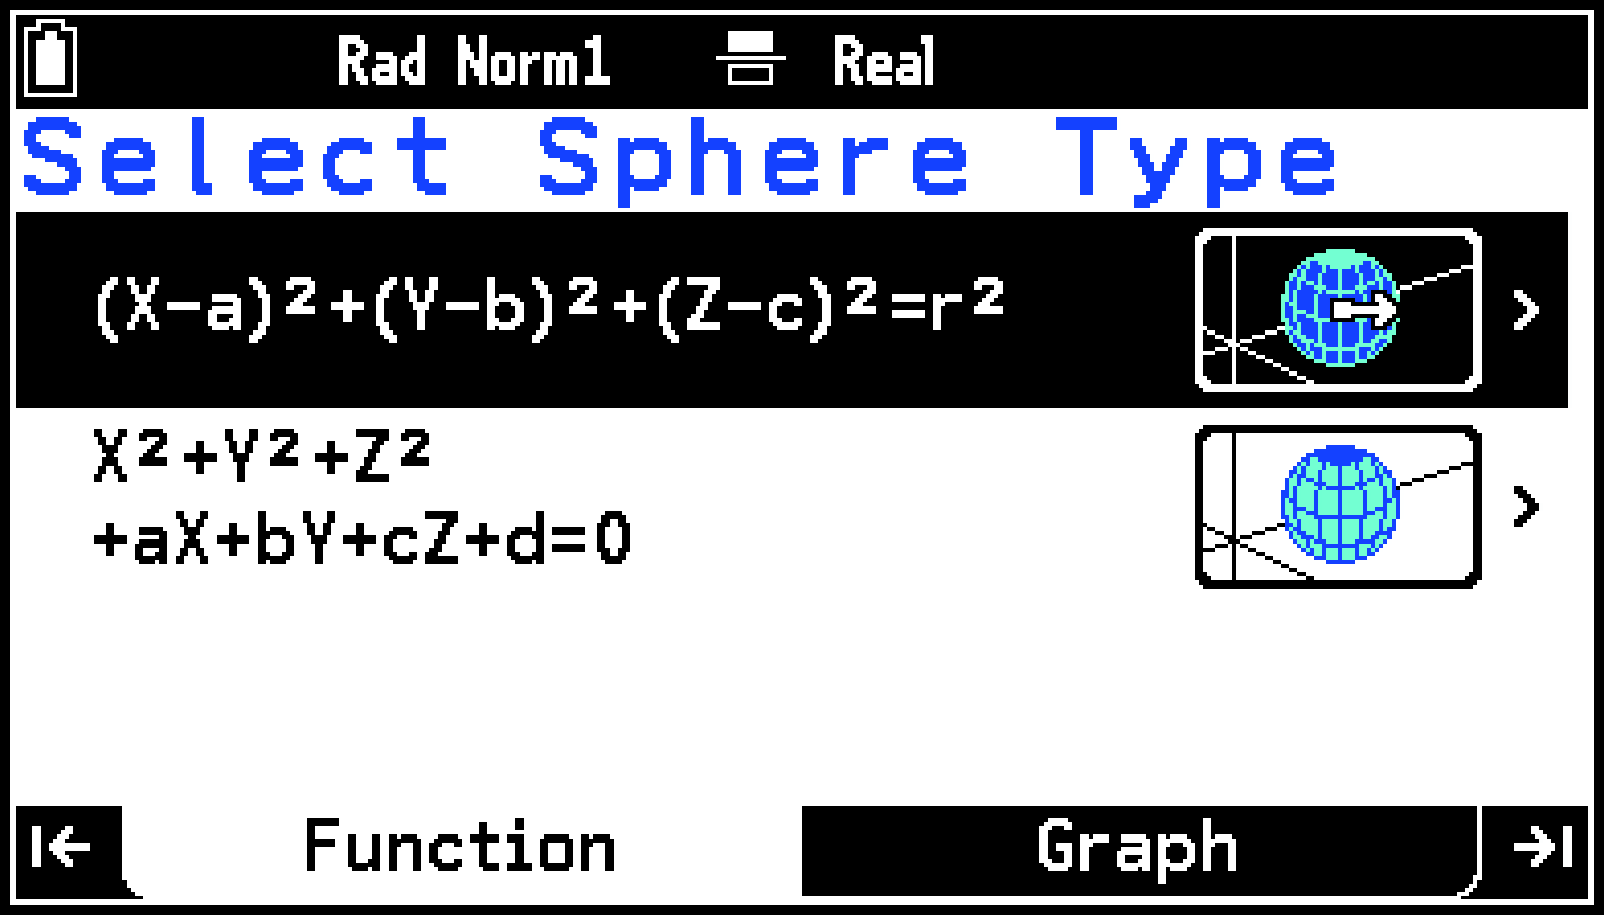
On the Type menu, select [Templates] > [Sphere].
-
Select [
]. -
Press O.
-
To draw a 3D graph using a built-in template you stored, press >.
-
Highlight
 and then press O.
 -
To return to the Function tab, press > or b.
This displays the Function tab.
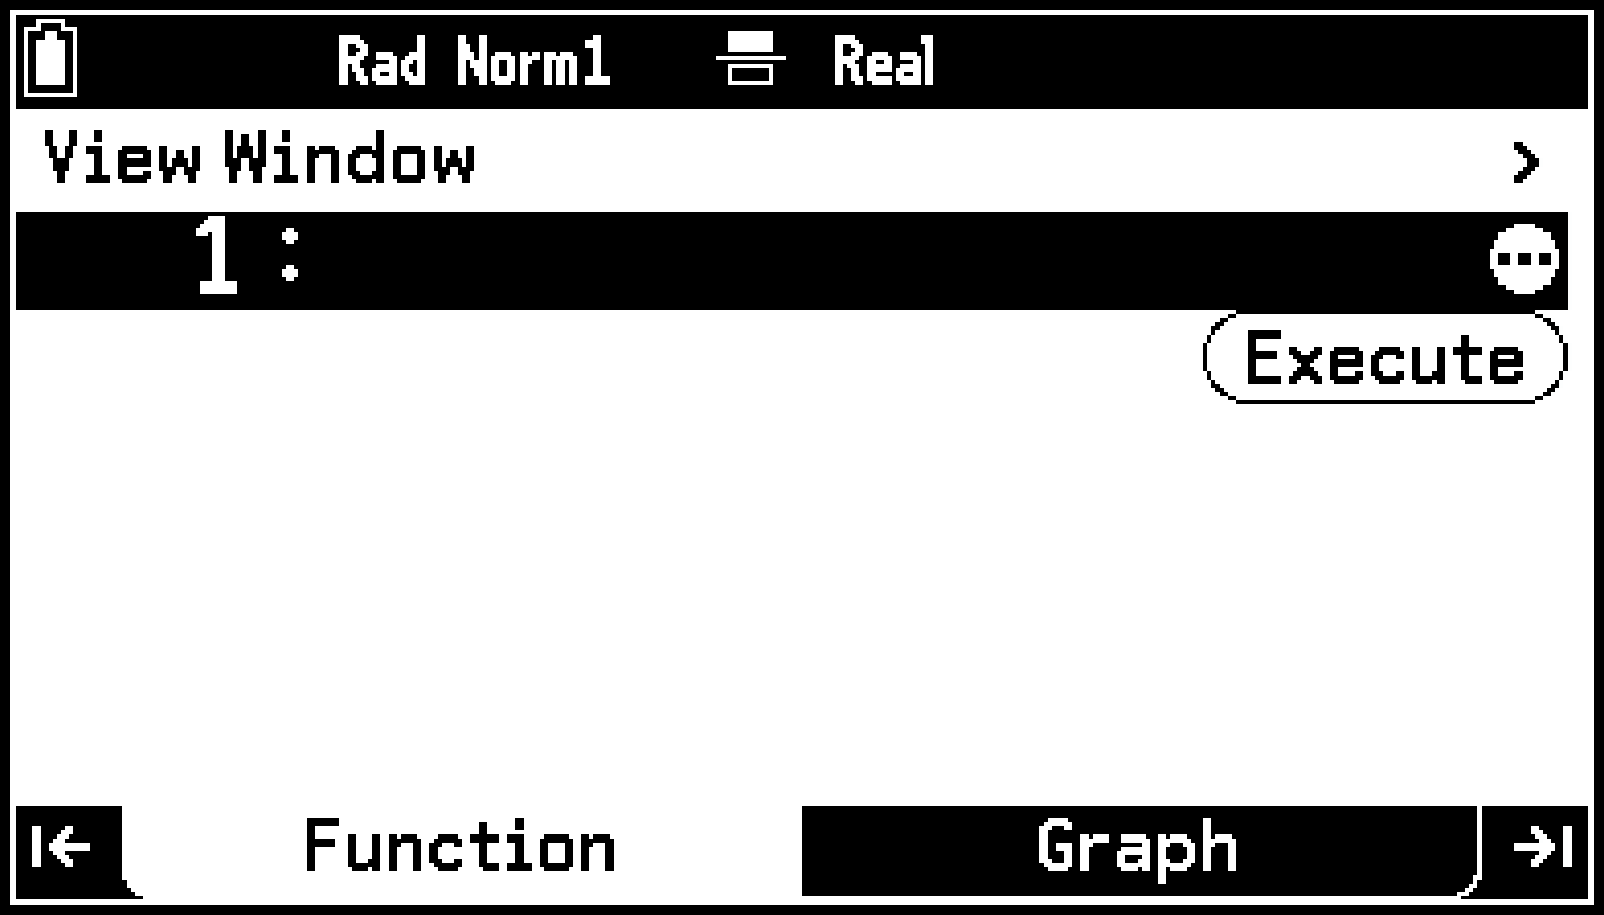
This displays the Type menu.
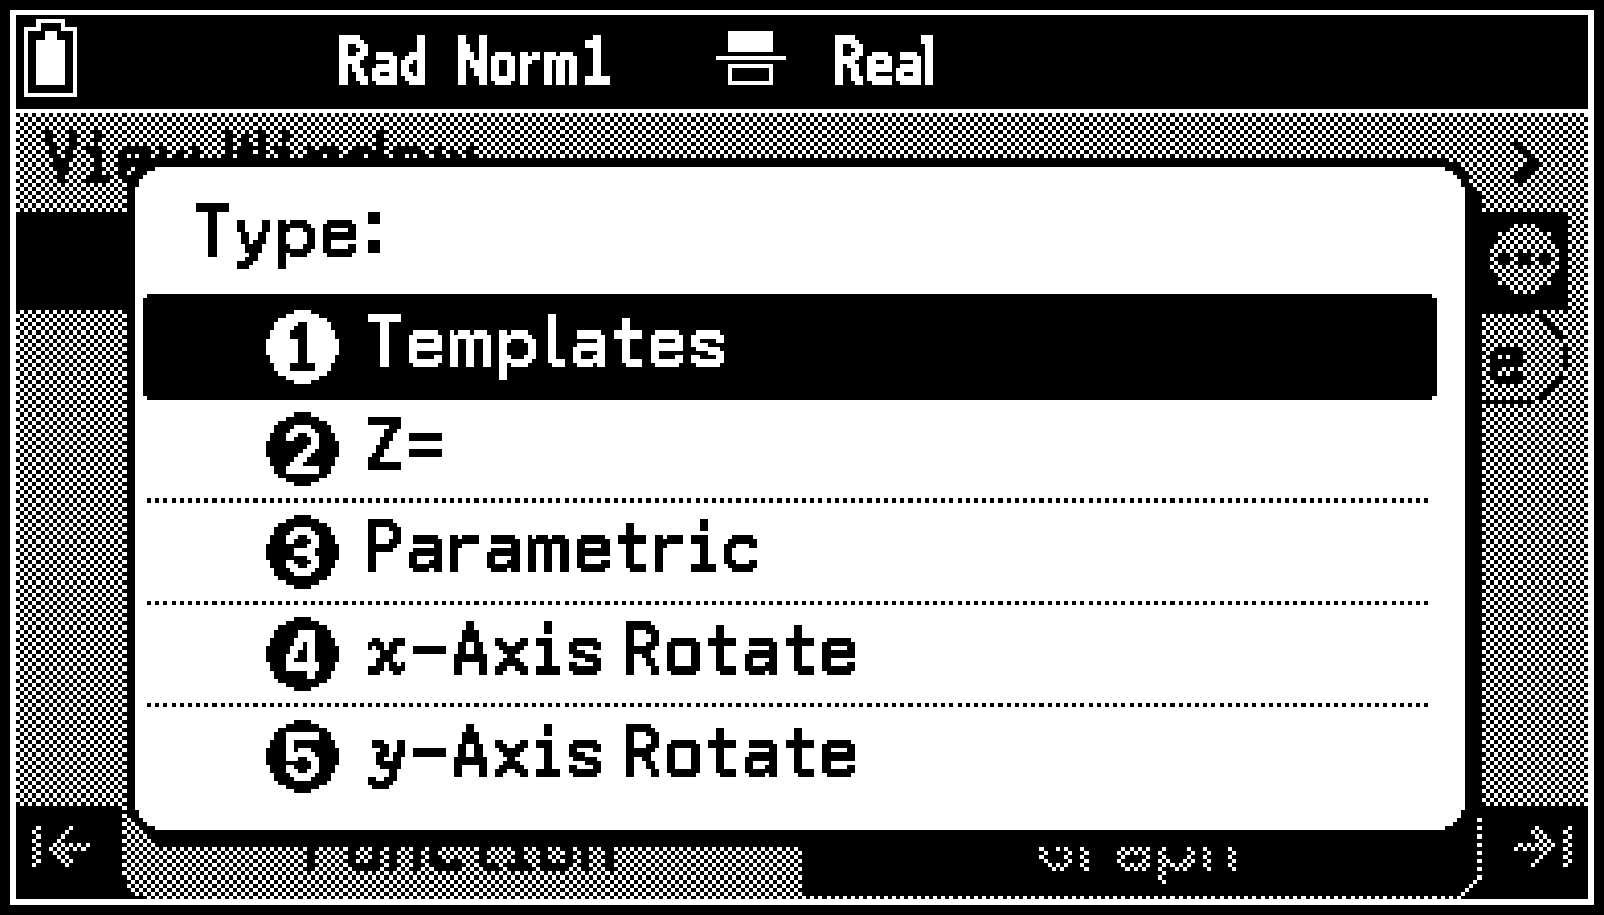
This displays a list of sphere templates.
This displays the template’s numeric value input window.
Since we want to graph “”, input a=0, b=0, c=0, and r=2.
0E0E0E2E
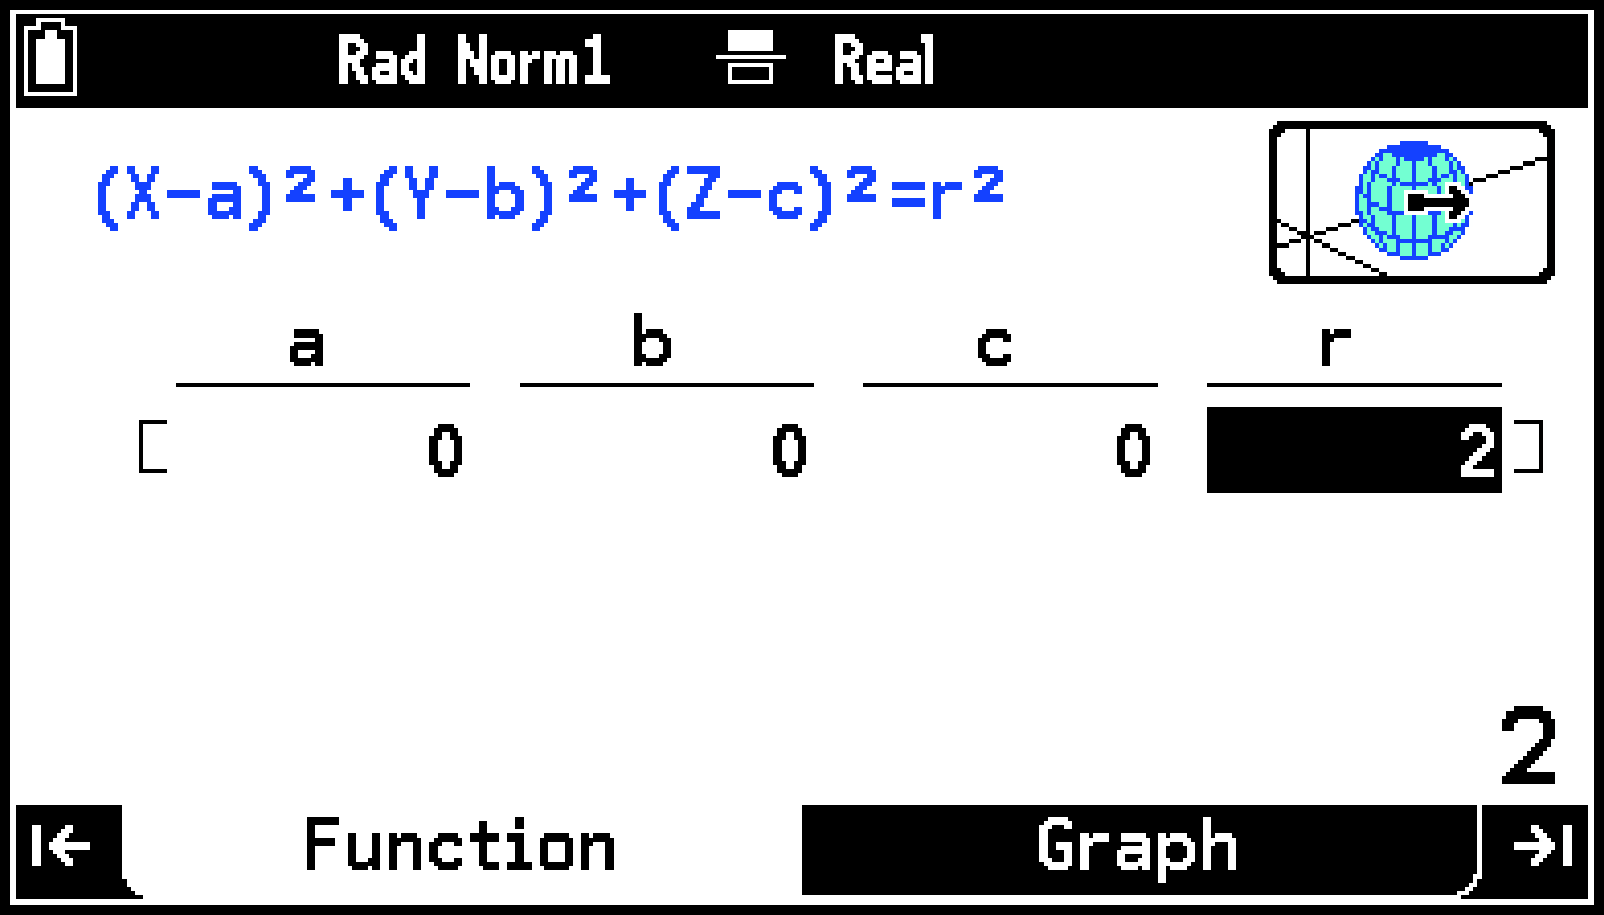
This displays the template name (Sphere) along with the values you input.
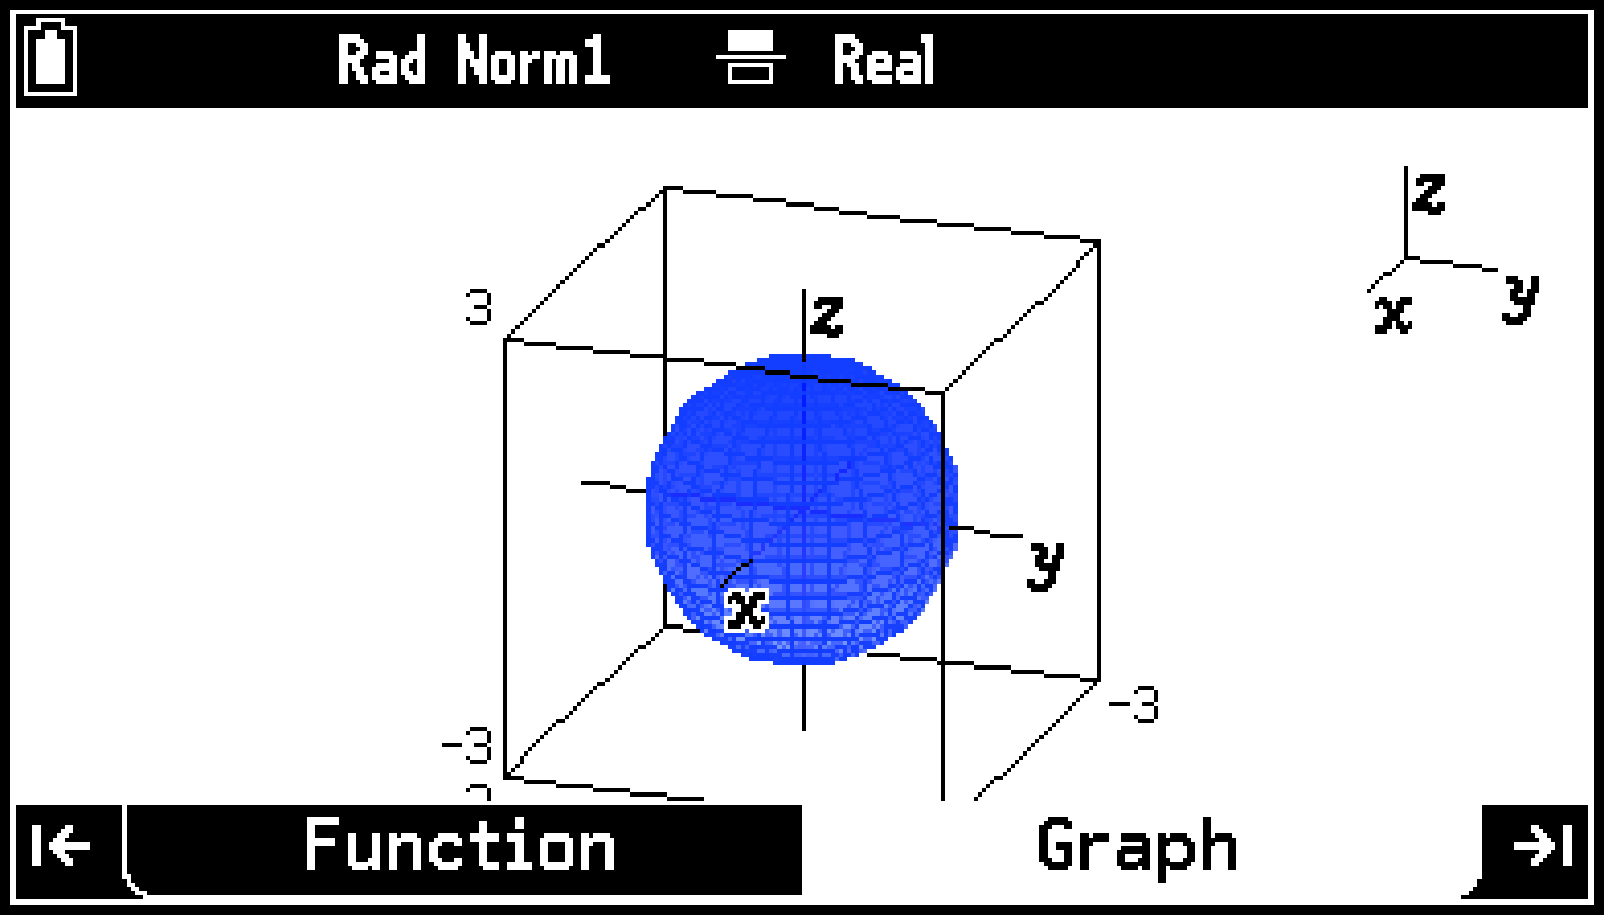
This displays the View Window menu. Change the range specification as required. For more information, see Specifying the Spatial Range and Drawing Accuracy for 3D Graphing (View Window).
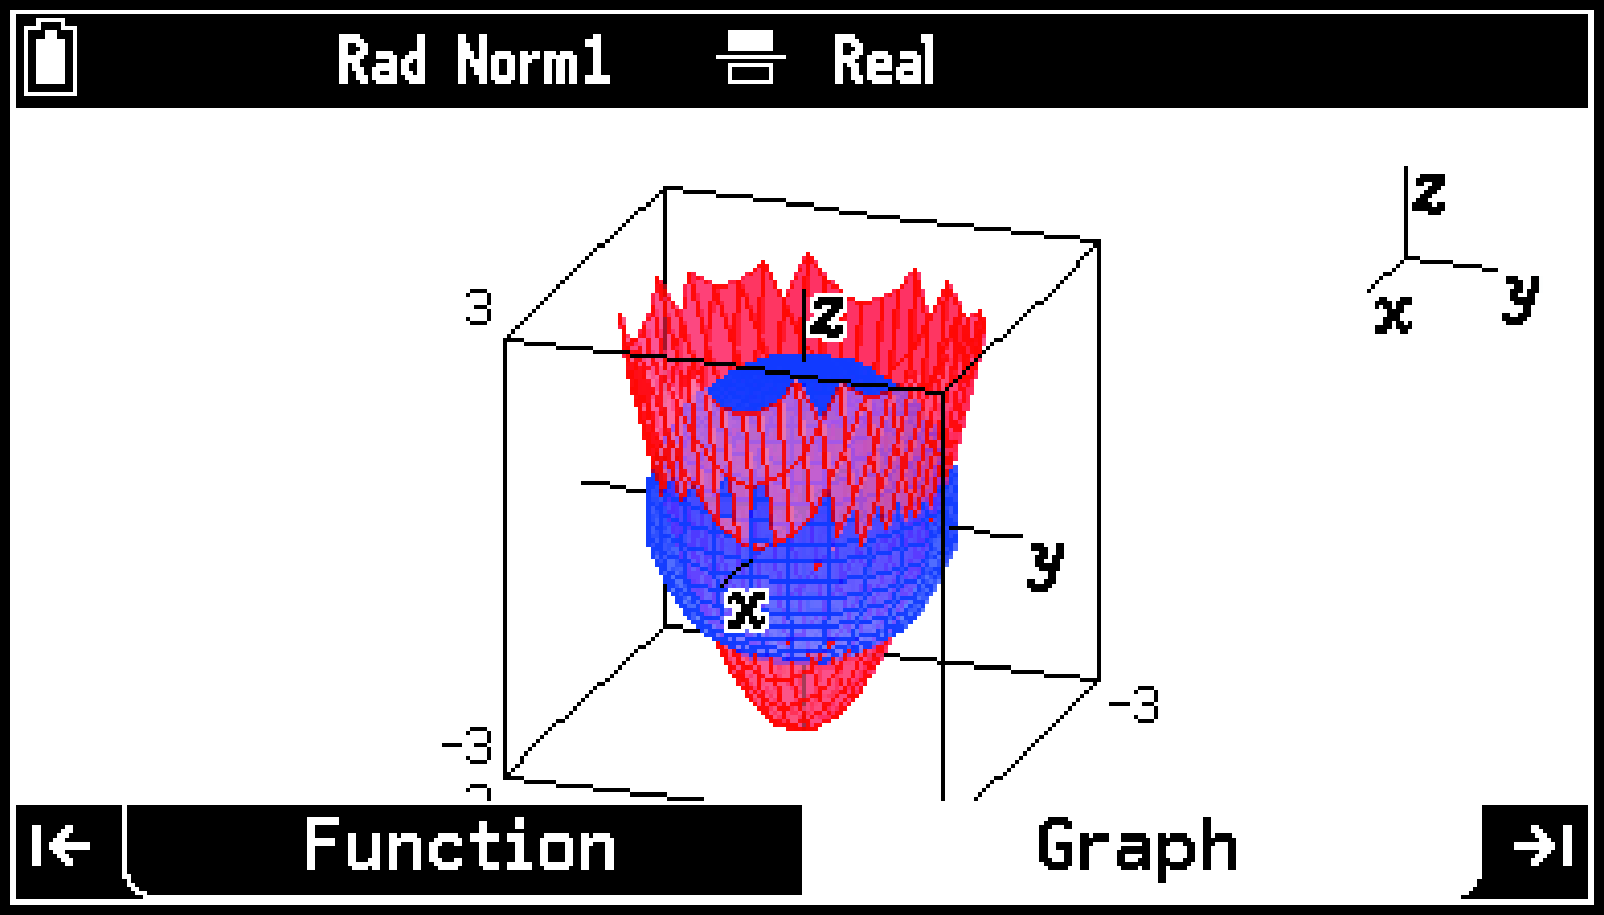
This draws the graph on the Graph tab.
If the highlighted line is blank, simply press O to display the Type menu. If the highlighted line contains an equation, you need to select T > [Enter Equation].
Using a Manually Input Function to Draw a Graph
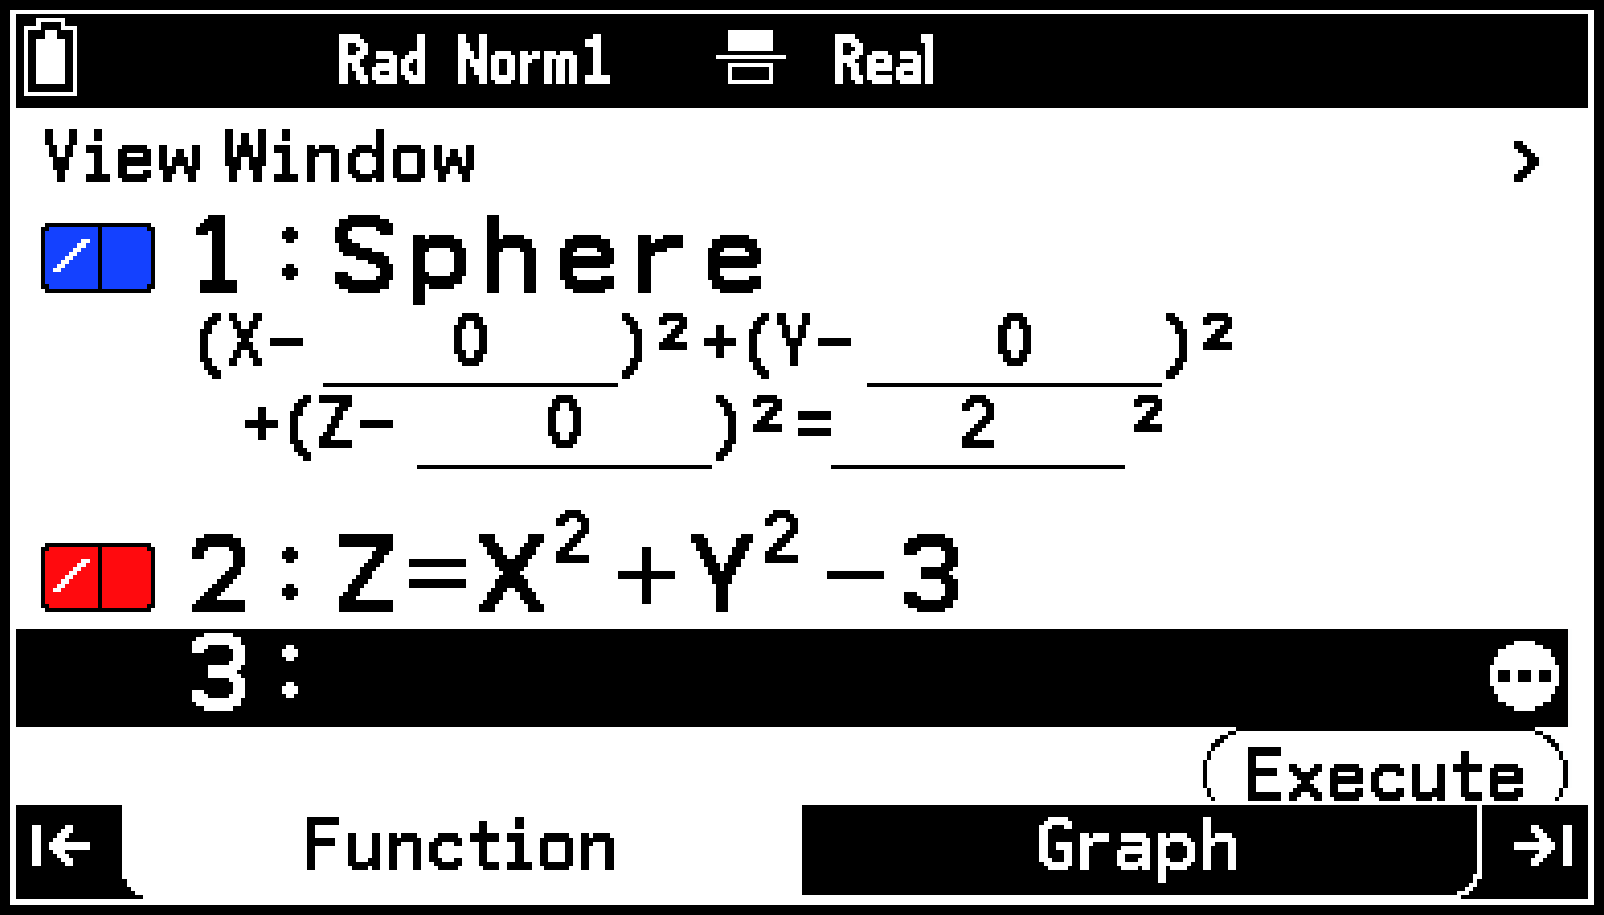
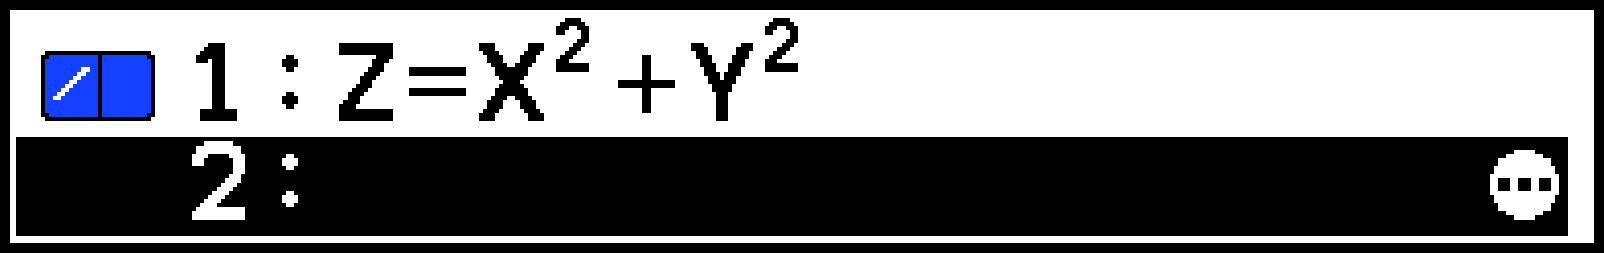
Example 2: Continuing from Example 1, above, to manually input and simultaneously draw two 3D graphs
-
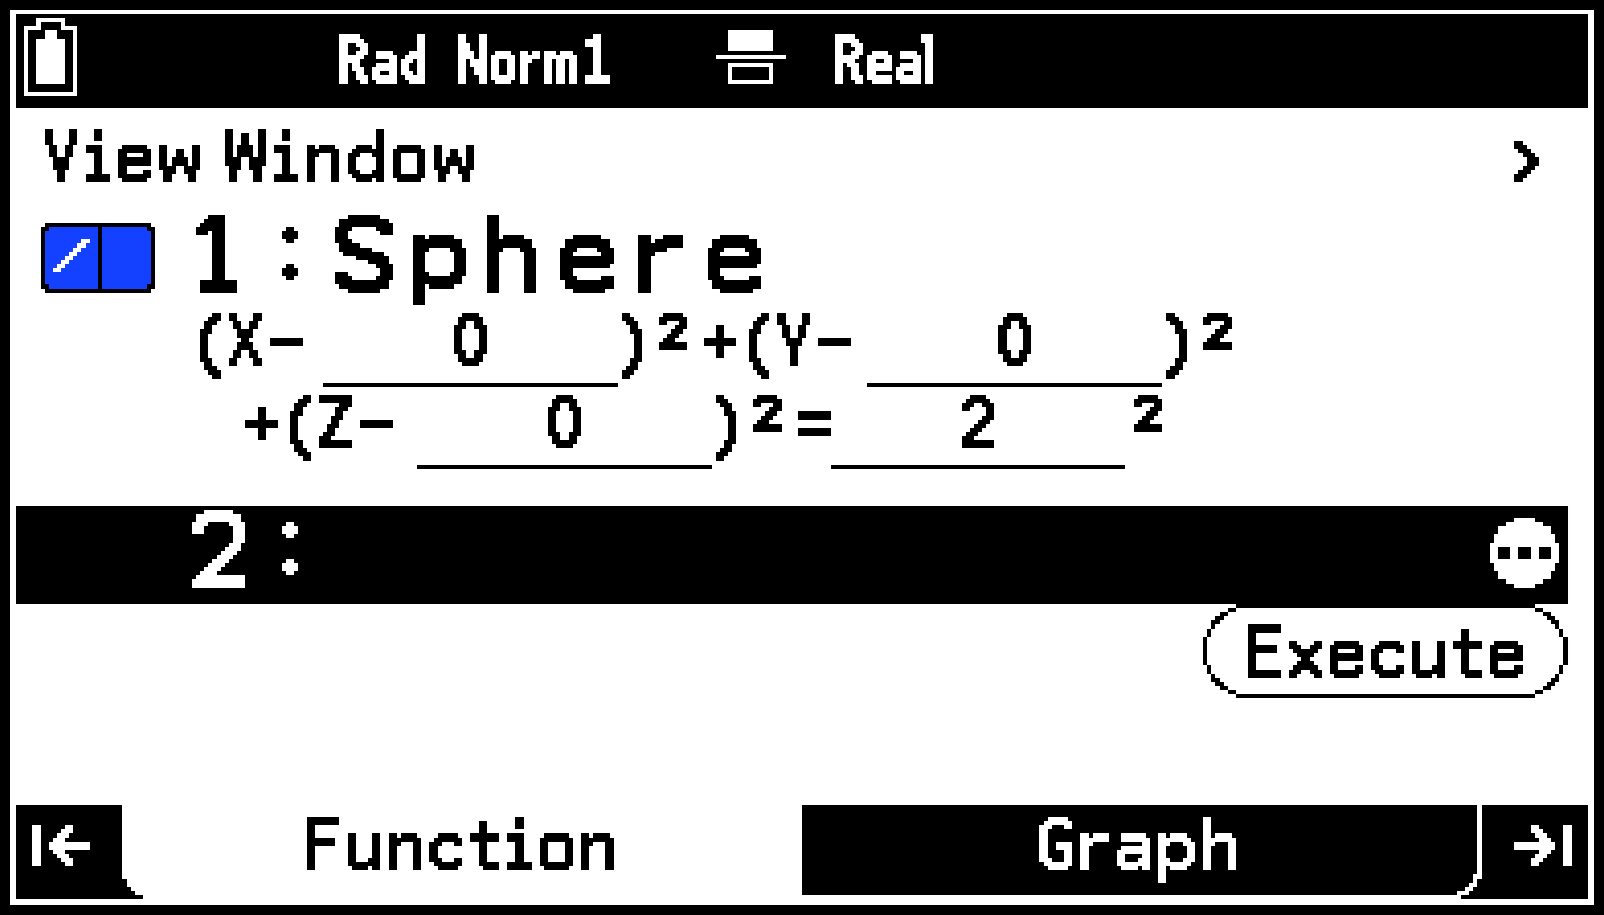
Use d to highlight “2:” on the Function tab.
-
Press O. On the menu that appears, select [Z=].
-
Input .
-
To draw the 3D graph, press >. Next, on the View Window menu that appears, highlight
and then press O. -
To return to the Function tab, press > or b.
Alternatively, you could also perform the operation T > [Enter Equation] > [Z=].
Xi+P-(Y)i-3E
This draws the graphs on the Graph tab.
Out of Drawing Range Graph Warning Message
The Out of Drawing Range warning message appears when there is nothing to draw in the window when you try to draw a graph. If this happens, choose the desired operation from the menu that appears.
|
To do this: |
Select this menu item: |
|---|---|
|
Display the View Window menu |
[View Window] |
|
Display the graph window (without drawing a graph) without adjusting View Window settings |
[Cancel] |
Using the Function Tab
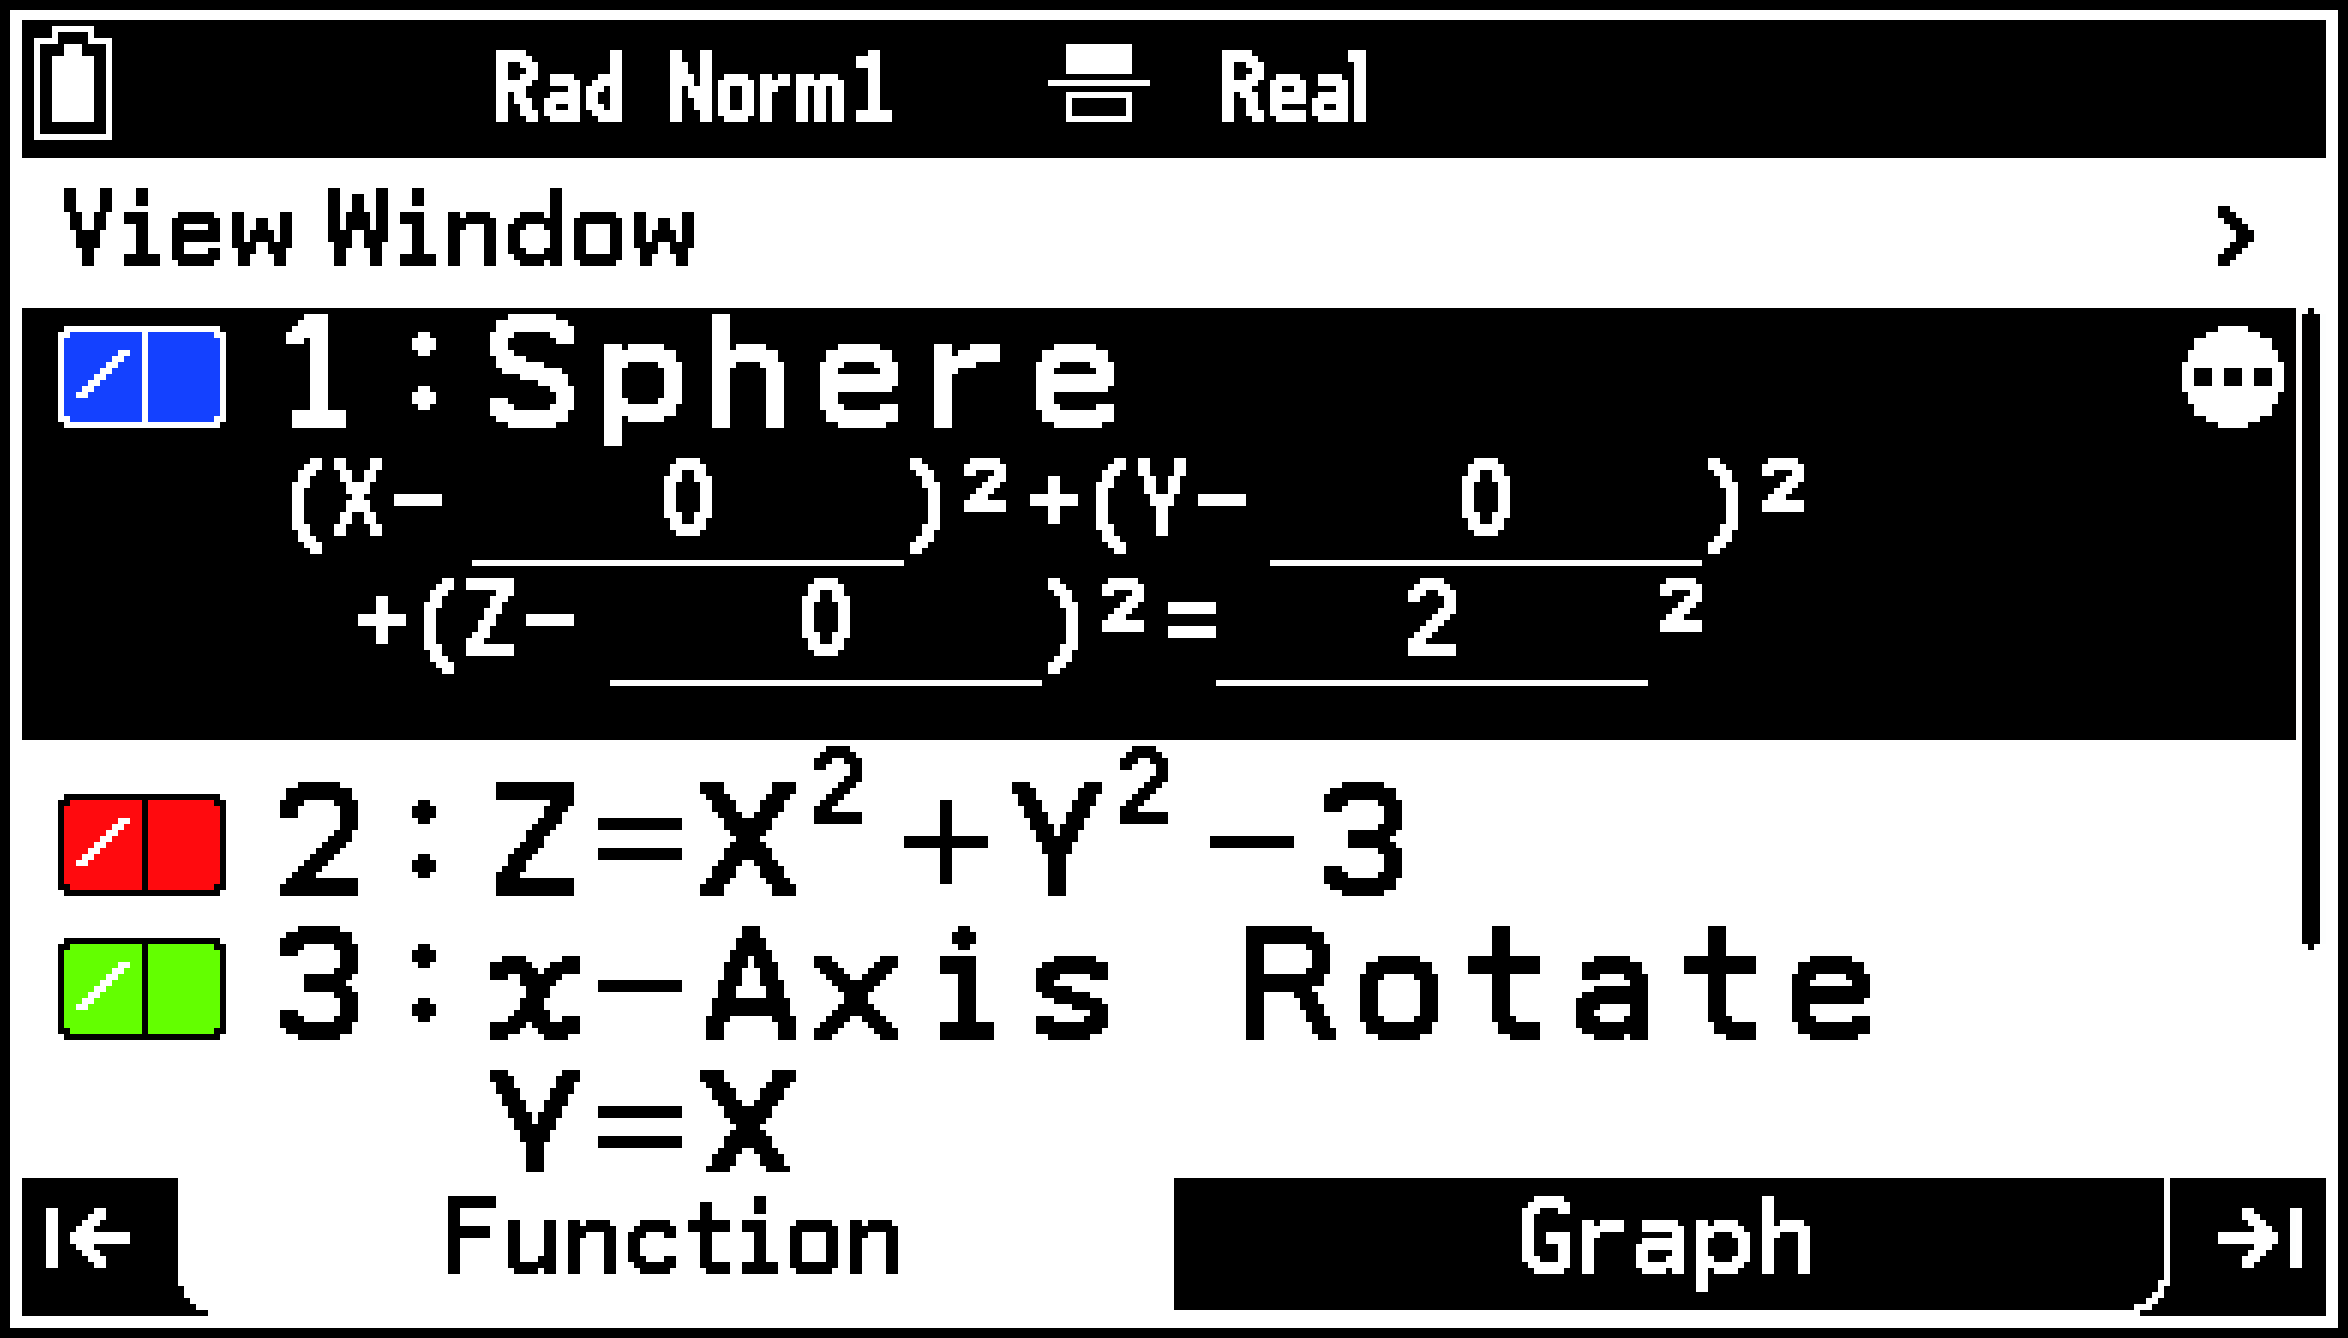
You can use the Function tab to store templates and functions you want to use for 3D graph drawing. You can store up to a total of three templates and/or functions. The example screen below shows the Function tab when one template and two functions are stored.
Storing and Editing 3D Graphing Templates
To store a template
-
On the Function tab, highlight the line where you want to store a template.
-
Select T > [Enter Equation] > [Templates].
-
Select the template you want to use.
-
Depending on the template you chose, input the required value in each cell (or row) in the window.
-
After inputting all of the values, press O.
(If you chose [Cylinder] or [Cone] in step 3, highlight and then press O here.)
This displays the Select Template menu.
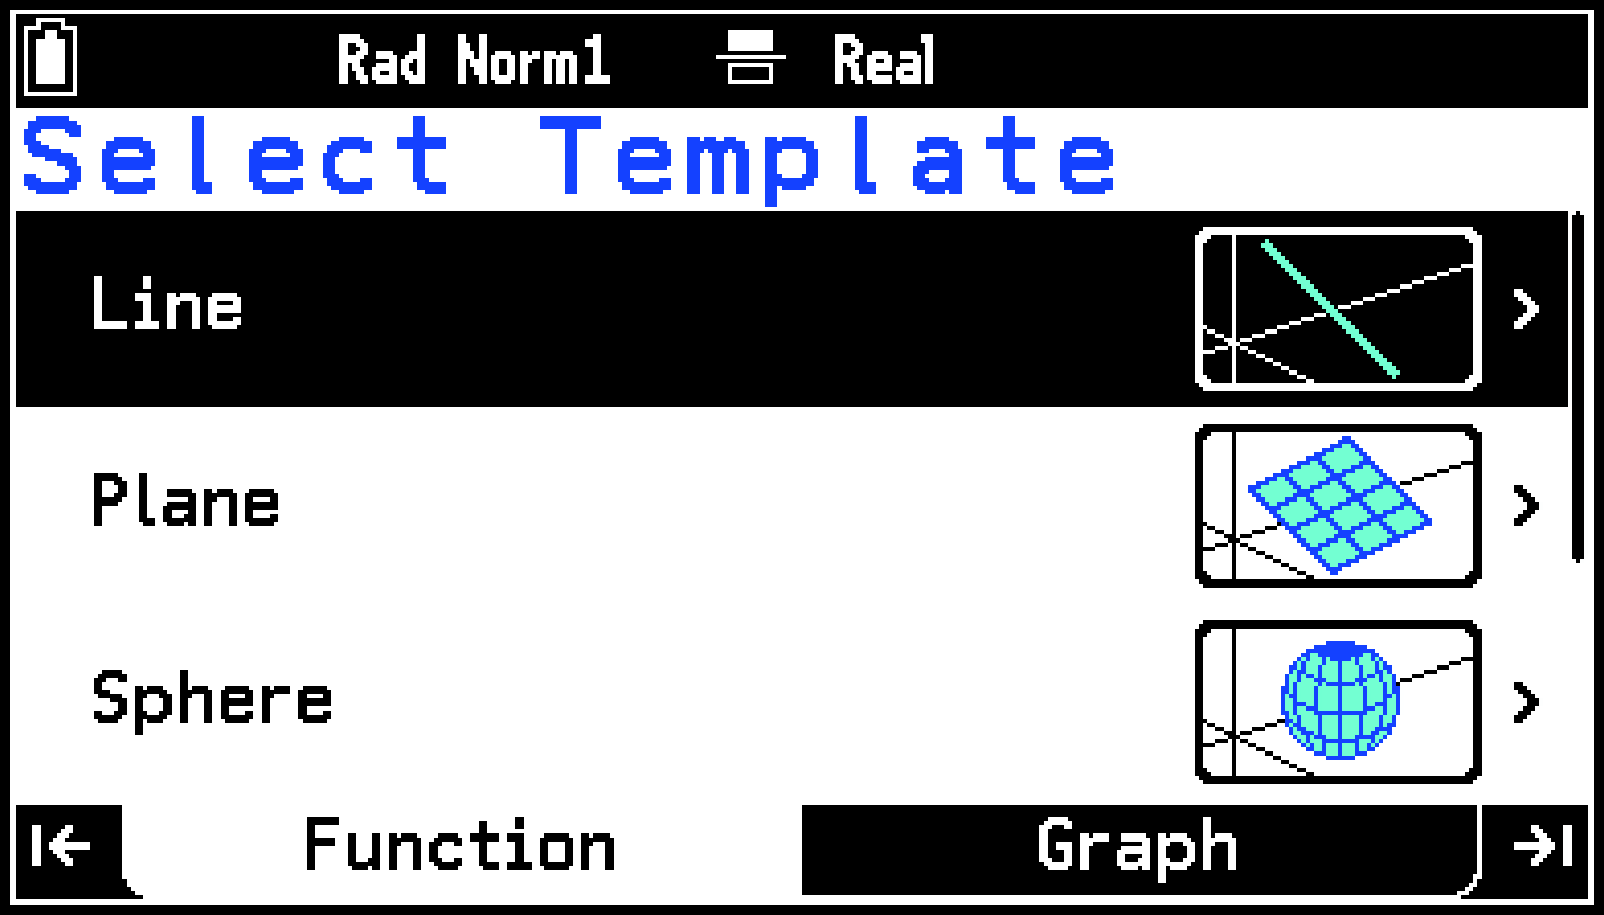
Use the template menu to select what you want to graph and the graphing method you want to use.
|
To graph this: |
Select this menu item: |
|---|---|
|
Straight line with the equation = = |
[Line] > [ |
|
Straight line by using a vector equation (two vectors) |
[Line] > [ |
|
Straight line by specifying the coordinates of two points |
[Line] > [Line through 2 points] |
|
Straight line by specifying the coordinates of one point and a direction vector |
[Line] >[ Through point (X0,Y0,Z0) ]
|
|
Plane by using the equation |
[Plane] > [ |
|
Plane by using a vector equation (three vectors) |
[Plane] > [ |
|
Plane by specifying the coordinates of three points |
[Plane] > [Plane through 3 points] |
|
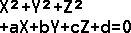
Sphere by using the equation: |
[Sphere] > [ |
|
Sphere by using the equation: |
[Sphere] > [ |
|
Cylinder |
[Cylinder] |
|
Cone |
[Cone] |
 ]
]Selecting any one of the above options displays a window for inputting the selected template’s values.
This returns to the Function tab.
Note
Note that the following input in step 4 results in an error.
|
For this template: |
This type of input results in an error: |
|---|---|
|
[Line] > [ |
a=0 or b=0 or c=0 |
|
[Line] > [ |
X, Y, Z elements = 0 for |
|
[Line] > [Line through 2 points] |
Both points = Identical coordinate values |
|
[Line] >[ Through point (X0,Y0,Z0) ]
|
All direction vector elements = 0 |
|
[Plane] > [ |
a=0 and b=0 and c=0 |
|
[Plane] > [ |
X, Y, Z elements of either or both and = 0 and = Identical orientation |
|
[Plane] > [Plane through 3 points] |
Two of three points = Identical coordinate values Three points are on a straight line |
|
[Sphere] > [ |
r = 0 or less |
|
[Sphere] > [ |
Input values do not satisfy a2+b2+c2>4d. |
|
[Cylinder] |
Radius: 0 or less Same value for Zmin and Zmax |
|
[Cone] |
To edit a template
-
Highlight the line where the template you want to edit is located, and then press O.
-
Make changes to the existing values as required.
-
After everything is the way you want, press O.
(If you are editing a [Cylinder] or [Cone] template, highlight and then press O here.)
This displays the template’s numeric input window.
To delete a template
To delete a stored template, use the same operation as that for deleting a Graph&Table app’s stored function. See To delete a function for details.
Storing and Editing Functions for 3D Graphing
To store a function
-
On the Function tab, highlight the line where you want to store a function.
-
Select T > [Enter Equation].
-
Perform the operations shown in the table below.
-
Input the function in accordance with the selected type.
|
To select this function type: |
Select this menu item: |
|---|---|
|
Cartesian coordinate type (Z=(X, Y) form) |
[Z=] |
|
Parametric type |
[Parametric] |
|
Solid of rotation on the X-axis (Y=(X) form)*1 |
[-Axis Rotate] |
|
Solid of rotation on the Y-axis (Y=(X) form)*2 |
[-Axis Rotate] |
This draws a three-dimensional graph on the XY plane input using the Y=f(X) format and rotates it 360 degrees around the X axis.
This draws a three-dimensional graph on the XY plane input using the Y=f(X) format and rotates it 360 degrees around the Y axis.
Press X to input the variables (X or T) in accordance with the function type you chose.
To input “Y” for a Z= form function, press P-(Y) or press C and then input using the menu that appears.
To input “S” for a parametric type function, press P/(S) or press C and then input using the menu that appears.
Example 1: To input the Cartesian coordinate type
T > [Enter Equation] > [Z=]
Xi+P-(Y)iE
Example 2: To input the parametric type
T > [Enter Equation] > [Parametric]
2cX)E
3vX)E
3cX)E

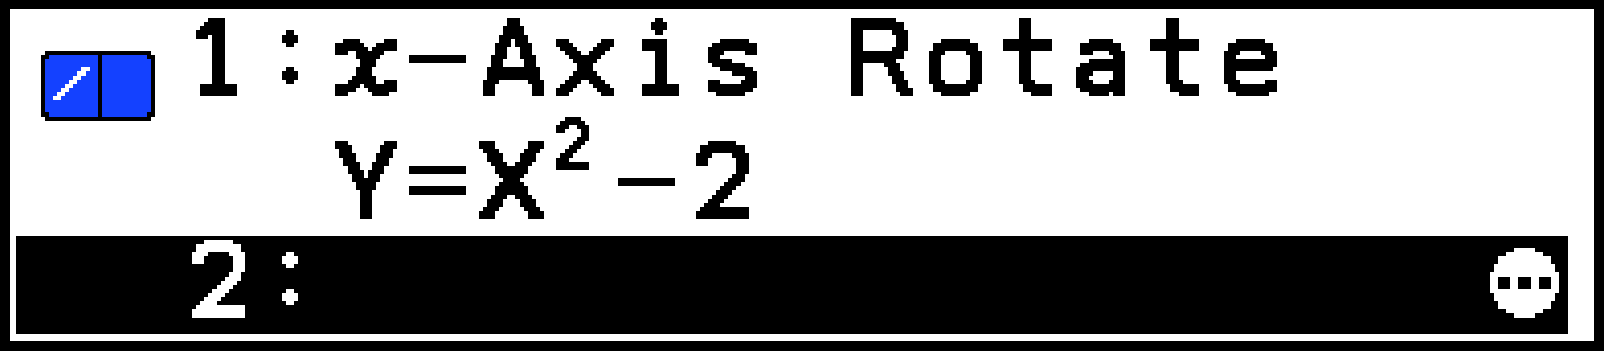
Example 3: To input the solid of rotation on the X-axis type
T > [Enter Equation] > [-Axis Rotate]
Xi-2E
Note
You can input only Absolute Value and Hyperbolic Calc category functions using the menu that appears when you press C in step 4.
To edit or delete a function
To edit or delete a stored function, use the same operation as one in the Graph&Table app. See To edit a function and To delete a function for more information.
Graph Drawing Settings (Line Color, Area Color)
On the Function tab, highlight the row that contains the graph drawing settings you want to change and then perform the operations described in the table below.
|
To do this: |
Perform this operation: |
|---|---|
|
Change the line color for graph drawing |
Select T > [Line Color]. Use the list that appears to select a color. |
|
Change the area color for graph drawing |
Select T > [Area Color]. Use the list that appears to select a color. |
The line color and area color you specify are shown by the icons to the left of each line of the Function tab as shown below.
Area Color
Line Color
Drawing Graphs
To select a function to draw a graph
-
On the Function tab, highlight a line where a template or function is stored.
-
Press T.
-
Change [Select] to
 (On) to enable or to
  (Off) to disable graphing for the selected template or function.
 -
Press b to close the Tools menu.
This displays a Tools menu with [Select] highlighted.
The on/off setting of step 3 is indicated by the icons to the left of each line of the Function tab.
|
|
|
To go from the Function tab to the Graph tab (to draw a graph)
Press > or highlight ![]() and then press O. This causes the View Window menu*1*2 to appear so you can specify the range of the graph window. Change the range specification as required. For more information, see Specifying the Spatial Range and Drawing Accuracy for 3D Graphing (View Window).
and then press O. This causes the View Window menu*1*2 to appear so you can specify the range of the graph window. Change the range specification as required. For more information, see Specifying the Spatial Range and Drawing Accuracy for 3D Graphing (View Window).
To return to the Function tab, press < or b.
You can also display the View Window menu by pressing UO on the Function tab.
To prevent the View Window menu from appearing when you go to the Graph tab, turn off S > [Show V-Win Settings].
Using the Graph Tab
Adjusting the Graph Window
To zoom the graph window in or out
Press + to zoom in or - to zoom out.
To rotate a 3D Graph manually
Use the cursor keys to rotate a 3D graph up, down, left, and right.
Note
You can also rotate a 3D graph automatically. See Auto Rotating a 3D Graph (Rotate).
To fine-tune the graph window (Tools menu)
|
To do this: |
Select this menu item: |
Details: |
|---|---|---|
|
Specify the display range |
T > [View Window] |
Specifying the Spatial Range and Drawing Accuracy for 3D Graphing (View Window) |
|
Zoom the graph window in or out |
T > [Zoom] |
Specifying the Spatial Range and Drawing Accuracy for 3D Graphing (View Window)
You can use the View Window menu to specify the spatial range (-, -, and -axis ranges) and the precision for drawing a 3D graph. This View Window also lets you specify the range of values for drawing a parametric type graphs, and the viewpoint of a 3D graph.
To display the View Window menu
On the Graph tab, select T > [View Window].
To specify the coordinate range and drawing precision for drawing a 3D graph
Use the View Window to input values for the items below.
Minimum, Maximum, Grid (-axis minimum value*1, maximum value*1, grid value*2*3)
Minimum, Maximum, Grid (-axis minimum value*1, maximum value*1, grid value*2*3)
Minimum, Maximum (-axis minimum value*1, maximum value*1)
To specify the range and drawing precision for each of the parameters (S and T) of a parametric type graph
These settings are applied when drawing parametric graphs. Use the View Window to input values for the items below.
S Minimum, S Maximum, S Grid (parameter S minimum value*1, maximum value*1, grid value*2*3)
T Minimum, T Maximum, T Grid (parameter T minimum value*1, maximum value*1, grid value*2*3)
To adjust the viewpoint of the graph window
Use the settings below to adjust the viewpoint of the graph display with respect to the -axis and -axis. Always specify a value in degrees, regardless of the current S > [Angle] angle unit setting.
Angle : Specifies the angle of clockwise rotation of the -axis (-180° < < 180°) viewed from the positive end of the -axis (0°).
Angle : Specifies the angle rotation of the -axis towards the back (0° < < 360°) viewed from the positive end of the -axis forward (0°).
To initialize the View Window settings
On the View Window menu, select [Pre-set Windows] > [Initialize].
Input minimum/maximum values in the range where the absolute value is smaller than 1 × 1098.
Input a grid value in the range 2 ≤ grid ≤ 50.
The grid value specifies the number of calculation points (number of divisions) for drawing a graph within the specified drawing range (from the minimum value to the maximum value). However, in the case of a sphere and certain other graph forms, the grid value is the number of divisions of the graph itself rather than the number of divisions of the drawing range.
Note
The greater the Grid and Grid values, the more detailed the graph. Also note, however, that larger values require more calculation, which means that the graphing operation takes more time.
Graphing may be impossible if the Grid and Grid values are too small.
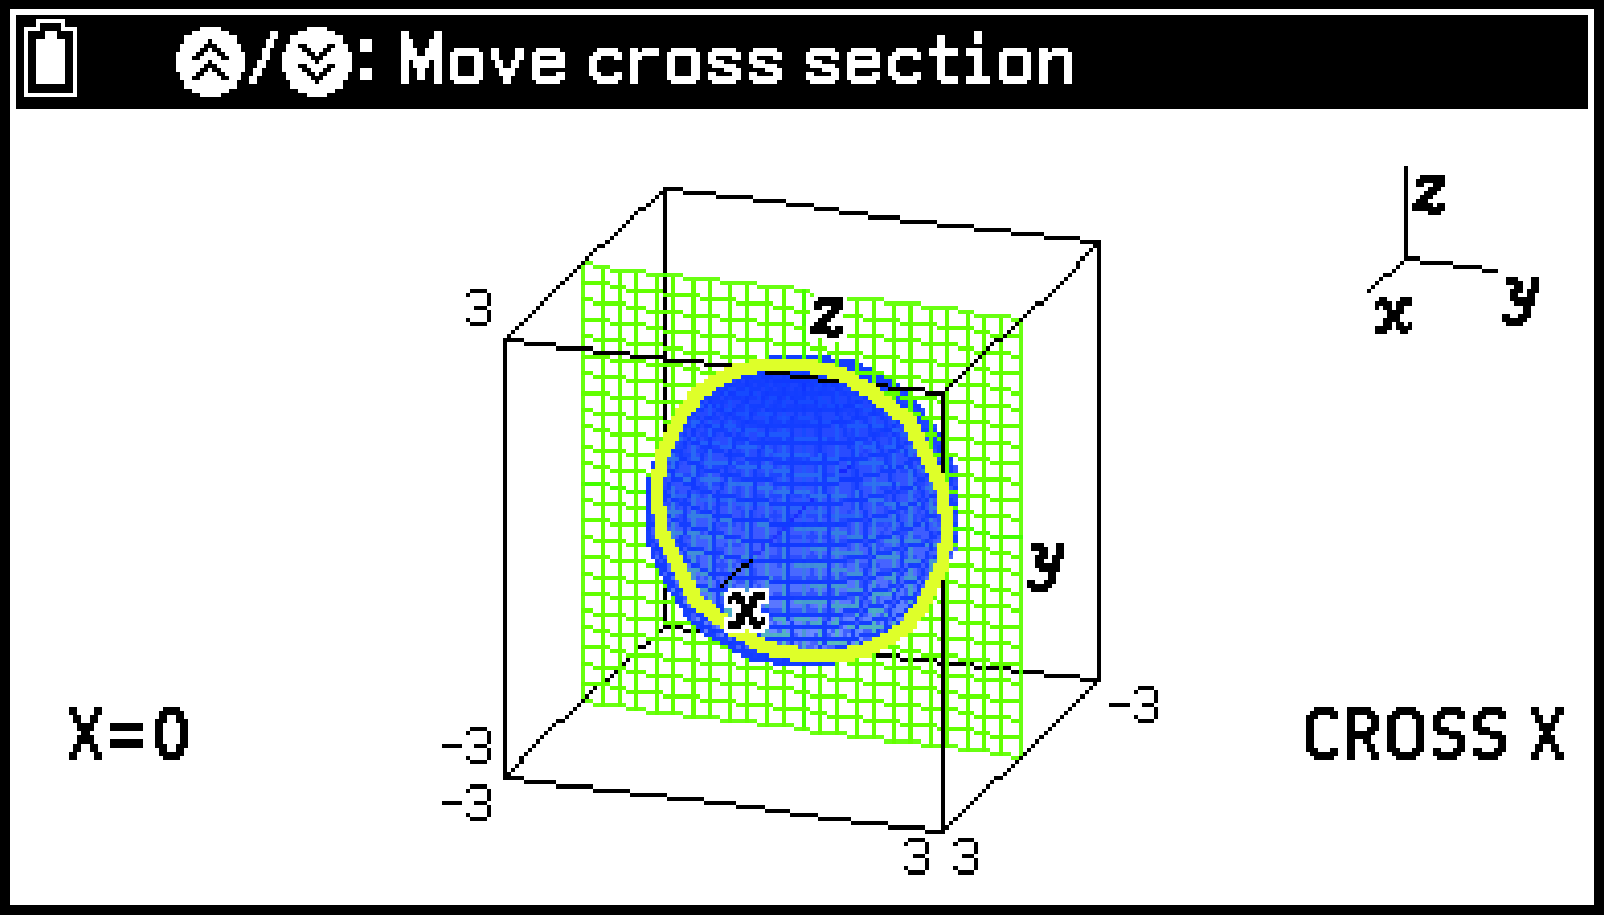
Displaying the Cross Section of a 3D Graph
You can display the cross section of a 3D graph sliced with any vertical plane relative to the -, -, or -axis. This operation is available for lines, planes, spheres, cylinders, or cones drawn using a template.
To display the cross section of a 3D graph
On the Graph tab that already shows a 3D graph, perform the operations in the table below.
|
To do this: |
Select T > [Graph Solve] > [Draw Cross Section] and then select this: |
|---|---|
|
Display a cross section of a 3D graph sliced with a plane perpendicular to the -axis. |
[Cross X] |
|
Display a cross section of a 3D graph sliced with a plane perpendicular to the -axis. |
[Cross Y] |
|
Display a cross section of a 3D graph sliced with a plane perpendicular to the -axis. |
[Cross Z] |
Example: To display a cross section sliced on a plane perpendicular to the -axis of the sphere graphed for Example 1 of Operation Flow.
T > [Graph Solve] > [Draw Cross Section] > [Cross X]
Note
The outline of the cross section of a 3D graph sliced with a plane is highlighted using the opposite color of the color specified by Area Color. Also, the outline of the cross section is displayed in the forefront plane.
When a planar graph is sliced, the outer border of the planar graph is highlighted if the planar graph overlaps the plane being used for slicing.
To view a cross section from a particular direction
While a cross section is displayed, perform one of the operations below.
|
To do this: |
Select this menu item: |
|---|---|
|
Display the view along the positive -axis |
T > [View From pos x Direction] |
|
Display the view along the positive -axis |
T > [View From pos y Direction] |
|
Display the view along the positive -axis |
T > [View From pos z Direction] |
|
Return the view direction to its original view |
T > [Zoom Original] |
To move the cross section of a 3D graph
Press U or D to move a cross section on the applicable axis. You can also specify a location on a cross section by directly inputting a coordinate value on the applicable axis.
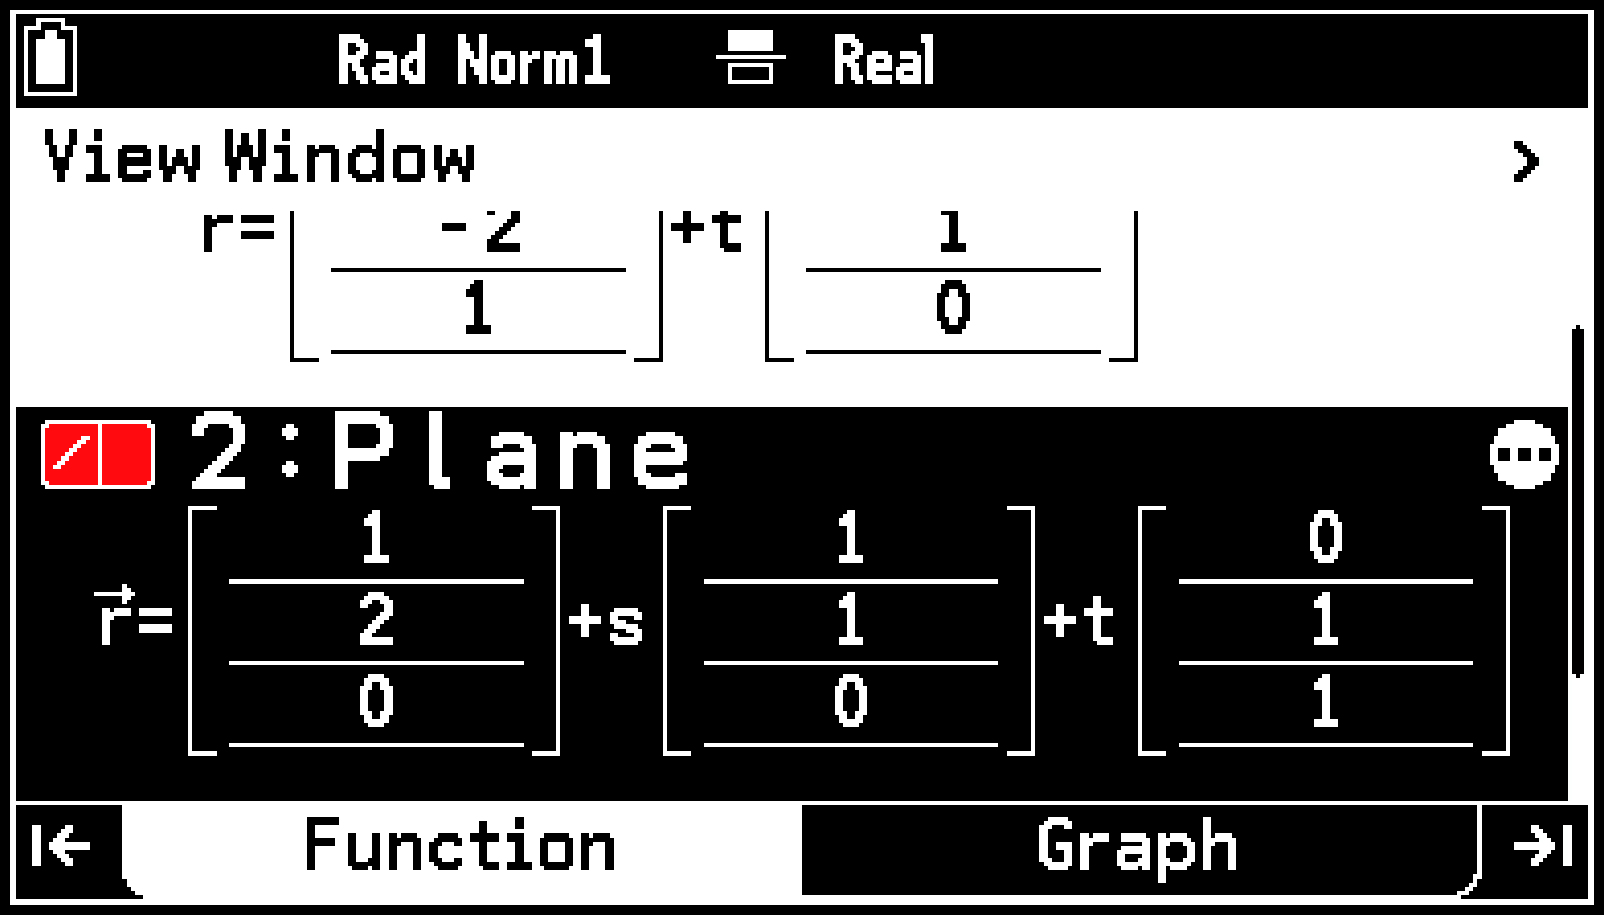
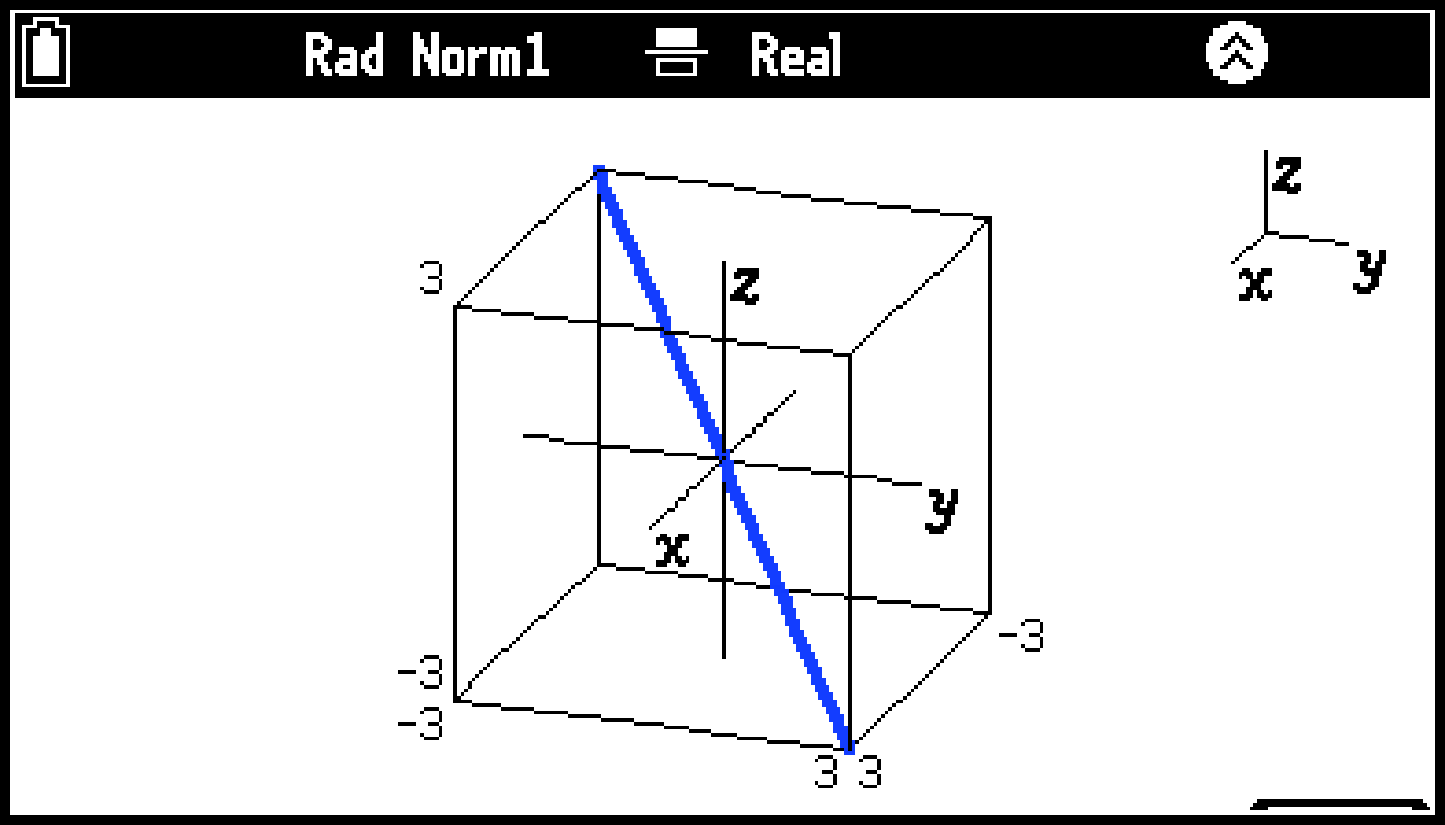
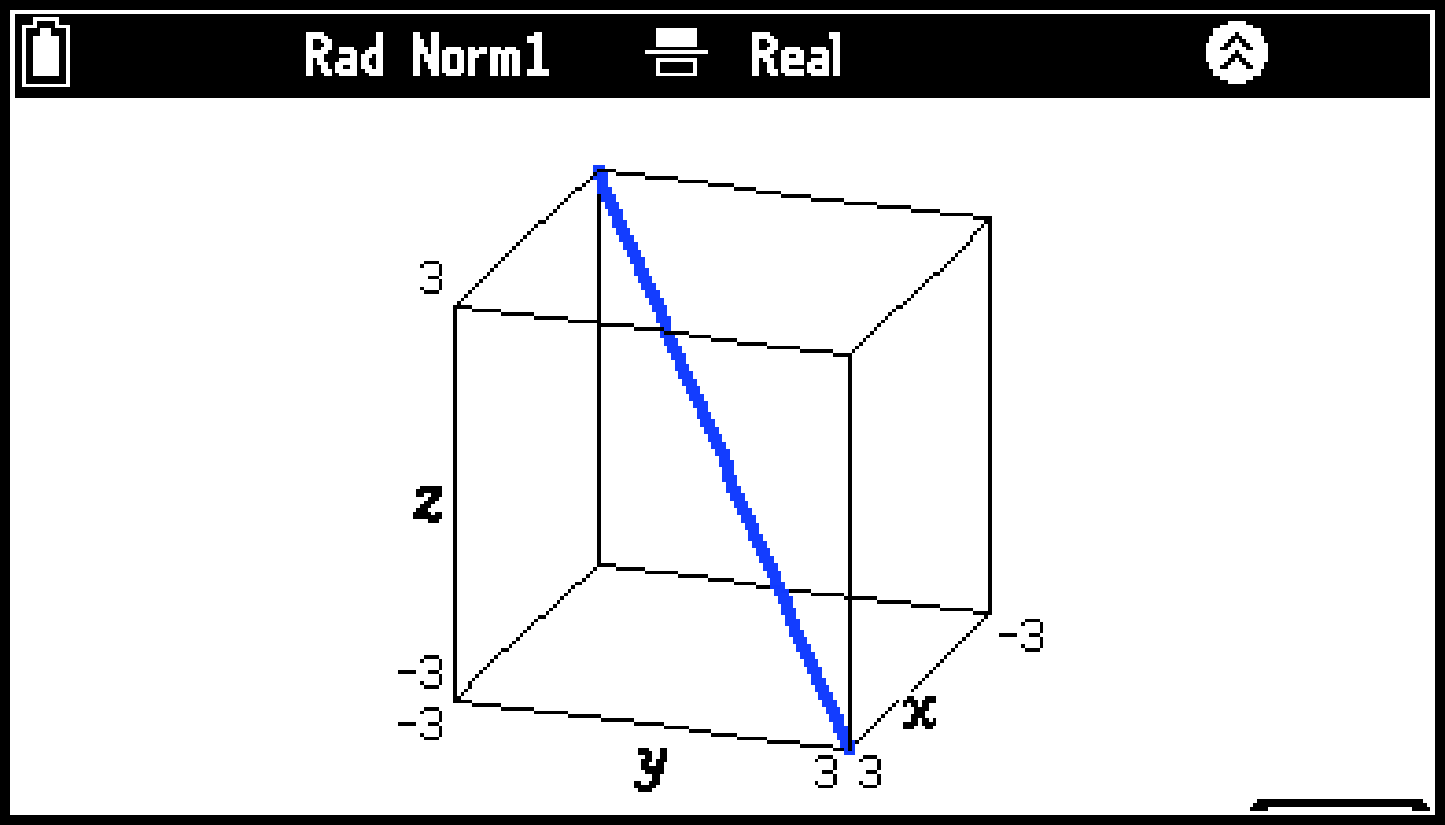
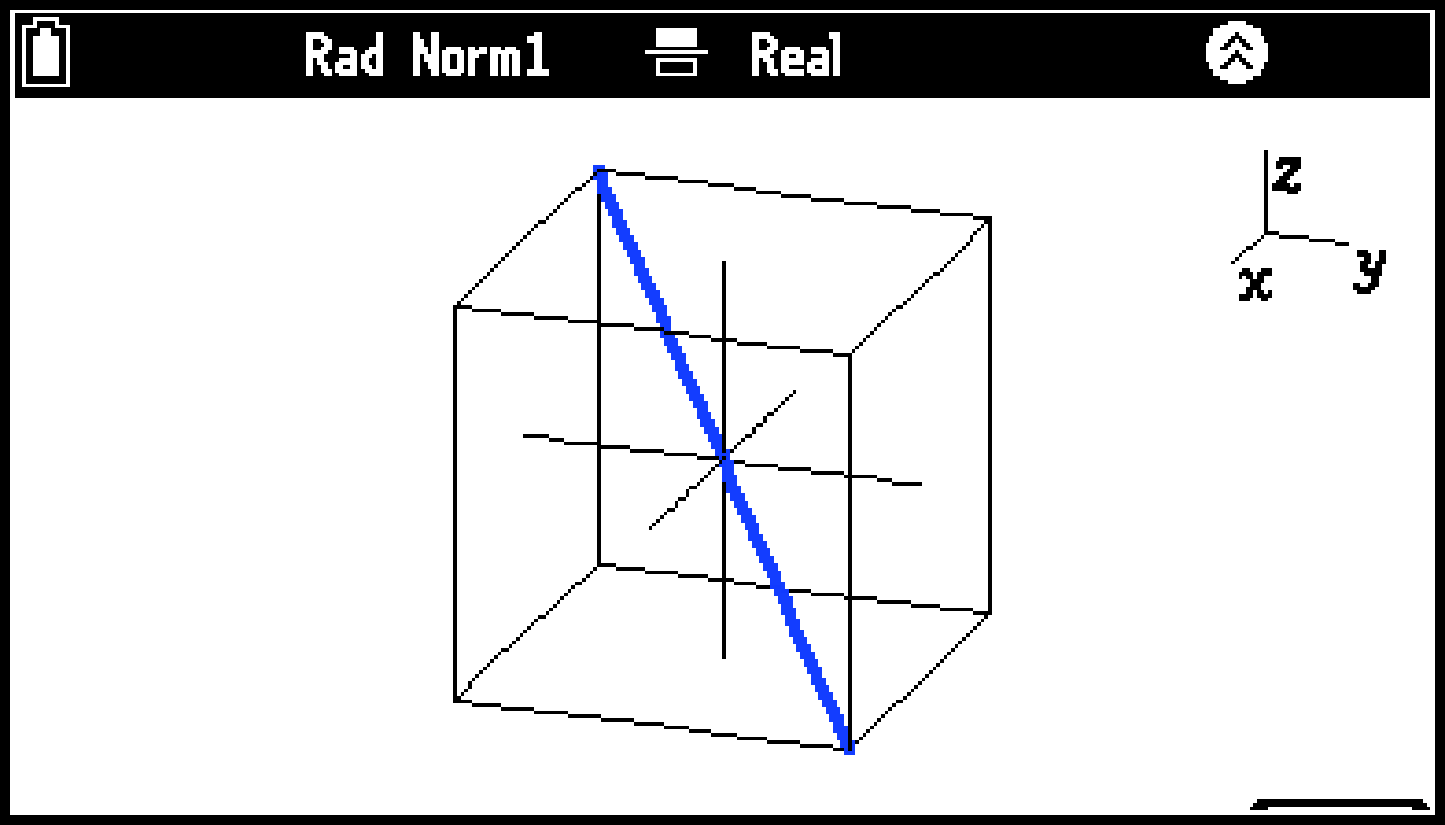
Determining the Intersect of Straight Lines or Planes (fx-CG100 only)
You can use the operations below to determine the intersect of two lines, the intersect of a line and a plane, or the intersect of two planes. This operation can be performed on lines and/or planes drawn using a template.
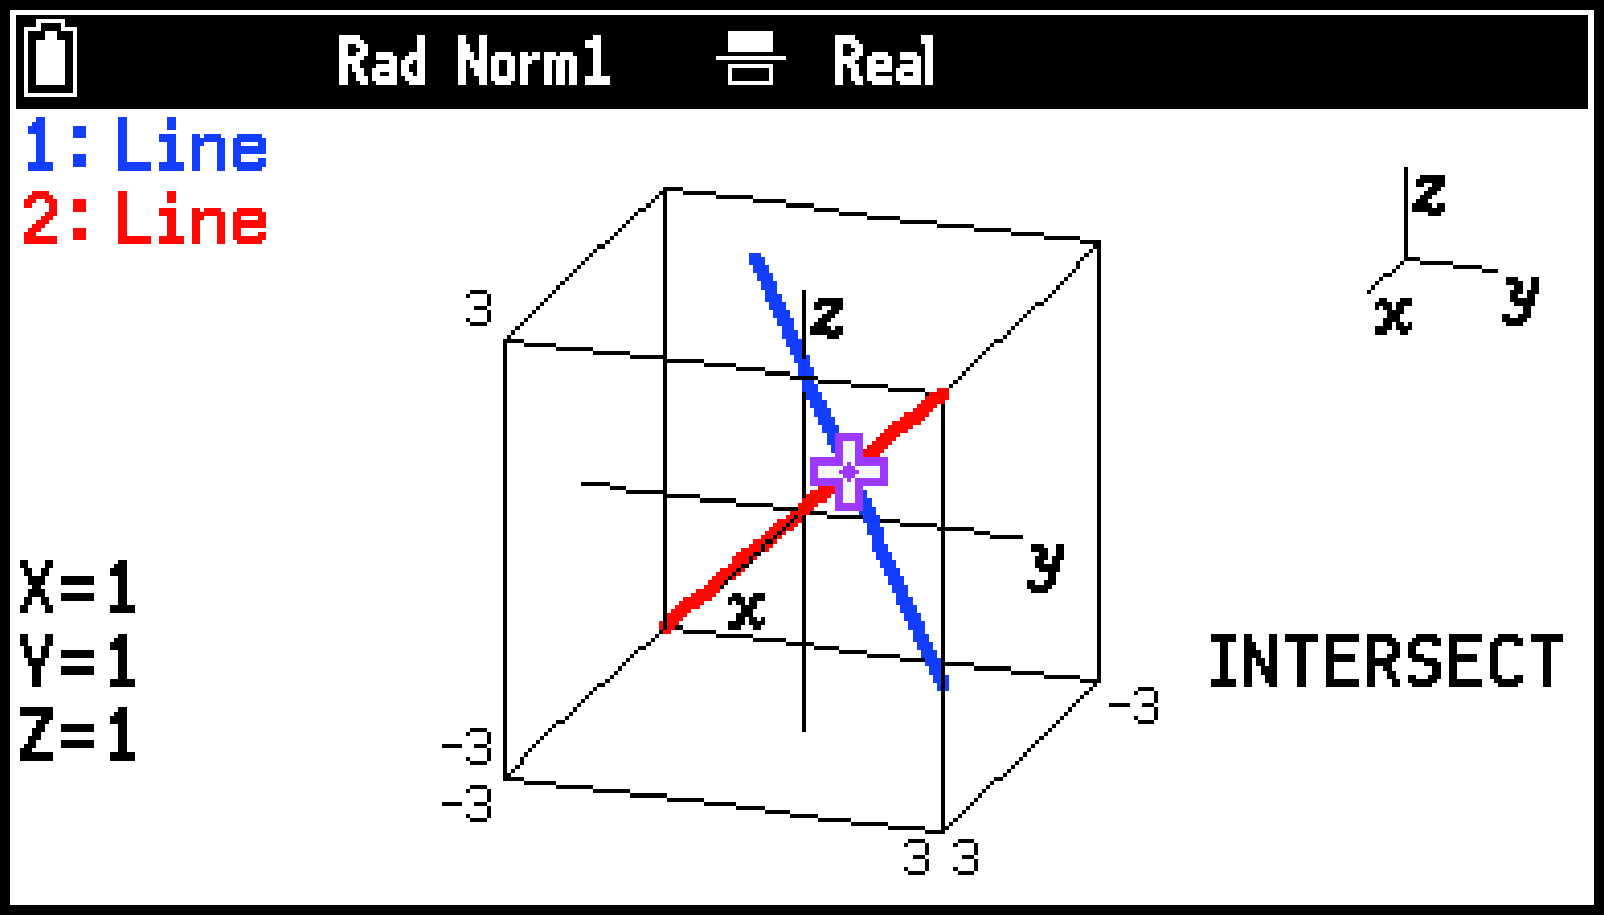
Example 1: To graph the lines = = and = = , and determine where they intersect
-
Use Function tab templates to store the equations of the two lines.
-
Press > to draw the graph.
-
Select T > [Graph Solve] > [Intersection].
T > [Enter Equation] > [Templates] >
[Line] > [ ]
]
1E1E1E1E1Es-(M)1EE
dT > [Enter Equation] > [Templates] >
[Line] > []
1E1E1E2E2E2EE
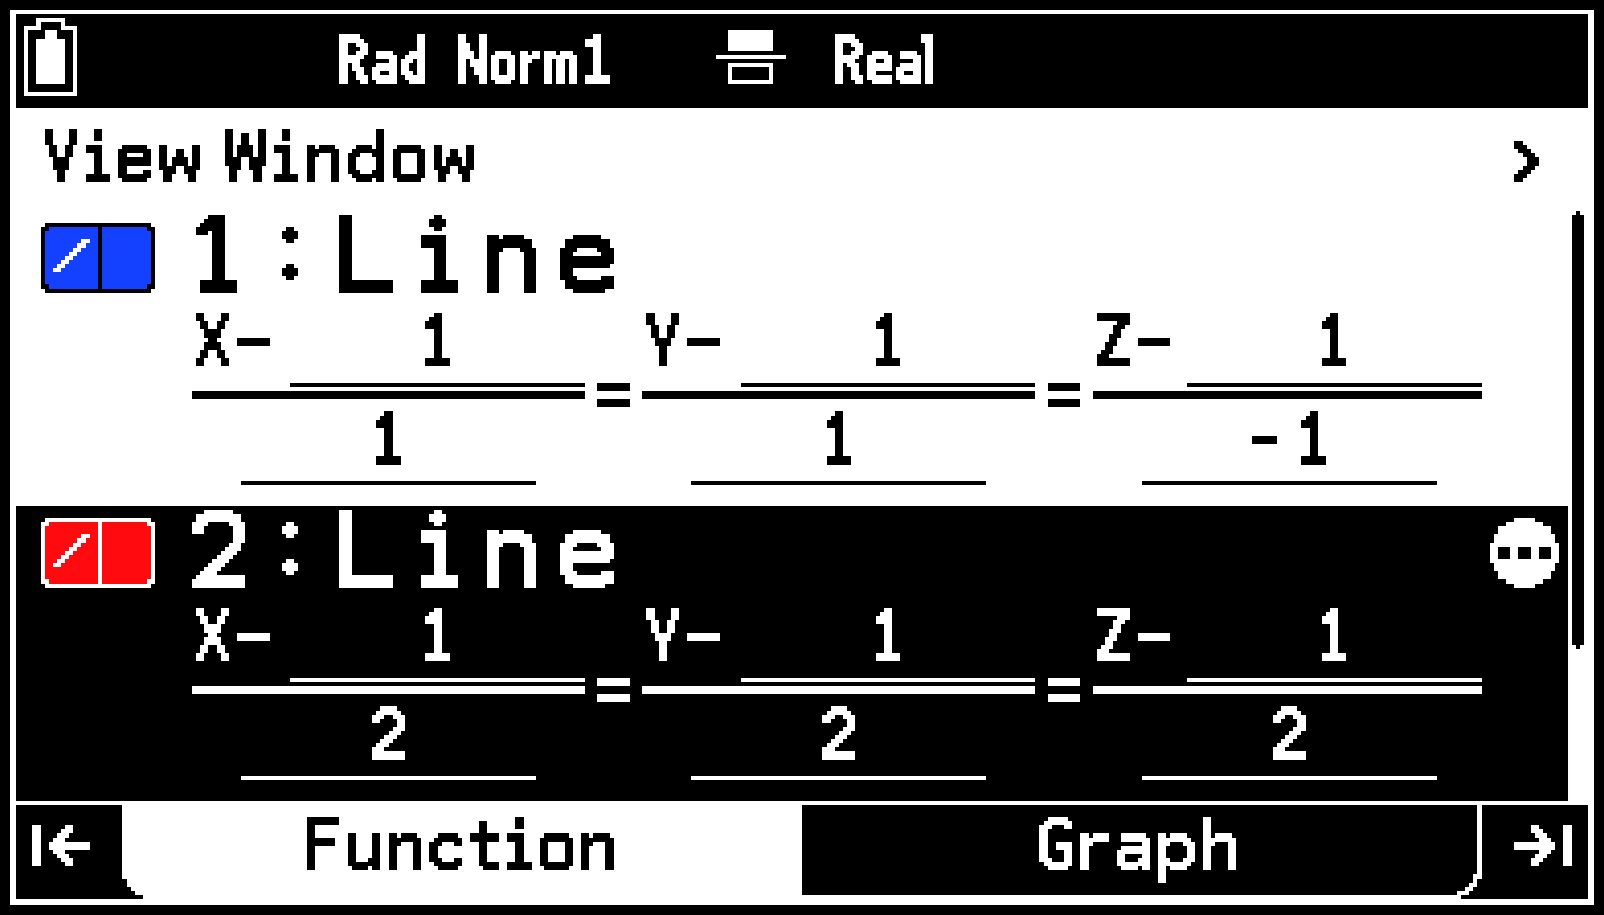
This displays the intersect of the two lines. The coordinates of the intersect are shown in the lower left corner of the display.
Example 2: To graph the two planes X+Z=0 and X+Y=0 and determine their intersect
-
Use Function tab templates to store the equations of the two planes.
-
Press > to draw the graph.
-
Select T > [Graph Solve] > [Intersection].
T > [Enter Equation] > [Templates] >
[Plane] > [ ]
]
1E0E1E0EE
dT > [Enter Equation] > [Templates] >
[Plane] > []
1E1E0E0EE
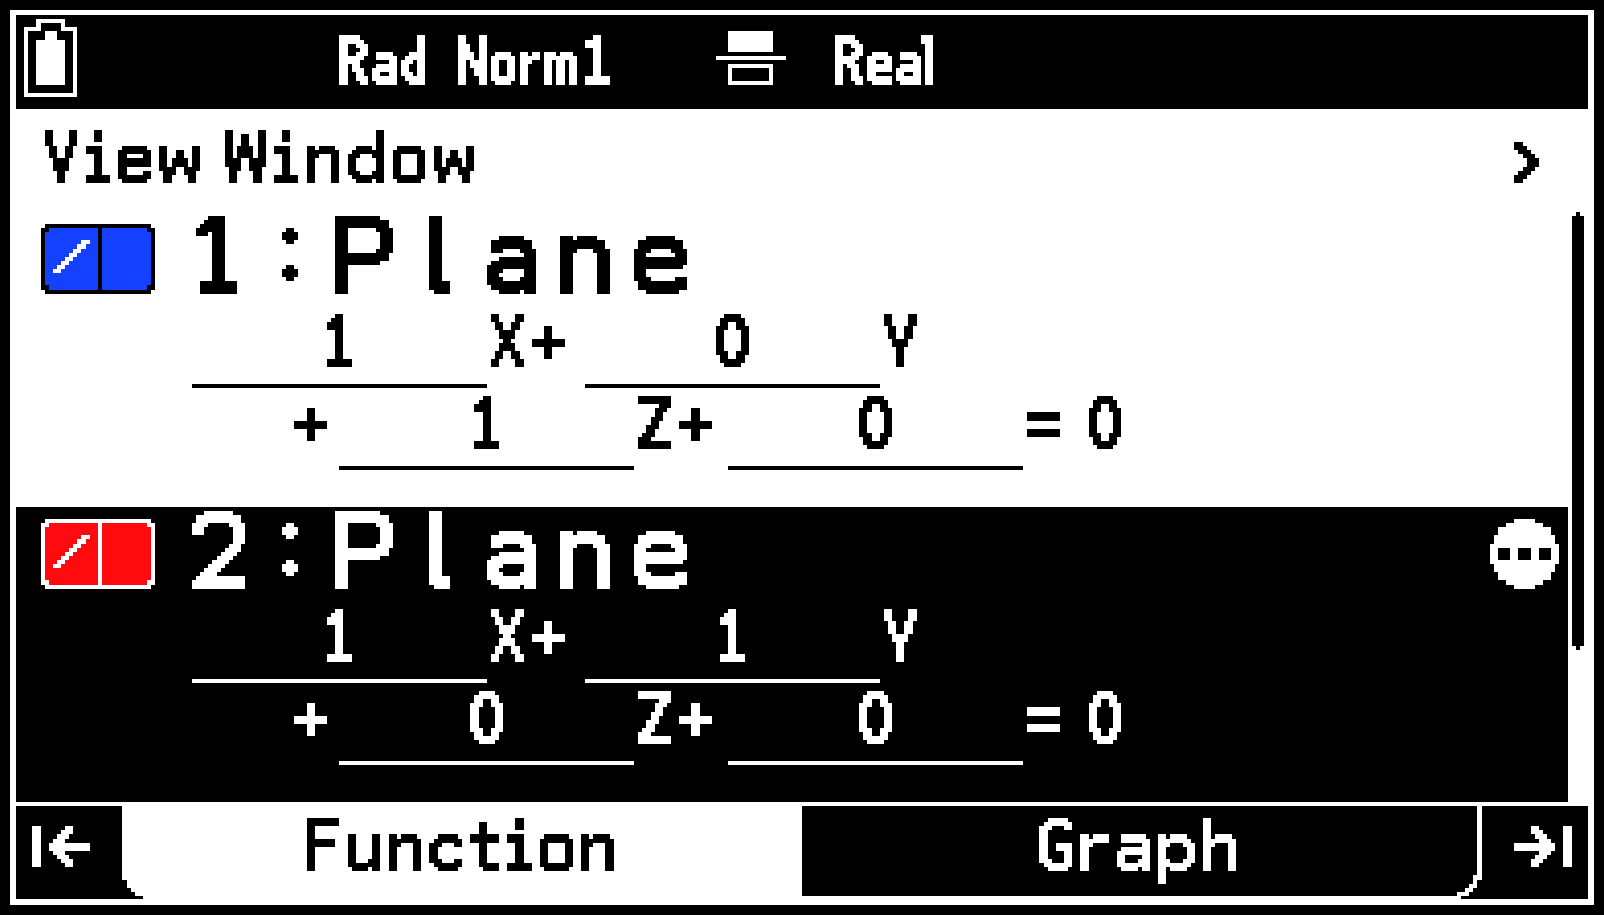
This displays the intersect of the two planar graphs. The parametric equation of the intersect is shown in the lower left corner of the display.
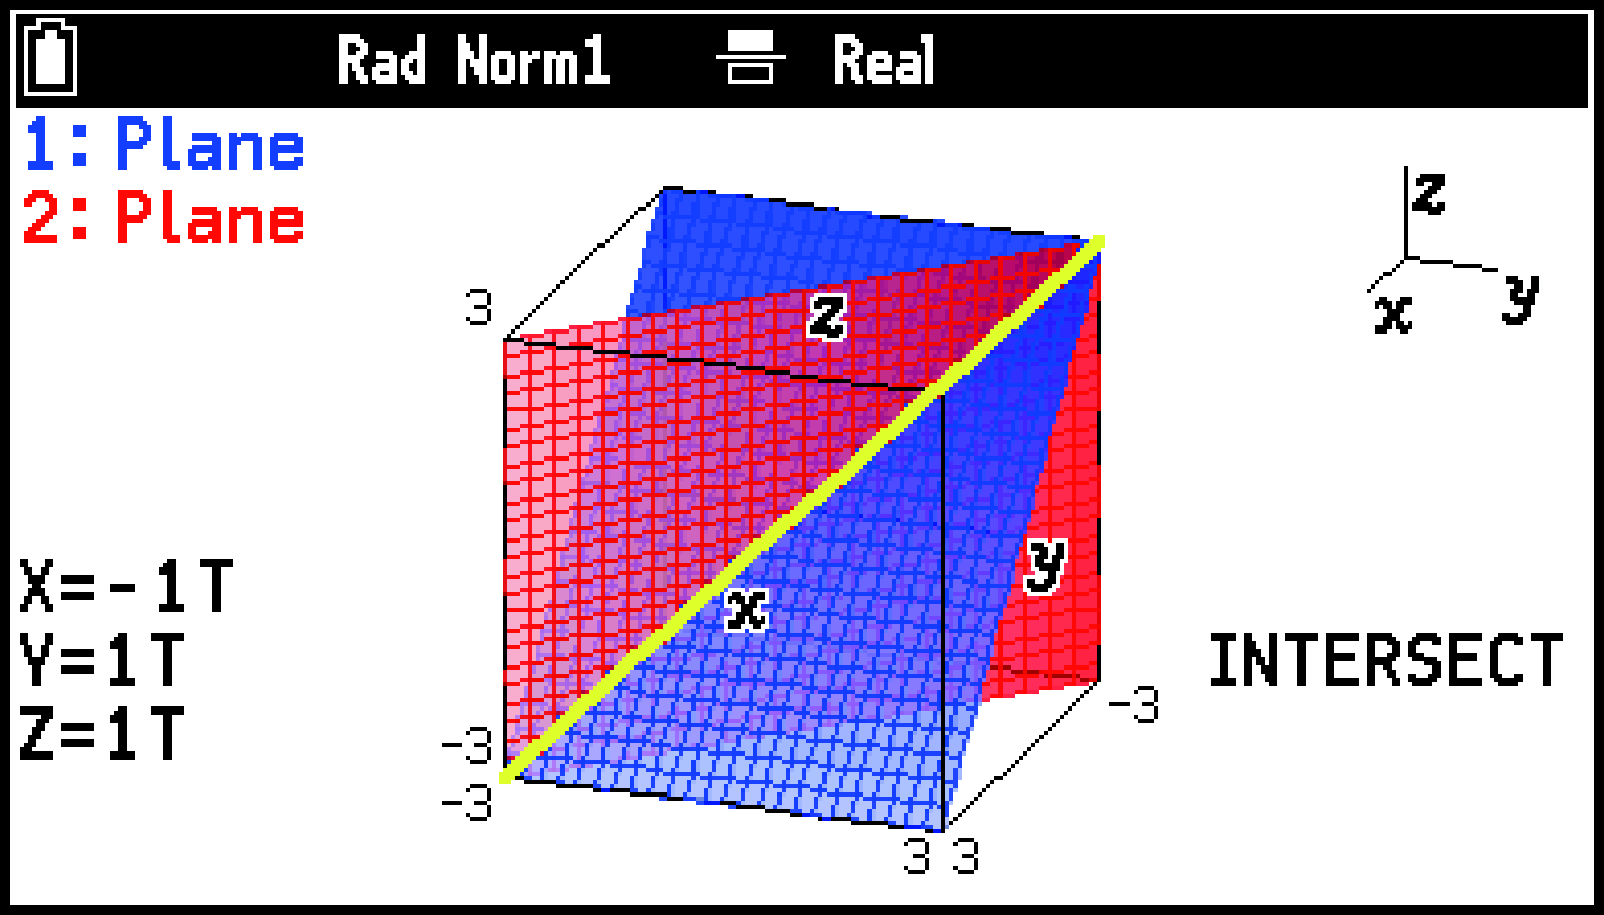
Note
The message “NOT FOUND” appears if the two 3D graphs do not intersect.
The message “COINCIDENT” appears in the cases described below.
Two straight lines that are being considered align perfectly
Two planes that are being considered overlap completely
A line and plane are being considered, and the line is on the plane
When there are three straight lines or planes, you can change how they are combined by pressing U or D.
Determining the Relationship Between Straight Lines or Planes (fx-CG100 only)
You can determine the relationship between two 3D graphs using the combinations below.
|
For this combination: |
You can determine these types of relationships: |
|---|---|
|
Line-line |
Intersect, orthogonal, parallel, skew lines, or same line |
|
Line-plane |
Intersect, orthogonal, parallel, or line on the plane |
|
Plane-plane |
Intersect, orthogonal, parallel, or same plane |
This operation can be performed on lines and/or planes drawn using a template.
Example: To graph line and plane , and determine the relationship between them
-
On the Function tab, use the templates to store the equations of the line and plane.
-
Press > to draw the graph.
-
Select T > [Graph Solve] > [Relationship].
T > [Enter Equation] > [Templates] >
[Line] > [ ]
]
s-(M)1Es-(M)2E1E1E1E0EE
dT > [Enter Equation] > [Templates] >
[Plane] > [ ]
]
1E2E0E1E1E0E0E1E1EE
A message indicating the relationship between the line and the plane is displayed in the lower left corner of the display. In this example, the relationship is “PARALLEL”.
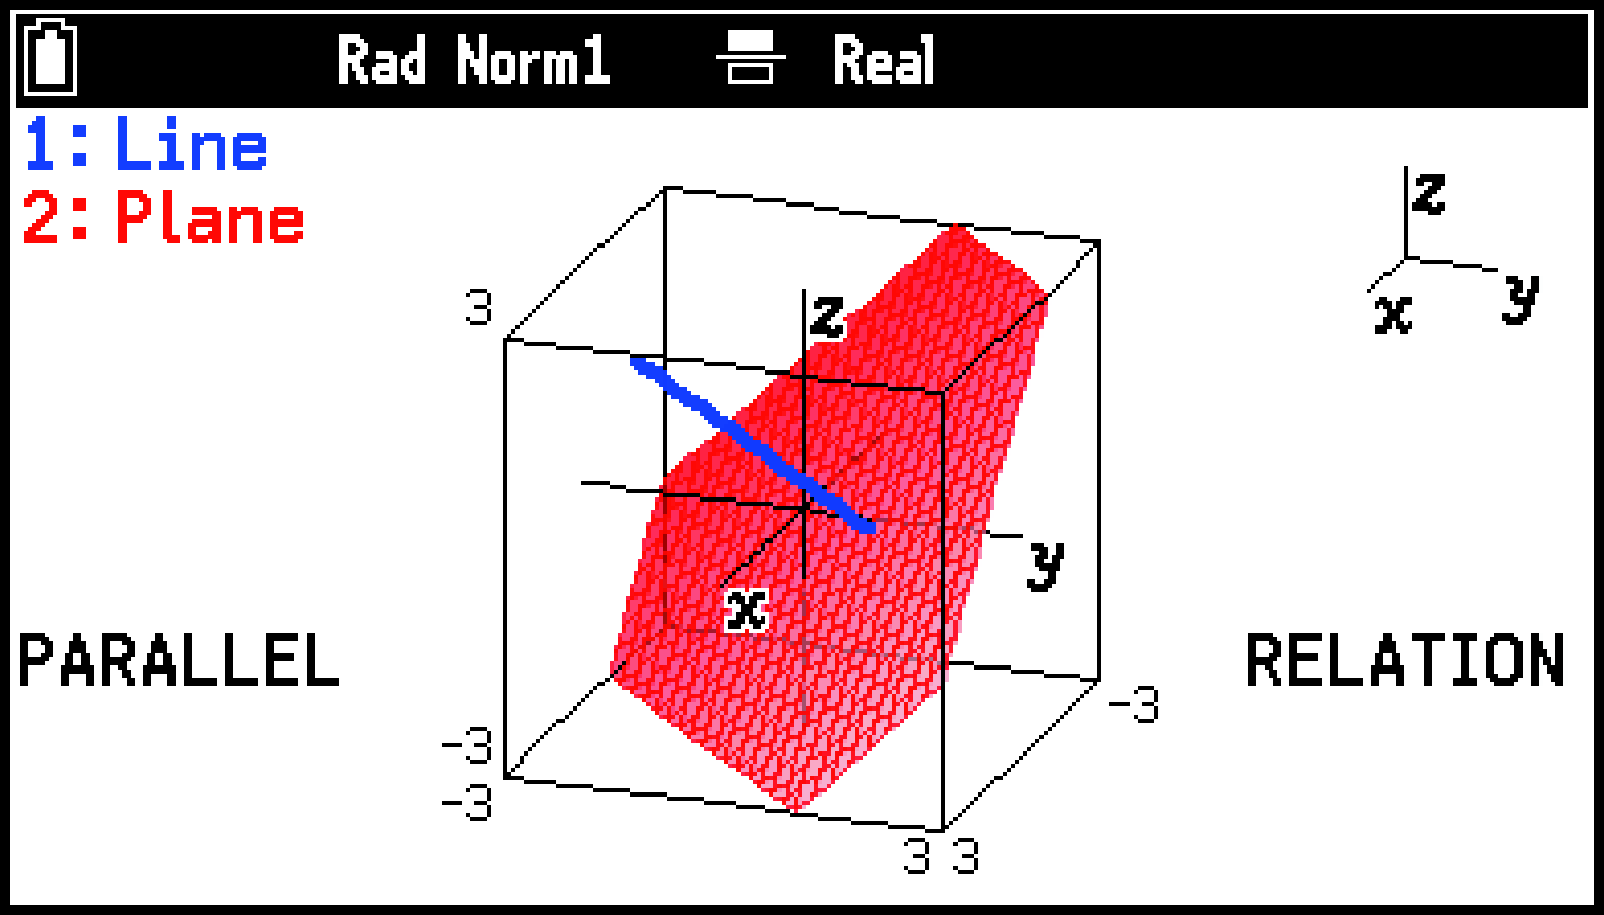
The meanings of the relationship messages that appear in the lower left corner of the display are shown in the table below.
|
Message |
Meaning |
|---|---|
|
INTERSECT |
Intersecting point or lines |
|
ORTHOGONAL |
Perpendicular intersection |
|
PARALLEL |
Parallel |
|
SKEW LINES |
Skewed relationship |
|
COINCIDENT |
Same line |
|
ON THE PLANE |
Line on the plane |
|
COINCIDENT |
Same plane |
Note
When there are three straight lines or planes, you can change how they are combined by pressing U or D.
Using Trace (Trace)
Trace displays a crosshair pointer (![]() ) on a graph that you can use to read the coordinate values at a specific location. To enable trace, select T > [Trace].
) on a graph that you can use to read the coordinate values at a specific location. To enable trace, select T > [Trace].
The operations that can be performed while the trace function is enabled are described in the table below.
|
To do this: |
Perform this operation: |
|---|---|
|
Move the pointer along the graph |
Press d, u, l, or r. |
|
Move the pointer to a specific - and - coordinates on the graph |
Use the number keys to input -coordinate and -coordinate values and then press O. |
|
Move the pointer between graphs when multiple graphs are displayed |
Press D or U.* |
|
Exit trace |
Press b. |
If there is only one graph on the display and the crosshair pointer (![]() ) is shown (because you selected T > [Trace]), pressing D or U returns the pointer to its initial position.
) is shown (because you selected T > [Trace]), pressing D or U returns the pointer to its initial position.
Changing the Graph Window Zoom Setting (Zoom)
|
To do this within the graph window: |
Select T> [Zoom] and then select this: |
|---|---|
|
Zoom in or out on the center of the window |
[Zoom In][Zoom Out] |
|
Display the view along the positive -axis |
[View From pos x Direction] |
|
Display the view along the positive -axis |
[View From pos y Direction] |
|
Display the view along the positive -axis |
[View From pos z Direction] |
|
Return the 3D graph to its original (unrotated, unzoomed) state |
[Zoom Original] |
Auto Rotating a 3D Graph (Rotate)
You can rotate a 3D graph automatically using Auto Rotate. Auto rotation stops automatically after two rotations.
-
On the Graph tab, select T > [Rotate].
-
On the menu that appears, select a rotation direction.
To stop the auto rotation part way through, press a.
Using Sketch (Sketch)
You can use sketch to draw dots and text within the graphing area. The following table shows what you can do with sketch.
|
To do this: |
Select T> [Sketch] and then select this: |
|---|---|
|
Clear all points and text drawn using sketch |
[Clear Screen] |
|
Toggle a point*1 between draw and delete |
[Plot] |
|
Write text*1*2 |
[Text] |
Sketch points and text are drawn according to the settings of S > [Plot/Line Color].
Input is possible starting from the current pointer location and ending with the right edge of the graph window. I key operations while input is in progress are ignored.
3D Graph App Settings Menu Items
The Settings menu items described below are specific to the 3D Graph app.
S > [3D Axes] ... Shows/hides Cartesian coordinate axes in the graph window.
S > [Box] ... Shows/hides boxed axes in the graph window.
S > [3D Label] ... Shows/hides axis labels in the graph window.
Setting Examples
3D Axes: On
Box: On
3D Label: On
3D Axes: Off
Box: On
3D Label: On
3D Axes: On
Box: On
3D Label: Off