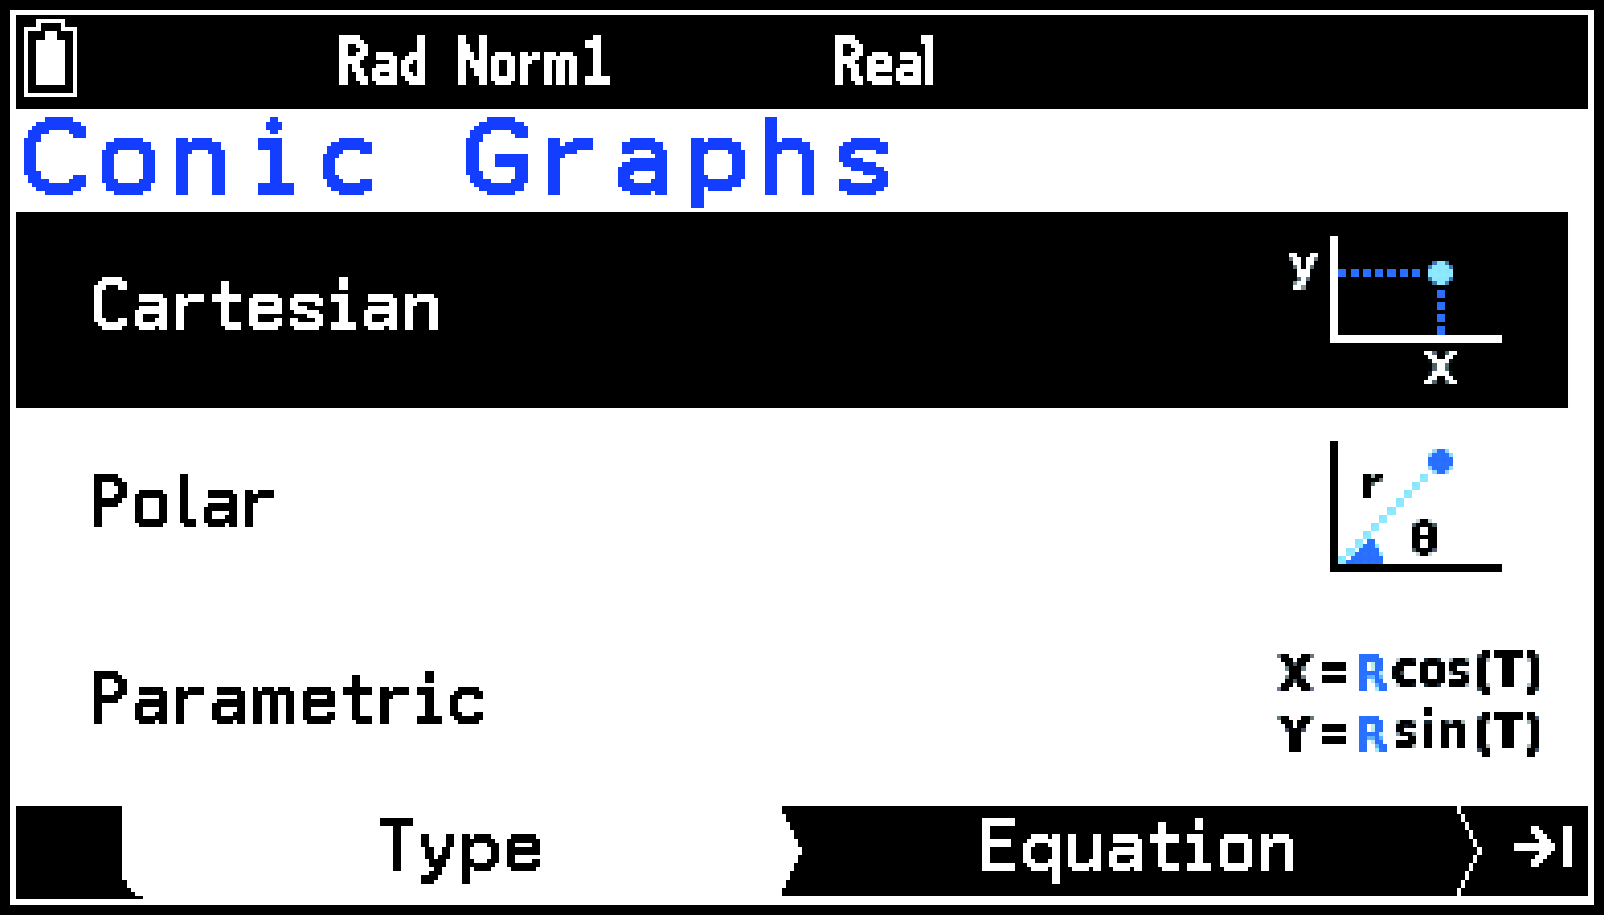
Conic Graphs App
You can use the Conic Graphs app to graph various types of conic curves (parabola, circle, ellipse, and hyperbola) using built-in Cartesian, polar, or parametric function equations.
Operation Flow
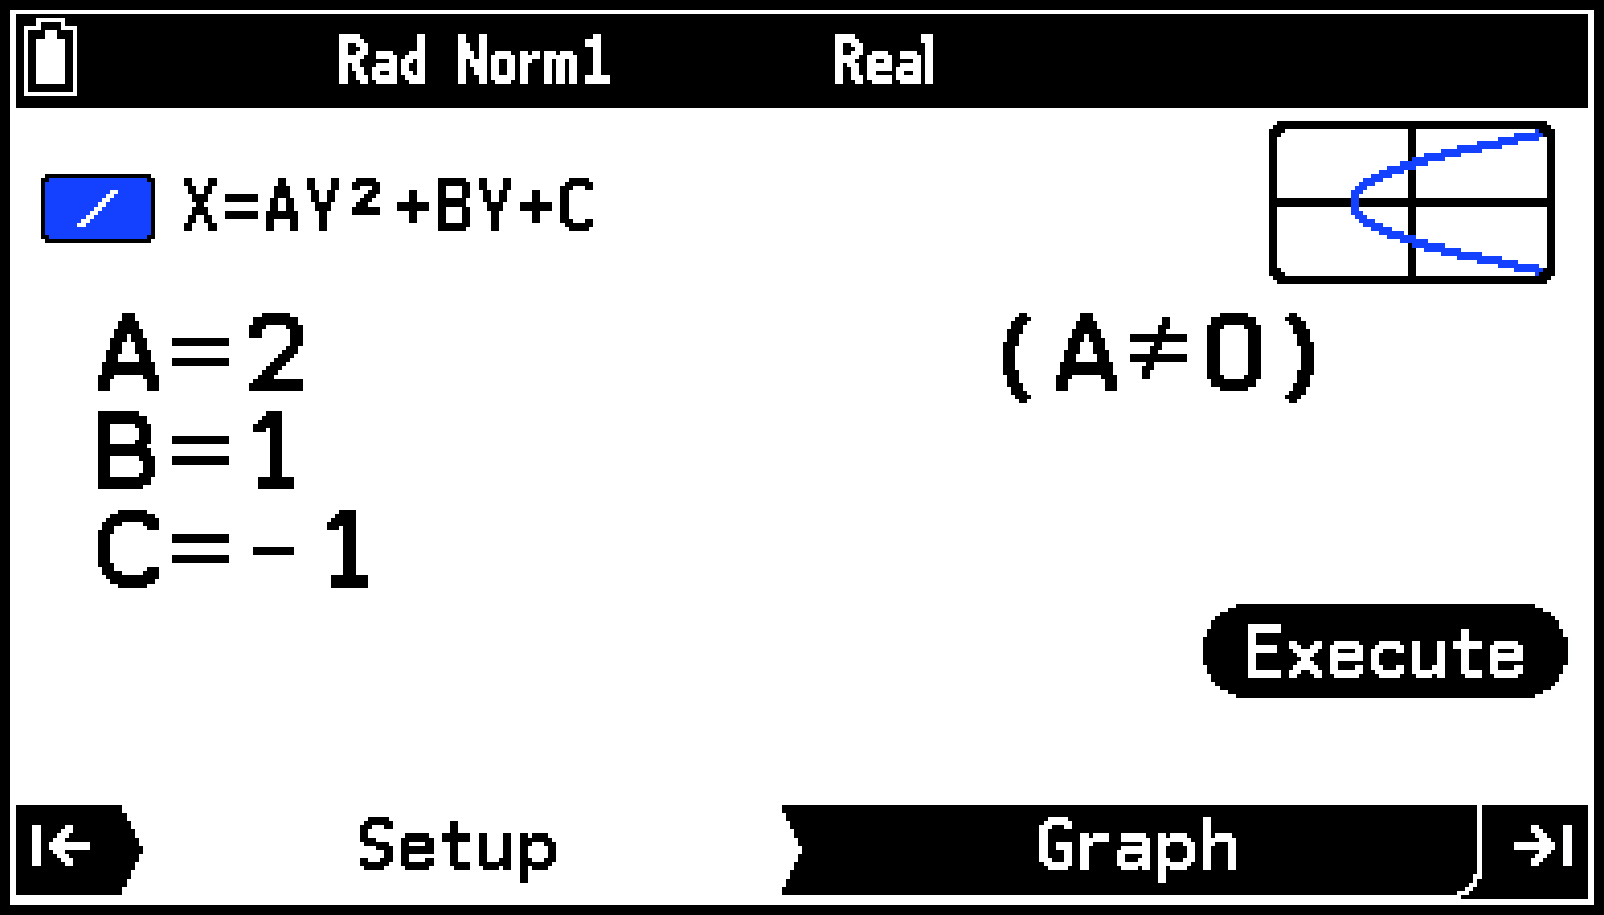
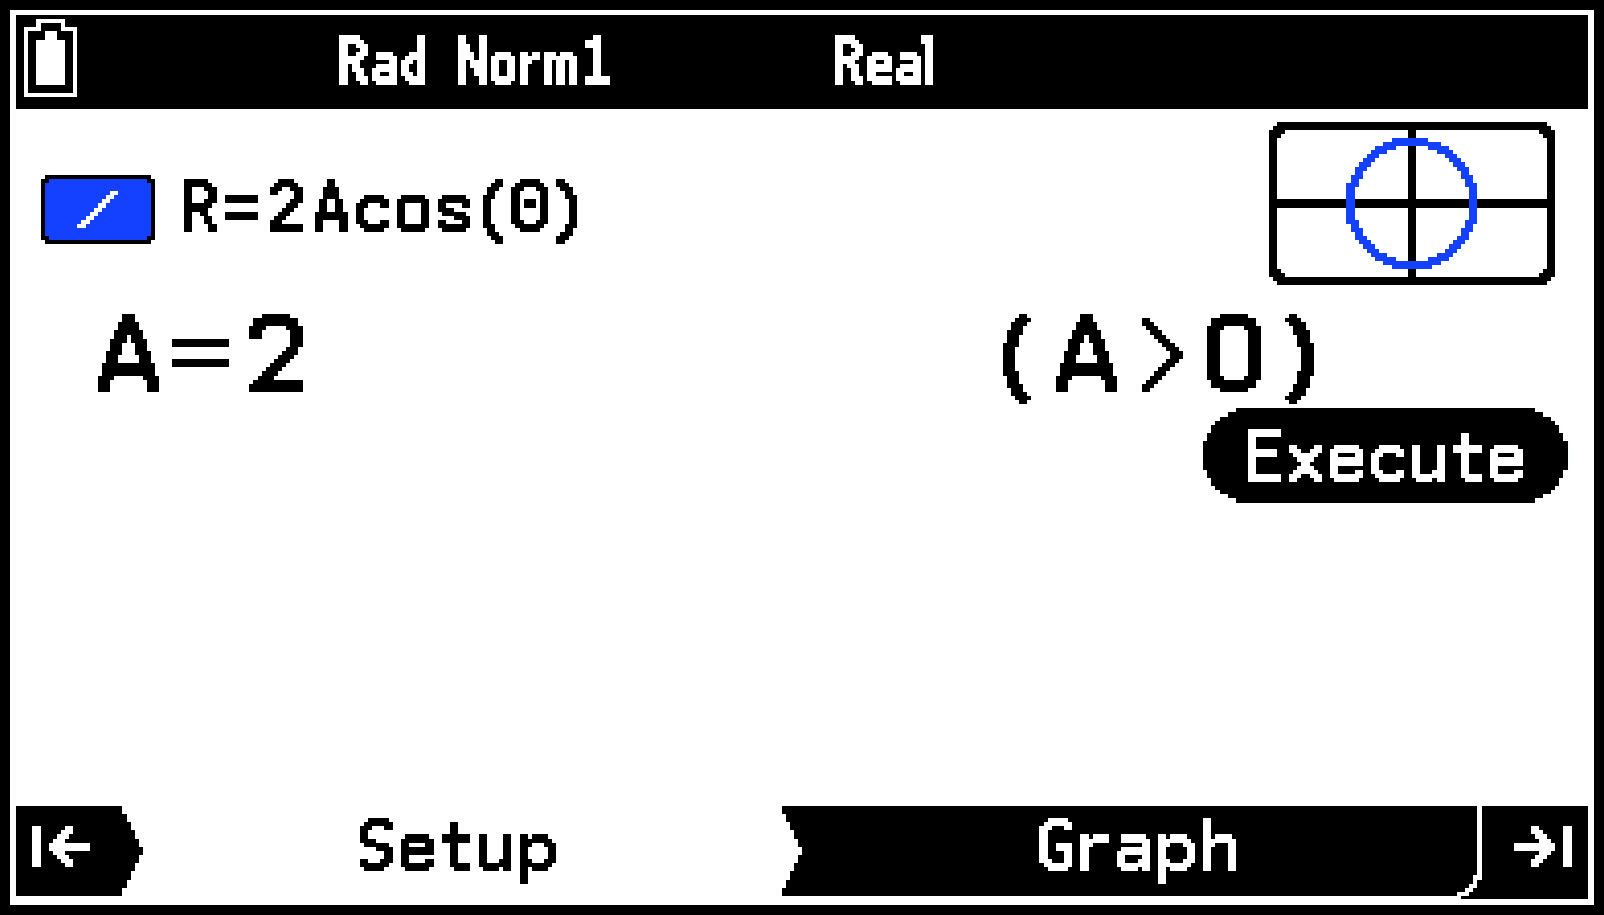
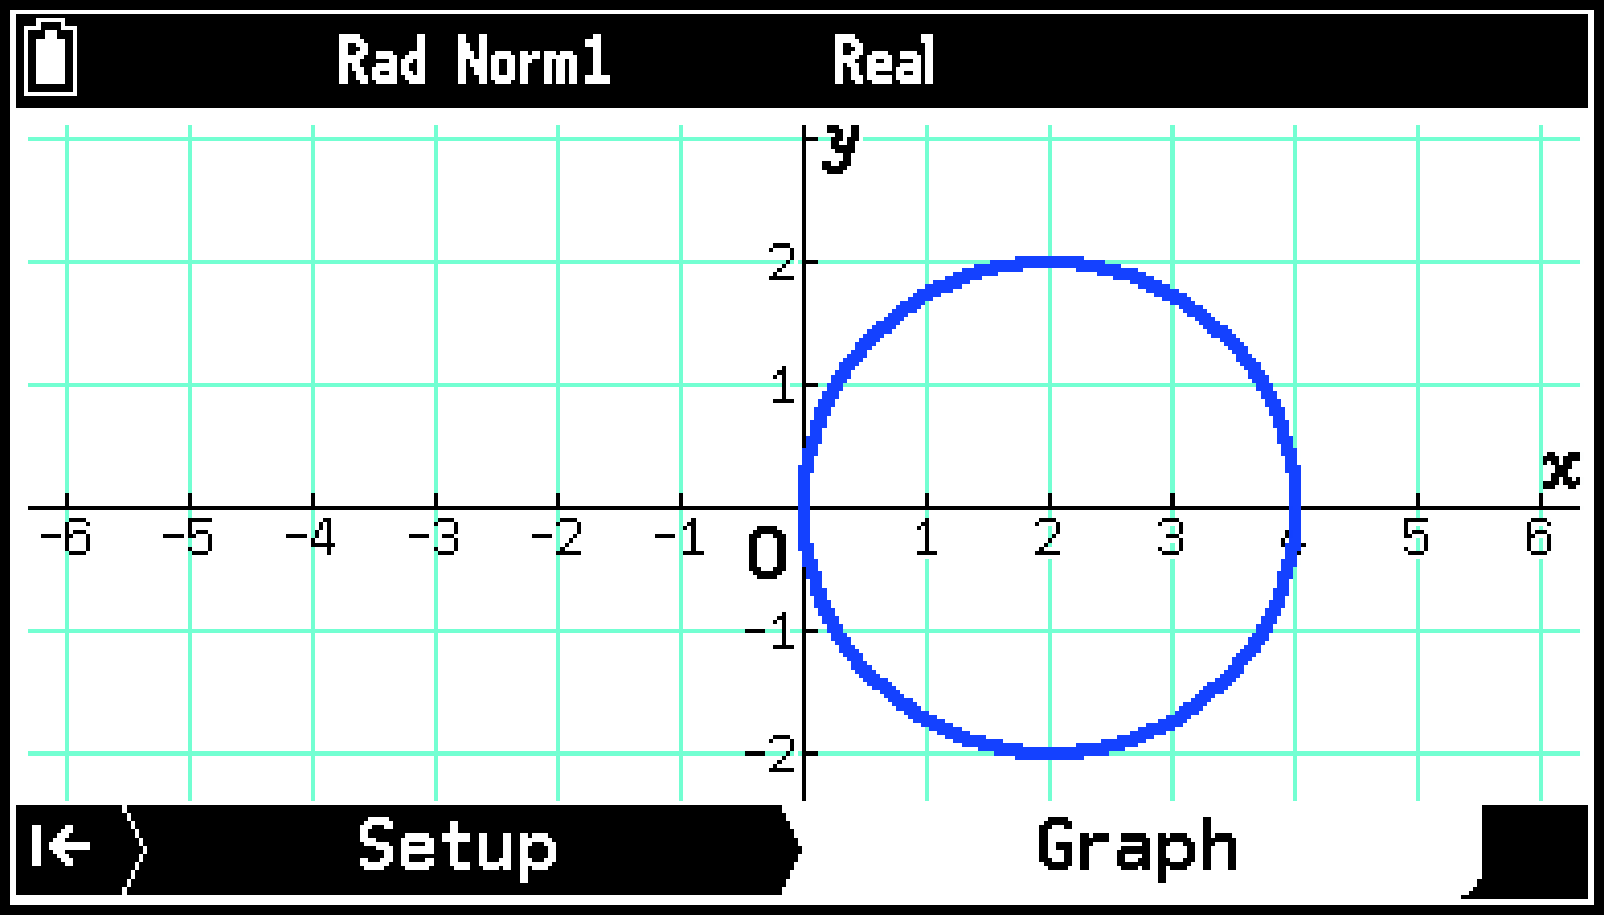
Example: To graph the parabola using the built-in Cartesian coordinate function equation X=AY2+BY+C. Next, use the built-in polar coordinate equation R=2Acos(θ) to graph the circle =4cos.
-
h > Conic Graphs
-
Highlight Cartesian and then press > (or O).
-
Highlight [X=AY2+BY+C] and then press > (or O).
-
Input the values of the coefficients of .
-
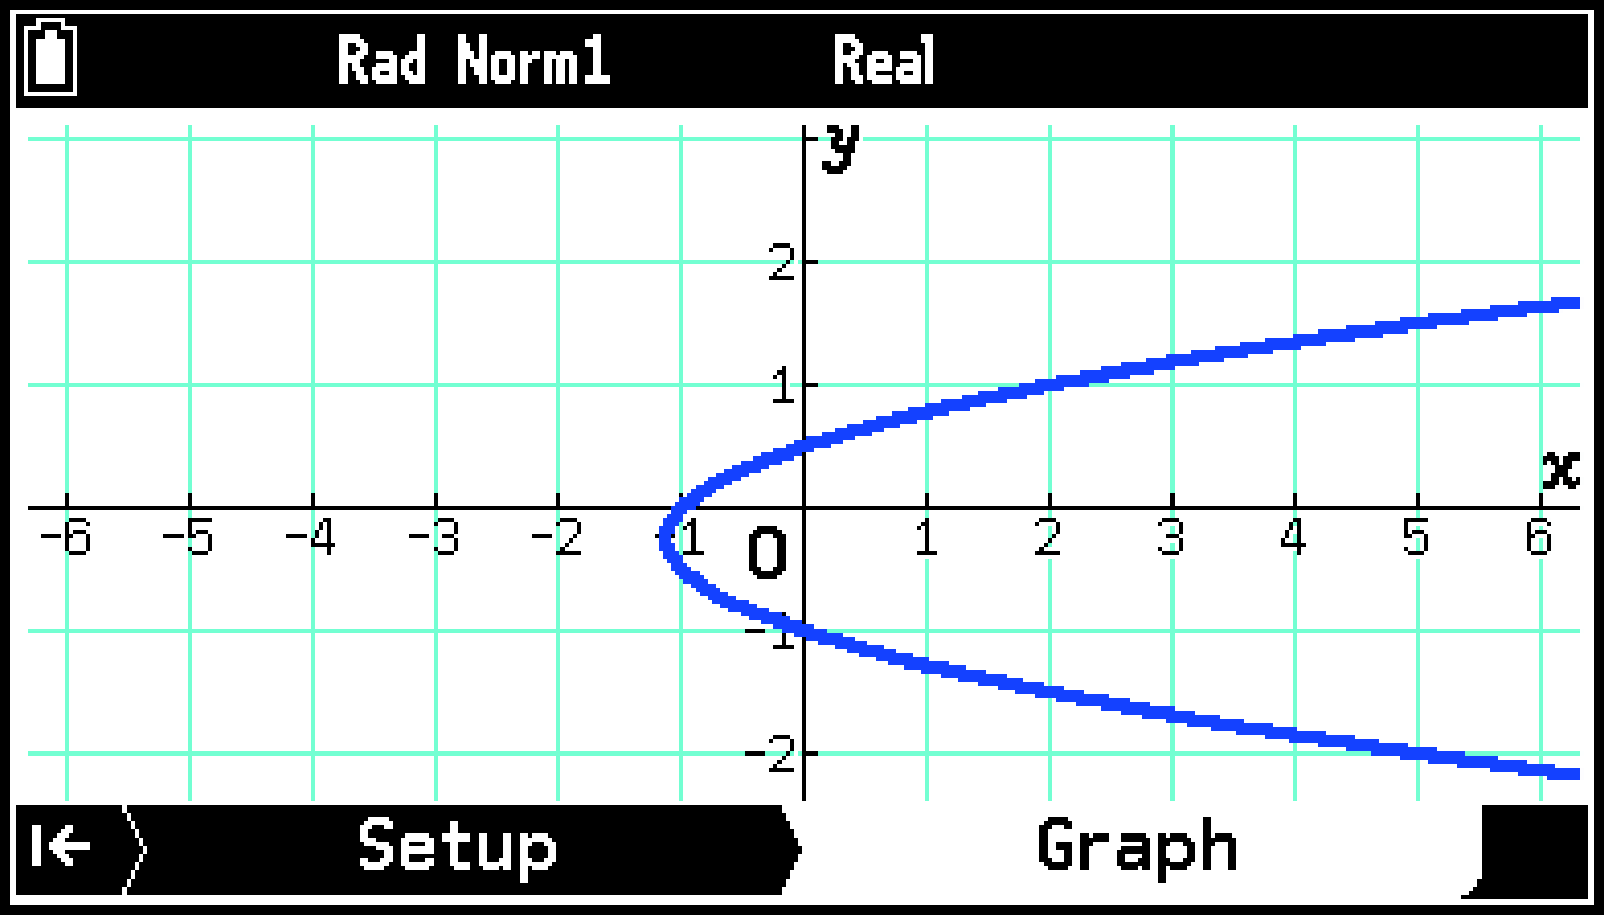
To draw the graph, press > (or O).
-
Highlight
 and then press O.
 -
Press < (or b) three times to return to the equation type menu.
-
Highlight Polar and then press > (or O).
-
Highlight [R=2Acos(θ)] and then press > (or O).
-
Input the values of the coefficients of =4cos (=2・2cos).
-
To draw the graph, press > (or O).
-
Next, on the View Window menu that appears, highlight
and then press O.
This displays a menu of equation types (Cartesian, Polar, Parametric).
This displays the Equation tab with a menu of Cartesian coordinate function equations.
This displays the Setup tab for input of coefficient values.
2E
1E
s-(M)1E
This displays the View Window menu. Change the range specification as required. For more information, see Specifying the Display Range of the Graph Window (View Window).
This draws the graph on the Graph tab.
This displays the Equation tab with a menu of polar coordinate function equations.
This displays the Setup tab for input of coefficient values.
2E
This draws the graph on the Graph tab.
Using the Setup Tab
In addition to inputting the values of coefficients of function equations, you can also use the Tools menu while on the Setup tab to perform the operations described below.
|
To do this: |
Perform this operation: |
|---|---|
|
Specify the display range |
Select T > [View Window]. See Specifying the Display Range of the Graph Window (View Window) for details. |
|
Change the line color for graph drawing |
Select T > [Line Color]. Use the list that appears to select a color. |
Using the Graph Tab
You can use the Tools menu while on the Graph tab to perform the operations described below.
|
To do this: |
Select this menu item: |
Details: |
|---|---|---|
|
Specify the display range |
T > [View Window] |
Specifying the Display Range of the Graph Window (View Window) |
|
Obtain the coordinates of the -axis or -axis intercept or other key feature points of a graph |
T > [Graph Solve] |
|
|
Display a pointer on a graph and read the coordinate values |
T > [Trace] |
|
|
Modify a graph by changing the coefficient values of its function |
T > [Modify] |
|
|
Zoom in and out of the display |
T > [Zoom] |
|
|
Draw dots, lines, characters, etc. |
T > [Sketch] |
|
|
Grab a point on a window and drag it around the display |
T > [Pan] |
Grabbing a Point on a Window and Drag It Around the Display (Pan) |
|
Adjust the background image |
T > [Fade I/O] |
The Sketch menu of the Conic Graphs app does not include the following items. Tangent Line, Normal Line, Inverse
Using Graph Solve (Graph Solve)
Depending on the type of graph currently on the display, you can use Graph Solve to calculate specific coordinate values (such as the coordinates of the center point of a circle) or to draw specific lines (such as a parabolic directrix). The table below shows what you can do with Graph Solve.
|
To do this: |
Select T > [Graph Solve] and then select this: |
Parabola |
Circle |
Ellipse |
Hyperbola |
|---|---|---|---|---|---|
|
Calculate the focus |
[Focus] |
Yes |
- |
Yes |
Yes |
|
Draw the directrix |
[Directrix] |
Yes |
- |
- |
- |
|
Calculate the vertex |
[Vertex] |
Yes |
- |
Yes |
Yes |
|
Draw the axis of symmetry |
[Axis of Symmetry] |
Yes |
- |
- |
- |
|
Calculate the length of the latus rectum |
[Latus Rectum] |
Yes |
- |
- |
- |
|
Calculate the center |
[Center] |
- |
Yes |
Yes |
Yes |
|
Calculate the radius |
[Radius] |
- |
Yes |
- |
- |
|
Draw the asymptotes |
[Asymptotes] |
- |
- |
- |
Yes |
|
Calculate the eccentricity |
[Eccentricity] |
Yes |
- |
Yes |
Yes |
|
Calculate the -axis intercept |
[x-Intercept] |
Yes |
Yes |
Yes |
Yes |
|
Calculate the -axis intercept |
[y-Intercept] |
Yes |
Yes |
Yes |
Yes |
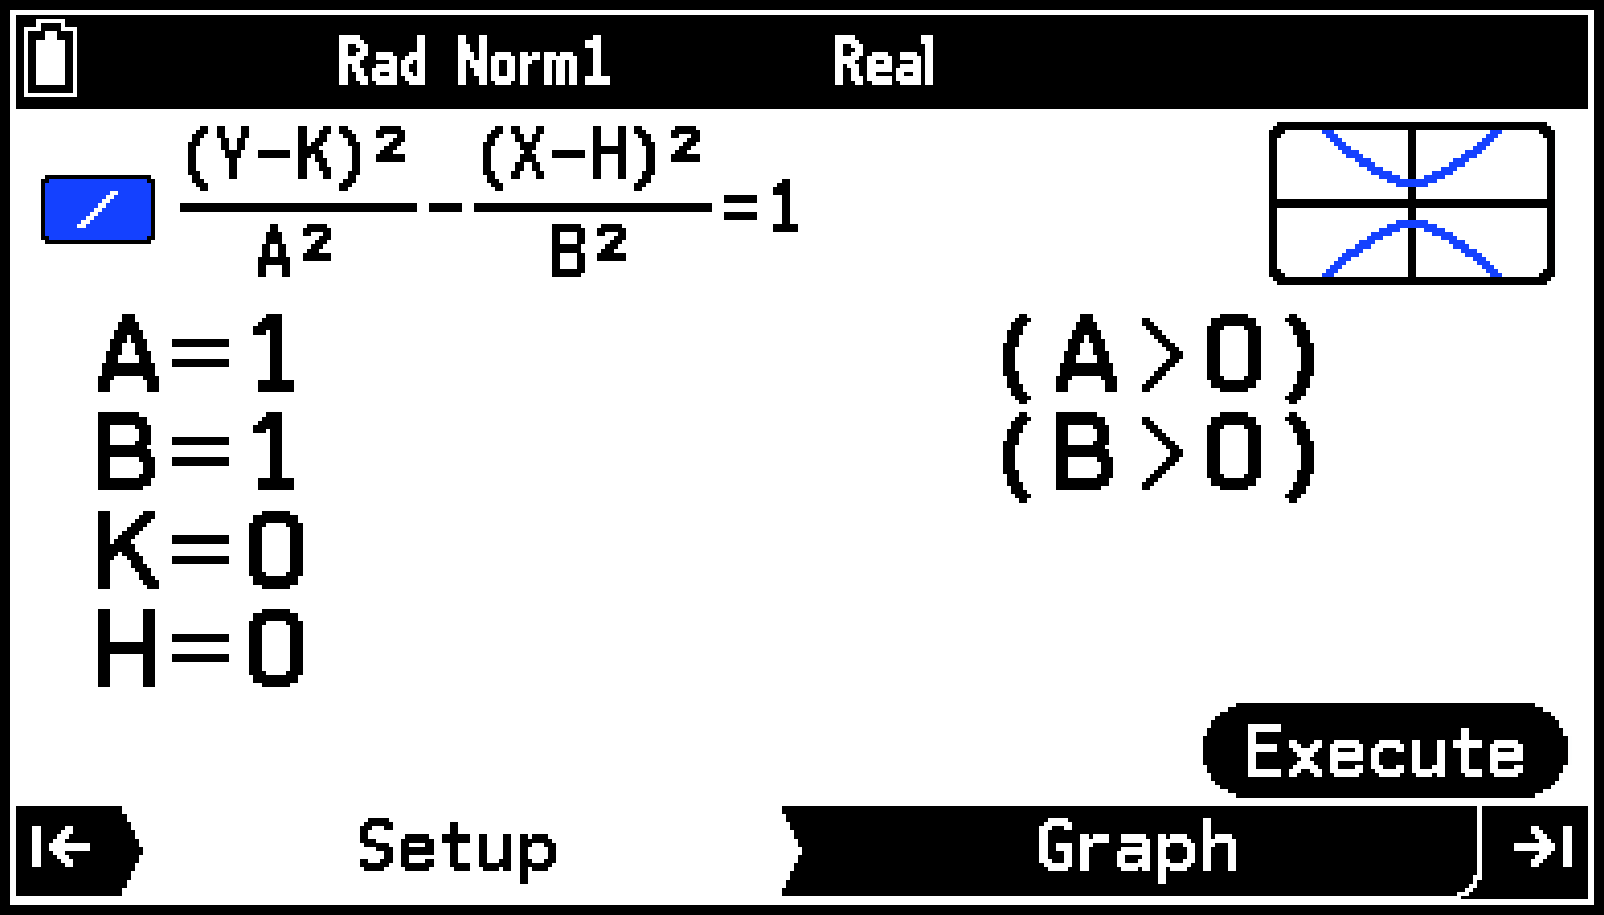
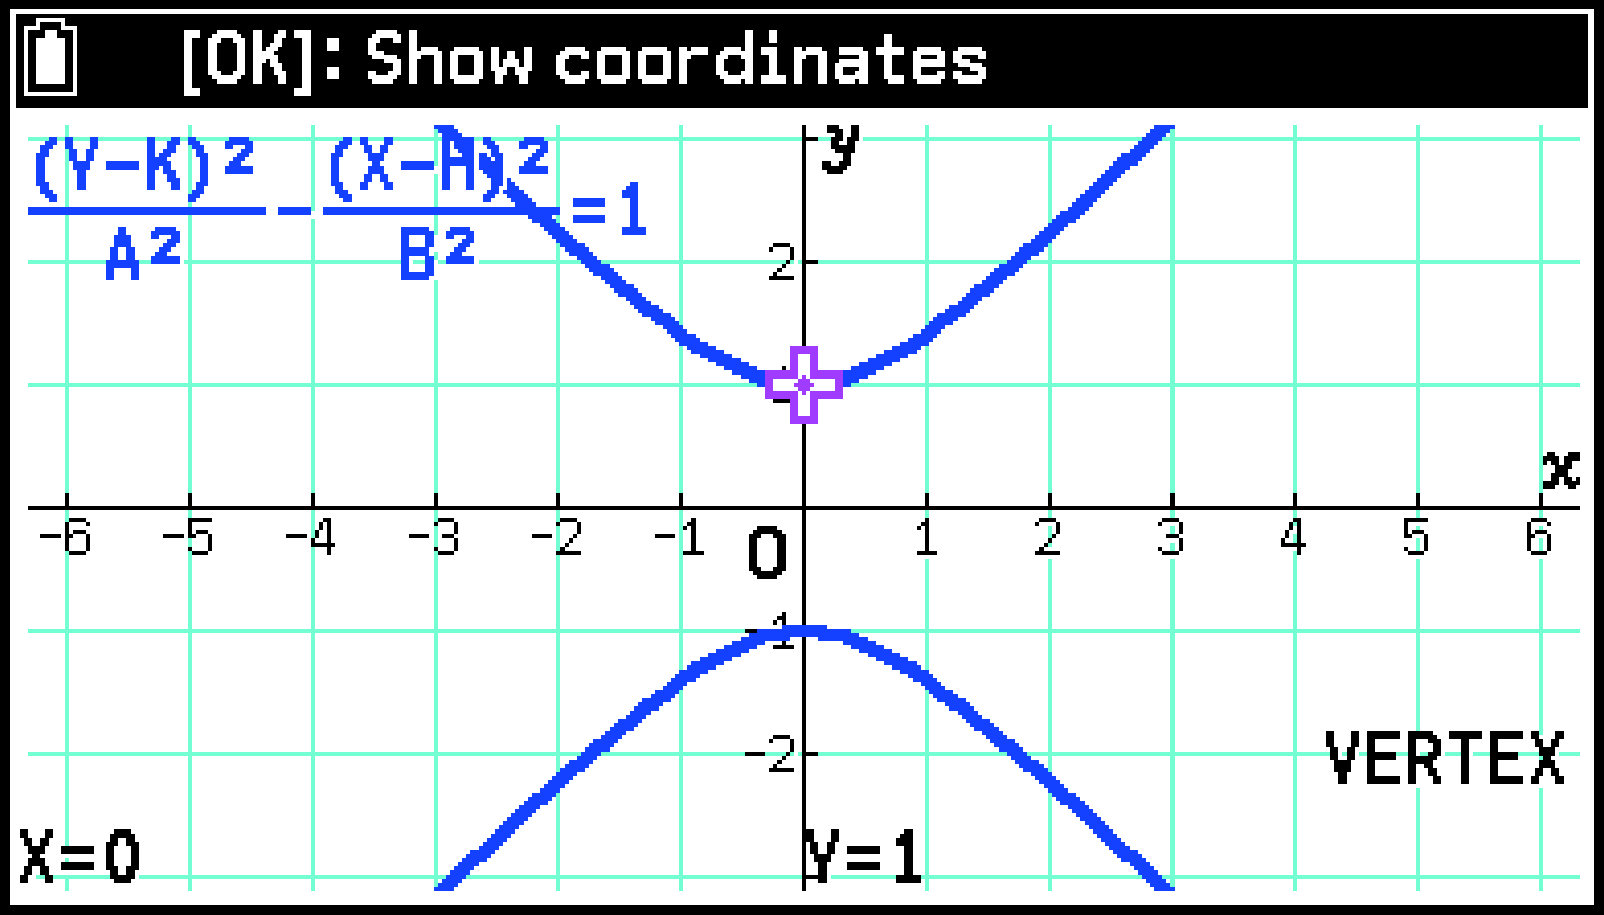
Example: To graph the hyperbola and then determine their vertices
-
On the Type tab, highlight [Cartesian] and then press O.
-
Highlight [] and then press O.
-
On the Setup tab, input the coefficients of the function.
-
Press > to draw the graph.
-
Select T > [Graph Solve] > [Vertex].
-
To exit Graph Solve, press b.
1E
1E
0E
0E
This causes a cross pointer (![]() ) to appear at the coordinates of the first vertex and the coordinate values to appear at the bottom of the window.
) to appear at the coordinates of the first vertex and the coordinate values to appear at the bottom of the window.
Press l or r to calculate the second vertex. Pressing l or r returns to the first vertex.
Note
When calculating two foci for an ellipse or hyperbolic graph, press l or r to calculate the second focus. Pressing l or r returns to the first focus.
Pressing r when calculating the vertices of an ellipse will calculate the next value. Pressing l will scroll back through previous values. An ellipse has four vertices.
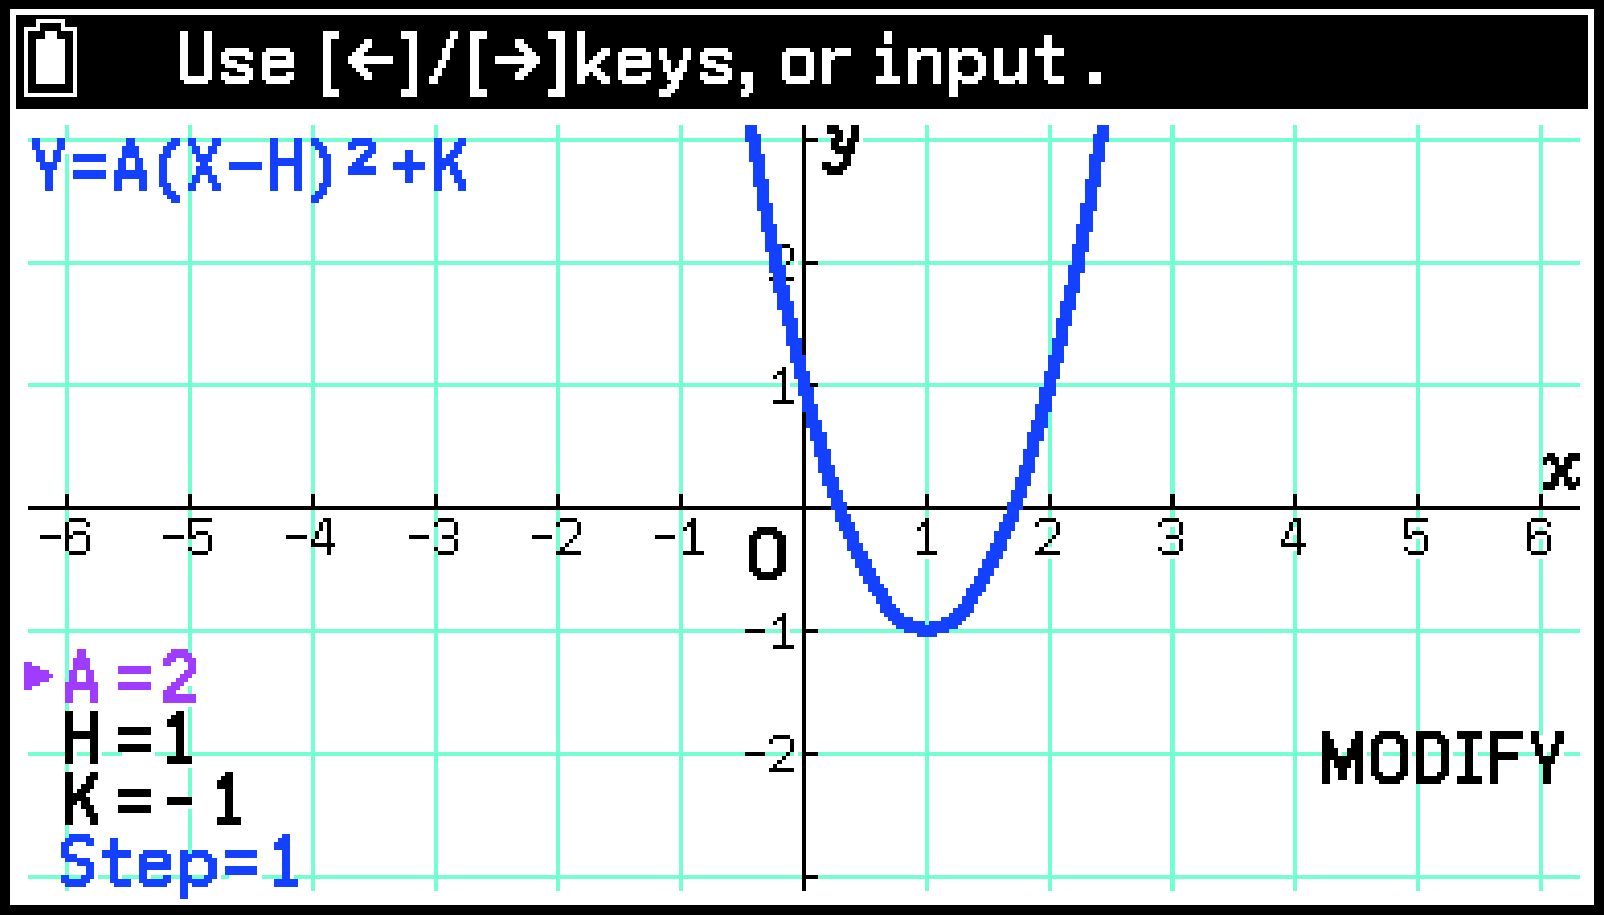
Modifying a Graph (Modify)
With the Conic Graphs app, you can select a built-in function equation, input coefficient values, and then draw a graph. By changing coefficient values while the graph is displayed, you can observe how each affects the graph.
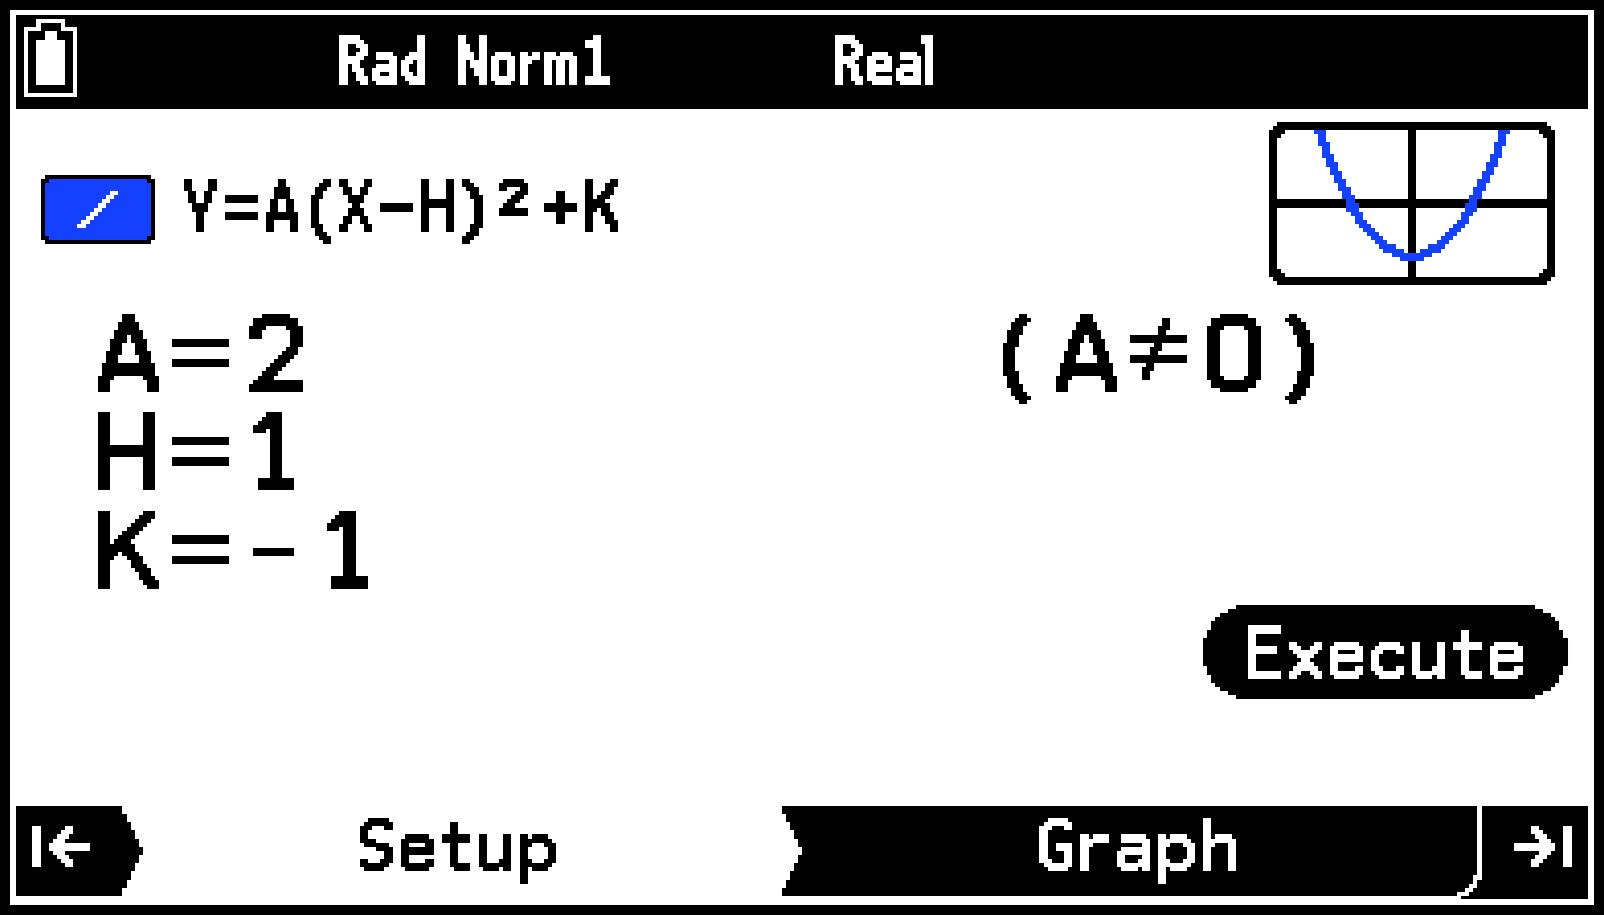
Example: To graph the parabola using the built-in Cartesian coordinate function equation Y=A(X−H)2+K. Next, observe how the graph changes as you vary the values of equation coefficients A, H, and K.
-
On the Type tab, highlight [Cartesian] and then press O.
-
Highlight [Y=A(X−H)2+K] and then press O.
-
On the Setup tab, input the coefficients of the function.
-
Press > to draw the graph.
-
Select T > [Modify] to enable modification.
-
Use l and r to change the value of A.
-
Press d to move the pointer (
 ) to H. Use l and r to change the value of H.
 -
Press d to move the pointer (
) to K. Use l and r to change the value of K. -
To exit modify, press b.
2E
1E
s-(M)1E
The current values of A, H, and K and the step value are displayed in the lower-left corner of the graph window. You can change the value where the pointer (![]() ) is currently located.
) is currently located.
Use d and u to move the pointer (![]() ) up and down.
) up and down.
Each press of l or r changes the value of A by the step value. You can also use the number keys to enter values.