Distribution App
The Distribution app can handle binomial distribution, normal distribution, Poisson distribution, and a variety of other types of probability distribution.
Note
Distribution calculation can also be performed with the Calculate app using the functions in C > [Distribution]. For information about available functions, see Distribution: Distribution Calculations.
Operation Flow
Step 1: Select a distribution (Select tab).
-
h > Distribution
-
Highlight the distribution you want to use for calculation and then press > (or O).
This displays the distribution selection menu.
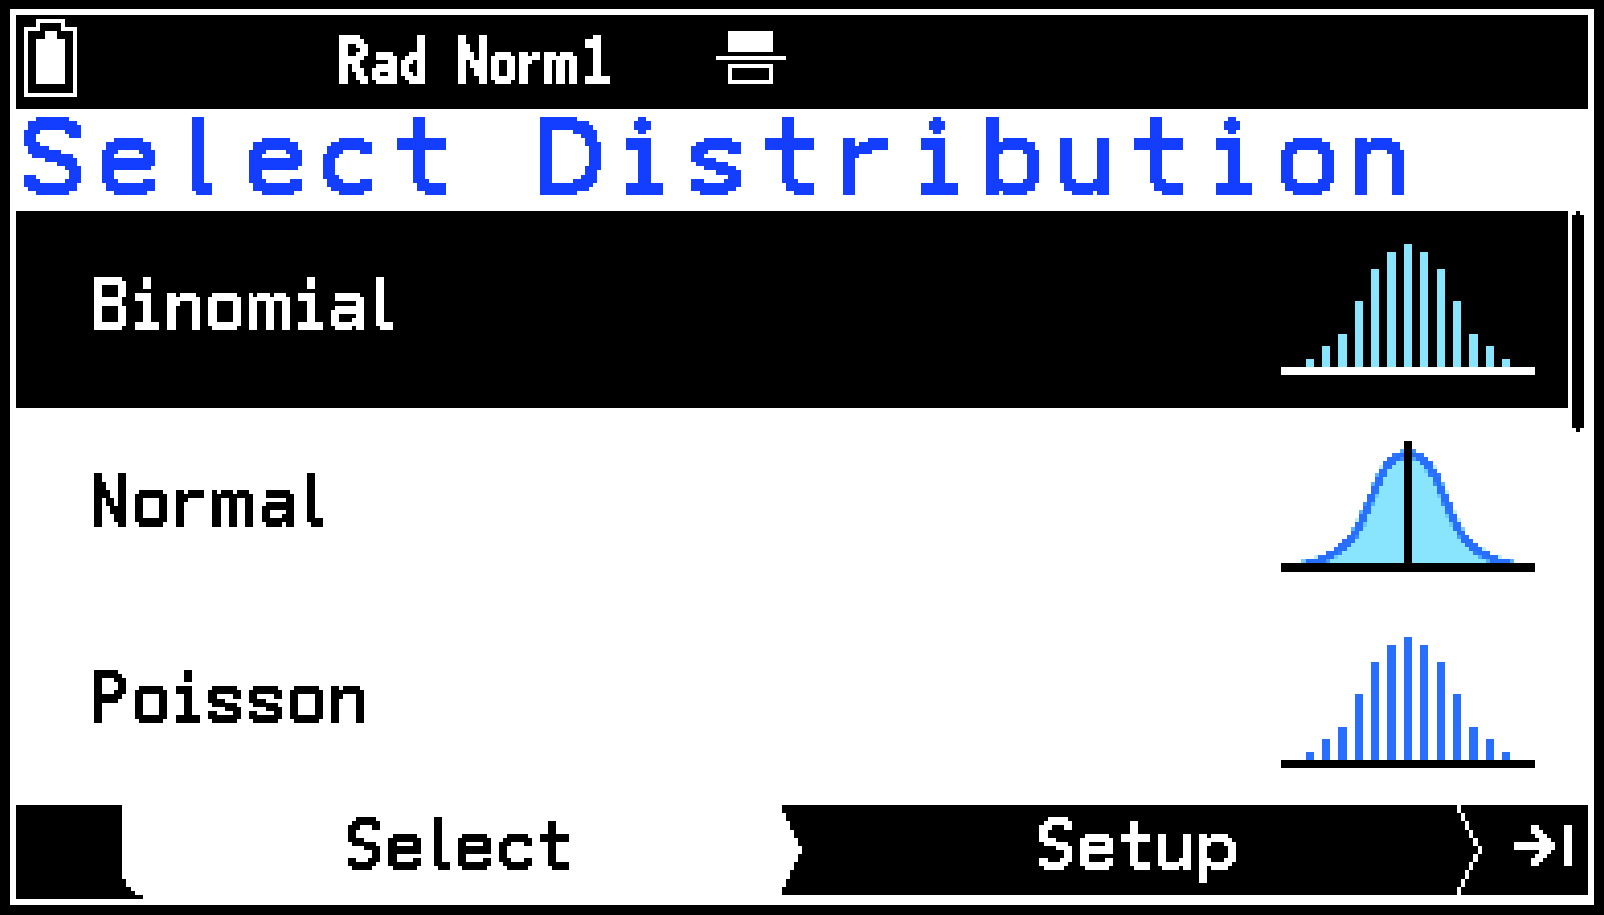
You can choose from among the distributions below.
Discrete distribution
Binomial distribution
Poisson distribution
Geometric distribution
Hypergeometric distribution
Continuous Distribution
Normal distribution
Student-t distribution
distribution
F distribution
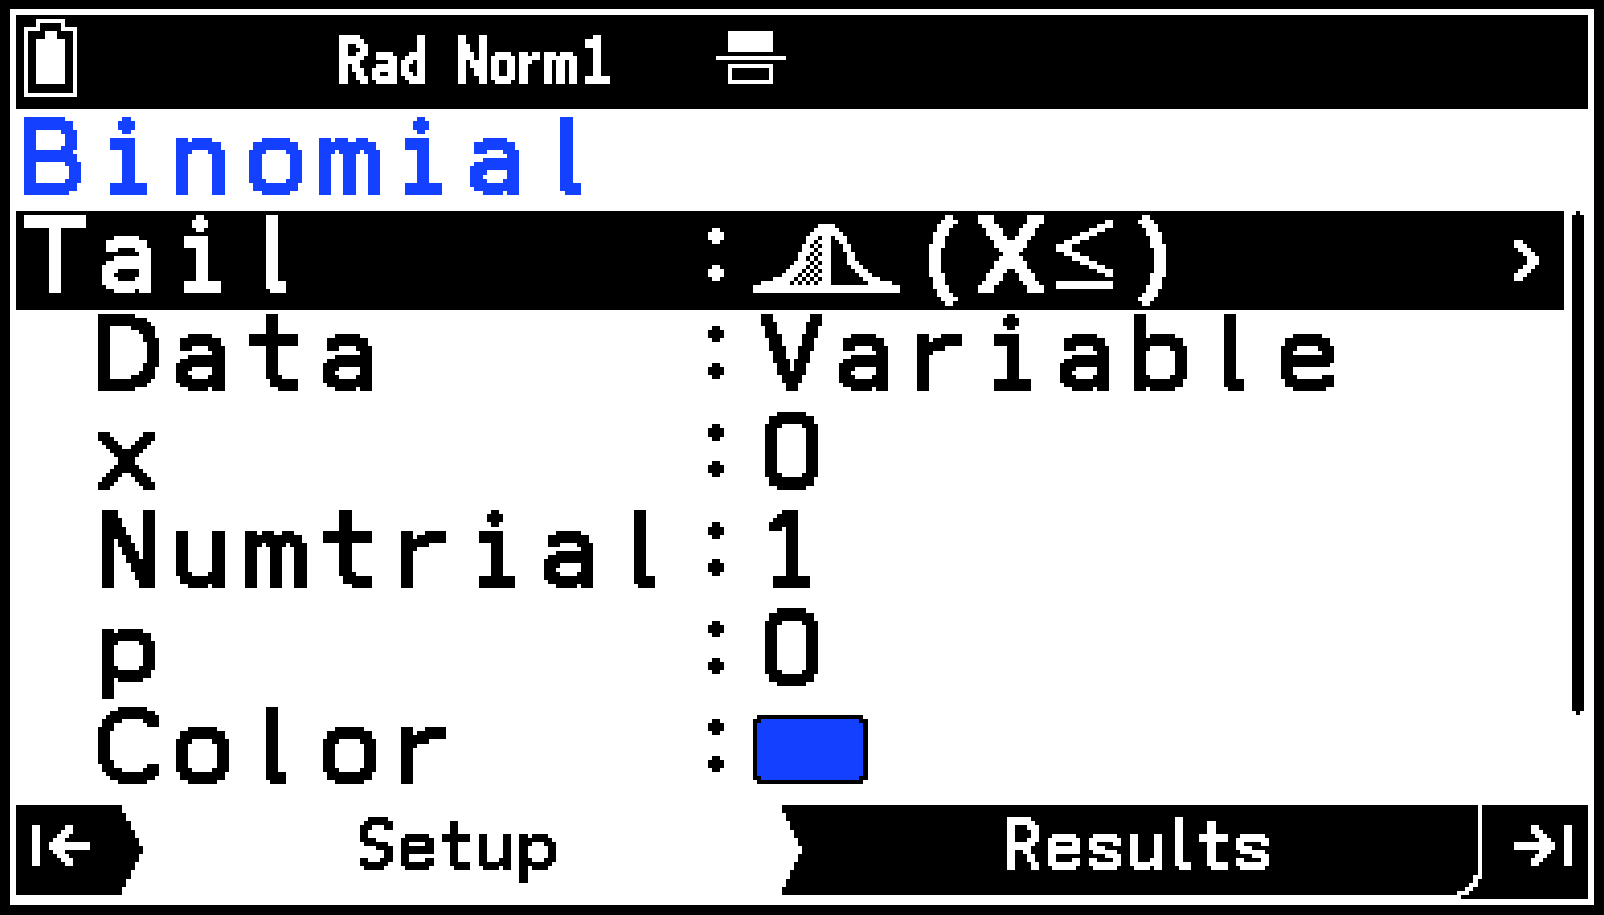
Step 2: Input parameters (Setup tab).
-
Select a tail setting for probability calculation.
-
Highlight [Tail] and then press O.
-
From the menu that appears, select one of the options described below.
-
Specify whether to use a single data value or multiple data values for the calculation.
-
Highlight [Data] and then press O.
-
Select [Variable] to use a single data value for calculation or [List] for multiple data values.
-
Input the other parameters.
[![]() ]:
]:
Calculates the cumulative probability for specified data value or lower.
[![]() ]:
]:
Calculates the cumulative probability for the lower (Lower) and upper (Upper) boundaries of the data values.
[![]() ]:
]:
Calculates the cumulative probability for specified data value or higher.
[![]() ]:
]:
Calculates the probability for given data value (discrete distribution only).
Parameters common to all distributions
Input the parameters below according to what you specified for [Tail] (step 3) and [Data] (step 4).
|
Tail Data |
|
|
|
Variable |
: Data value |
Lower: Data value lower limit Upper: Data value upper limit |
|
List |
List*1: List to use as data values |
L.List*1: List to use as the lower boundary of data values U.List*1: List to use as the upper boundary of data values |
For the operation to specify a list variable to use as data values, see To specify a list variable to use as data values.
Distribution Type Specific Parameters
Binomial distribution
Numtrial: Number of trials
p: Probability of success (0 ≤ p ≤ 1)
Normal distribution
DisplayZ: Displays Z-Scores*2
μ: Population mean
σ: Population standard deviation (σ > 0)
Poisson distribution
λ: Mean (λ > 0)
Geometric distribution
p: Probability of success (0 < p ≤ 1)
Hypergeometric distribution
n: Number of trials from population (0 ≤ n integer)
M: Number of successes in population (0 ≤ M integer)
N: Population size (n ≤ N, M ≤ N integer)
Student-t distribution
df: Degrees of freedom (df > 0)
distribution
df: Degrees of freedom (Positive integer)
F distribution
n:df: Degrees of freedom of numerator (Positive integer)
d:df: Degrees of freedom of denominator (Positive integer)
Select [On] to show Z-scores (standardized values) or [Off] to hide them. If you choose [On], calculation is performed as μ = 0 and σ = 1.
Note
You can specify the color of the graph by highlighting [Color] and then pressing O (only if you chose [Data] > [Variable] in step 4).
Selecting T > [Input Descriptions] displays explanations of the parameters.
Step 3: Display the calculation results (Results tab).
-
On the Setup tab, press >, or highlight
 and then press O.
Calculation results are displayed on the Results tab.
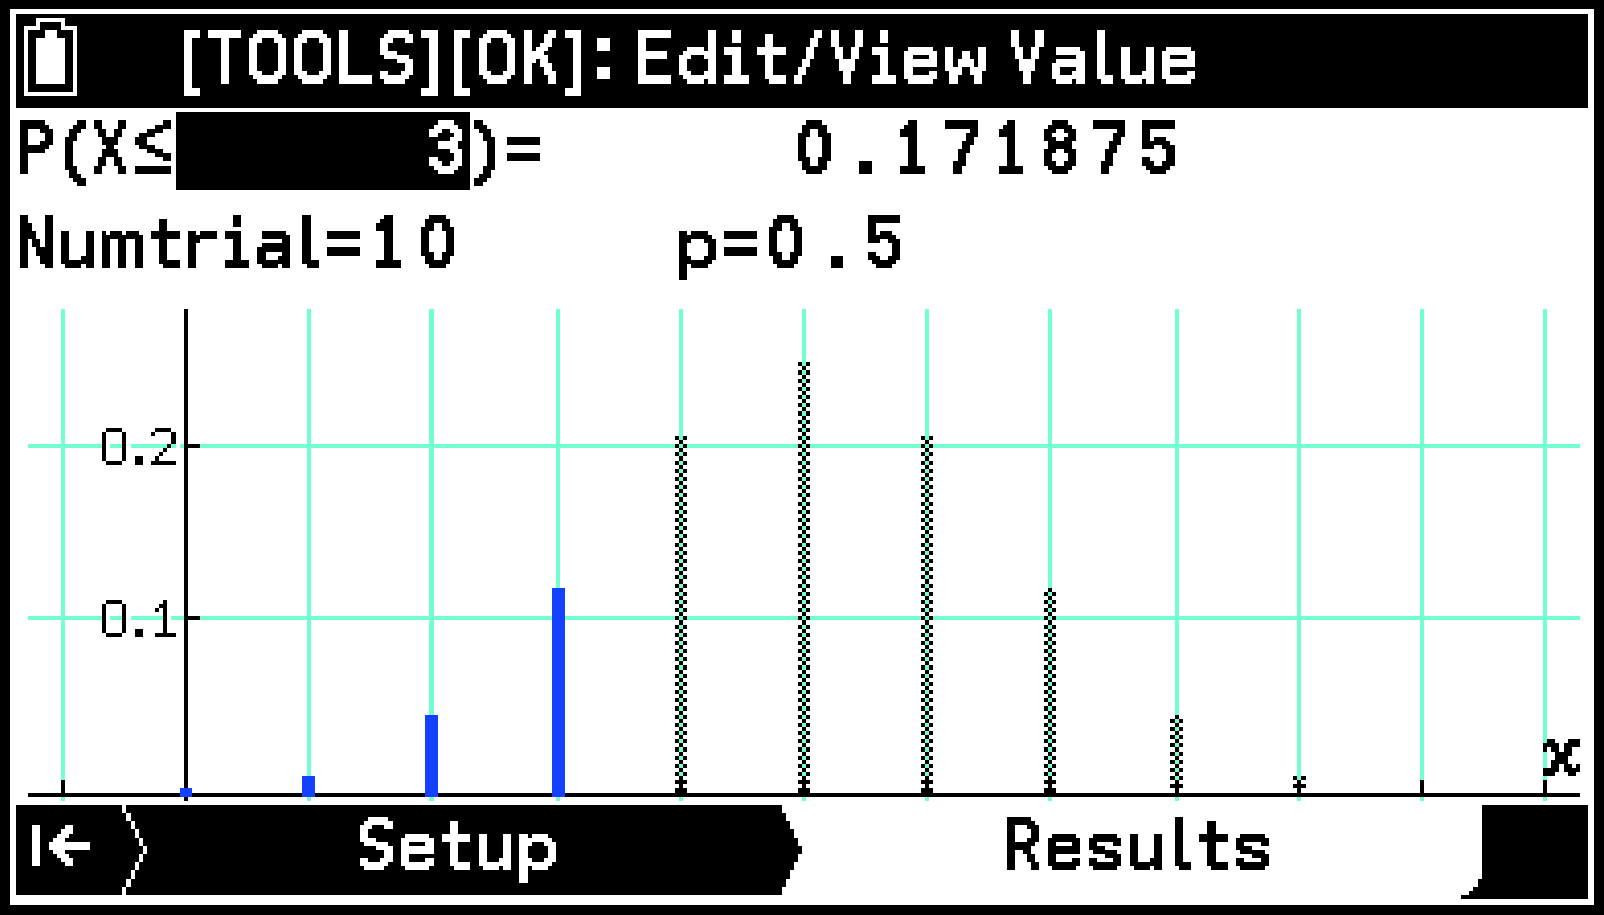
Single Data Value Calculation
(When [Data] > [Variable] selected.)
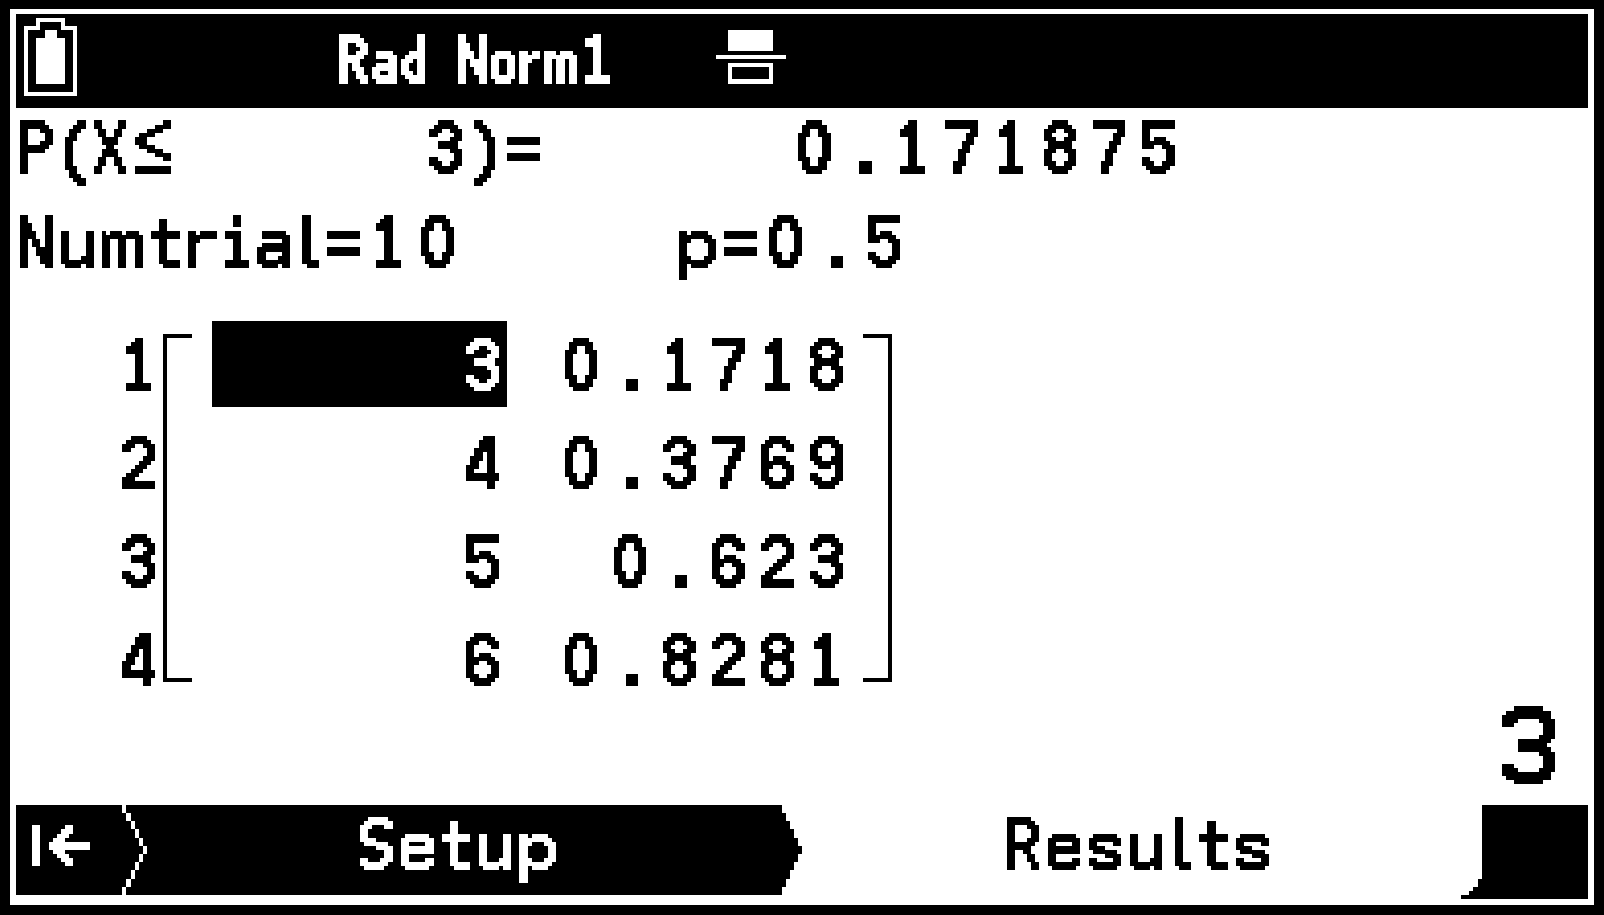
Multiple Data Value Calculation
(When [Data] > [List] selected.)
To specify a list variable to use as data values
When [Data] > [List] is selected on the Setup tab, use the following operation to specify the list variable to use as data values. The operations in steps 2 through 5 below are not necessary if you use a list variable that has already been saved.
-
On the Setup tab, highlight [List], [L.List], or [U.List] and then press O.
-
On the menu that appears, highlight [List Editor] and then press O.
-
Input data values in any one of the lists (List 1 through List 26).
-
After you finish inputting the data, press b.
-
Press O.
-
On the menu that appears, highlight [Select List] and then press O.
-
Use the dialog that appears to input a list number and then press O.
This displays List Editor.
For information about the input operation, see Inputting Data in List Editor.
Using the Results Tab
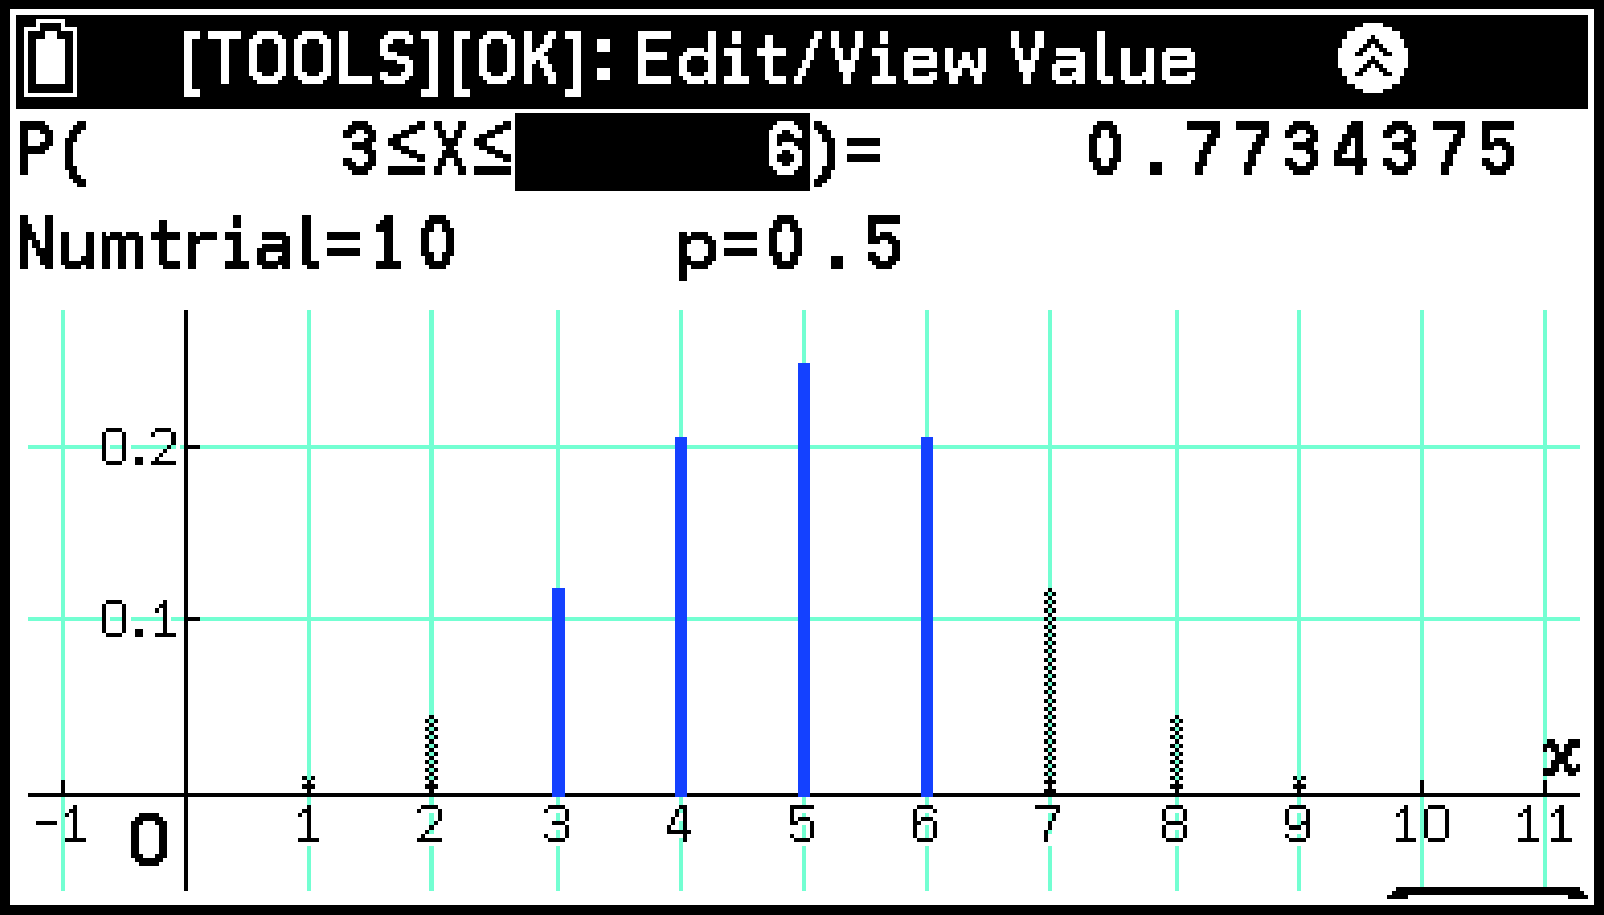
To change data values and recalculate probability values (Only when [Data] > [Variable] is selected.)
Highlight the value of , Lower, or Upper and then use the number keys or select T > [Edit/View Value] to change the value.
P (X ≤ ) = p
P ( Lower ≤ X ≤ Upper ) = p
P (X ≥ ) = p
P (X = ) = p*
Discrete distribution only
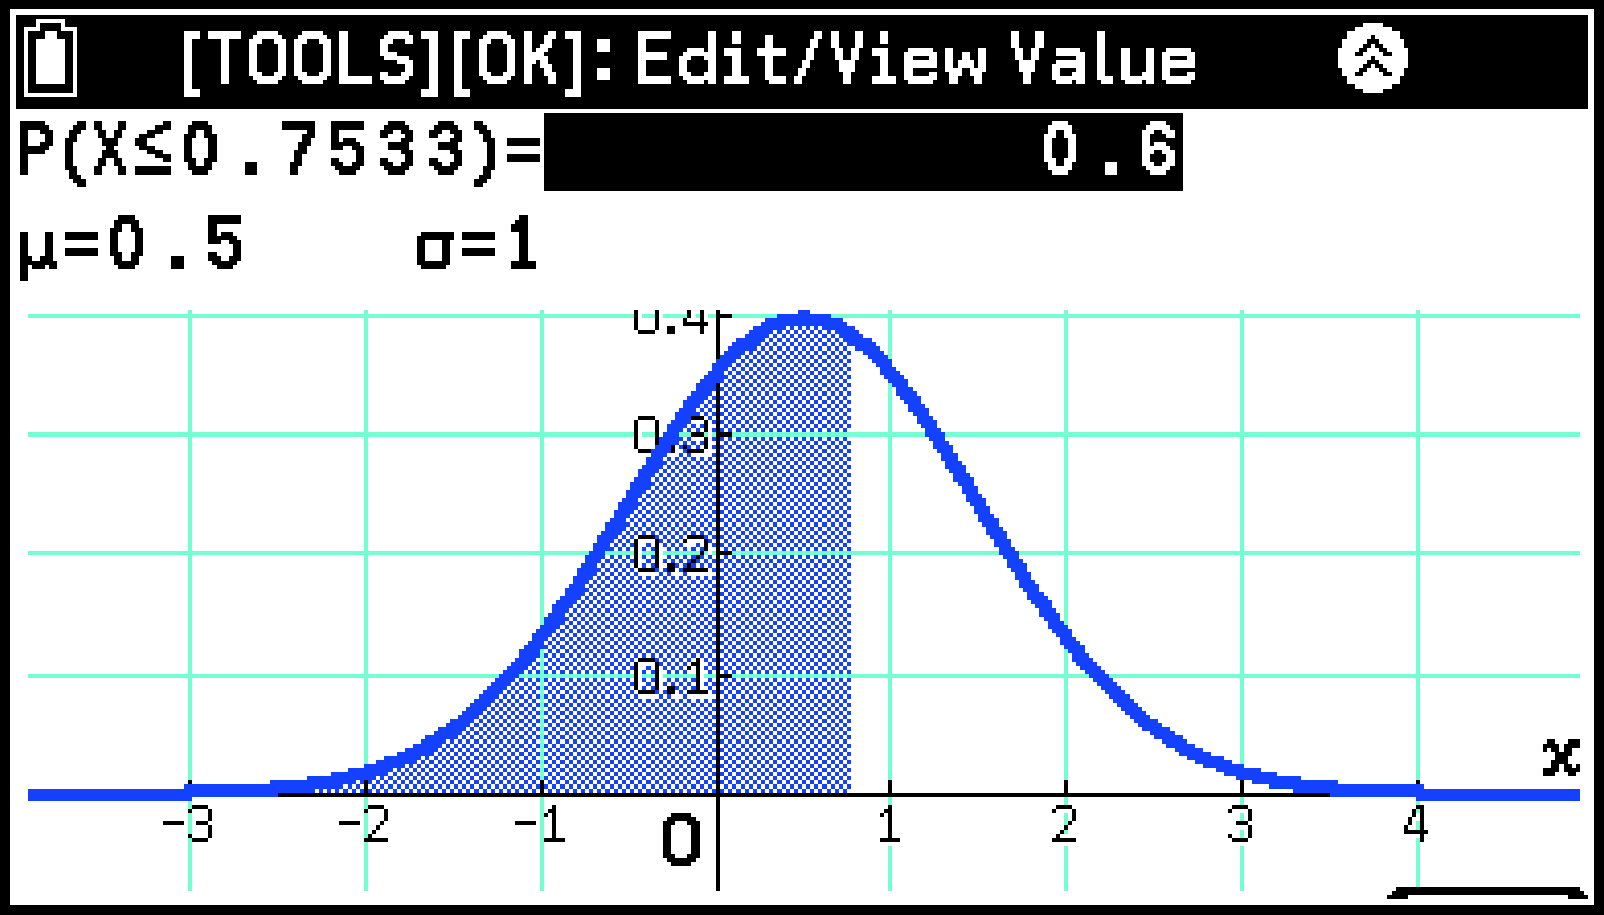
To change the probability value and calculate inverse data values (Only when [Data] > [Variable] is selected.)
Highlight the -value and then use the number keys or select T > [Edit/View Value] to change the value.
P (X ≤ ) = p
P (Lower ≤ X ≤ Upper) = p*
P (X ≥ ) = p
Normal distribution only
Note
The inverse operation cannot be performed with [Tail] > [![]() ] for discrete distribution.
] for discrete distribution.
To change the Tail setting
From the menu that appears when you select T > [Tail], select the option you want. For information about available options, see step 3 under Operation Flow.
Other Operations
|
To do this: |
Select this menu item: |
|---|---|
|
Check the value set for the display range of the graph window (Data: Only when Variable is selected.) |
T > [View Window]*1 |
|
Adjust the background image (Data: Only when Variable is selected.) |
T > [Fade I/O]*2 |
|
Save all -values of the calculation result to the specified list variable (Only when Data: List is selected.) |
T > [Save Probabilities in List] |
You can use the menu that appears when you select T > [View Window] to check setting values only. If you change the values, the changes are not reflected in the graph window.
For details, see Adjusting the Graph Window Background Image (Fade I/O).
Precision and Input Ranges
Note that in the below conditions, calculations are performed as , .
Discrete distributions, when ![]() is selected
is selected
Continuous distributions, when ![]() or
or ![]() is selected
is selected
The result of an inverse calculation of a discrete distribution is an integer. Precision is reduced if the cumulative probability you input has 10 or more digits.
The following conditions cause an error (Out of Domain).
Binomial distribution, when you input a value of 100,000 or greater for Numtrial
Binomial distribution, when you input a value for within the range of 0 < ≤ 0.00001 or 0.99999 ≤ < 1
Normal distribution, when you input a value of or greater or or less for
Normal distribution, when you input a value of or greater for σ
Poisson distribution, when you input a value of 1,000 or greater for λ
Geometric distribution, when you input a value of 0.00001 or less for , or when is within the range of 0.99999 ≤ < 1
Hypergeometric distribution, when you input a value of 201 or greater for
Hypergeometric distribution, when you input a value of 100,000 or greater for or
distribution, when you input a value of or greater for df
distribution, when you input a value of 2,000,001 or greater for :df or :df