Appendix
Using CSV Files
You can save the data stored in the list variables, matrix variables or the Spreadsheet app as CSV files. You can also load CSV files saved in the Storage Memory of the calculator into list or matrix variables, or into the Spreadsheet app.
Important!
Storage Memory is used as the memory area for saving and importing CSV files.
When saving and importing CSV files, take care to specify the delimiter and decimal point. For details, see Specifying the CSV File Import and Export Format (CSV Format).
Import CSV File Requirements
A CSV file that has been output from the Calculate app, Statistics app, Spreadsheet app, or a CSV file transferred from a computer to Storage Memory can be used for import. The following types of CSV files are supported for import.
A CSV file that uses the comma ( , ) or semi-colon ( ; ) as its delimiter, and the period ( . ) or comma ( , ) as its decimal point. A CSV file that uses the tab as its delimiter is not supported.
CR, LF and CRLF are supported for the line break code.
When importing a CSV file to the calculator, if the data in Line 1 of each column of the file (or Line 1 of Column 1 of the file) is a character string enclosed with double quotation marks ( " ) or single quotation marks ( ’ ), Line 1 of all of the columns of the CSV file will be ignored, and data will be input starting from Line 2.
A CSV file name can have up to eight single-byte characters.
Exporting to and Importing From a CSV File
Important!
When saving matrix variables, list variables or the Spreadsheet app data to a CSV file, some data is converted as described below.
Fraction data: Converted to calculation line format (Example: 2![]() 3
3![]() 4 → =2+3/4)
4 → =2+3/4)
and data: Converted to a decimal value (Example: → 2.236067977)
When a matrix or list variable is saved as a CSV file, the imaginary part of complex number data stored by the variable is omitted. This means only the real part is saved.
Attempting to import the following types of CSV files will result in an error.
A CSV file containing data (expression or string) that cannot be converted. In this case, an error message will appear showing the location in the CSV file (Example: row 2, column 3) where the data that cannot be converted is located.
A CSV file with more than 999 columns or 999 rows into a matrix variable.
A CSV file with more than 26 columns or 999 rows into a list variable or a spreadsheet.
In this case, an “Invalid Data Size” error will occur.
To save matrix variables to a CSV file (Calculate app)
-
Display the Calculate app’s Matrix tab.
-
Highlight the matrix variable you want to save to a CSV file and then select T > [CSV] > [Save As].
-
Use the operation below to select the save destination folder.
-
Highlight the folder you want to select and then press O. This will take you into the selected folder.
-
Highlight the folder’s name and then press O again.
-
Use the dialog that appears to input up to eight characters for the file name and then press O.
This displays a dialog you can use to select a folder to save the data.
|
To select this folder: |
Perform this operation: |
|---|---|
|
Root directory |
Highlight ROOT and then press O. |
|
Other folders |
|
To import a CSV file into a matrix variable (Calculate app)
-
Display the Calculate app’s Matrix tab.
-
Highlight the matrix variable into which you want to import the CSV file.
-
Select T > [CSV] > [Load].
-
On the dialog that appears, highlight the CSV file you want to import and then press O.
If the matrix variable you highlighted already contains data, the next step will cause the existing data to be overwritten.
To save a list variable to a CSV file (Statistics app)
The operation below saves the contents of the currently open List Files (all list variables on List Editor) as a CSV file.
-
Display the Statistics app’s List Editor tab.
-
Select T > [CSV] > [Save As].
-
Use the operation below to select the save destination folder.
-
Highlight the folder you want to select and then press O. This will take you into the selected folder.
-
Highlight the folder’s name and then press O again.
-
Use the dialog that appears to input up to eight characters for the file name and then press O.
This displays a dialog you can use to select a folder to save the data.
|
To select this folder: |
Perform this operation: |
|---|---|
|
Root directory |
Highlight ROOT and then press O. |
|
Other folders |
|
To import a CSV file into List Editor (Statistics app)
-
Display the Statistics app’s List Editor tab.
-
Depending on the method you want to use to import the CSV file, perform one of the operations below.
-
On the dialog that appears, highlight the CSV file you want to import and then press O.
|
To do this: |
Select this menu item: |
|---|---|
|
Start importing from a specific column |
T > [CSV] > [Load] > [List] |
|
Overwrite all current List Editor contents |
T > [CSV] > [Load] > [File] |
If you chose [List] in step 2 above, import starts from the column that contains the cell where the cursor is currently located. The columns on List Editor are overwritten by the number of columns contained in the CSV file.
To save a spreadsheet to a CSV file (Spreadsheet app)
-
Display the Spreadsheet app’s Spreadsheet tab.
-
If required, select T > [Recalculate] to recalculate the spreadsheet contents.
-
Select T > [CSV] > [Save As].
Note that recalculation is not performed automatically when you save spreadsheet contents to a CSV file. Be sure to perform recalculation if the spreadsheet contains a formula, which starts with an equals symbol (=).
Formulas are not saved to the CSV file. Only calculation results are saved.
All ERROR cell data on the spreadsheet is saved as blank data.
This displays a dialog you can use to select a folder to save the data.
For the remainder of this procedure, perform the steps from step 3 under To save matrix variables to a CSV file (Calculate app).
To import a CSV file into a spreadsheet (Spreadsheet app)
-
Display the Spreadsheet app’s Spreadsheet tab.
-
Select T > [CSV] > [Load].
-
On the dialog that appears, highlight the CSV file you want to import and then press O.
This imports the contents of the CSV file you specified to the spreadsheet.
Calculation Priority Sequence
The calculator performs calculations according to a calculation priority sequence.
Basically, calculations are performed from left to right.
Expressions within parentheses have the highest priority.
The following shows the priority sequence for each individual command.
|
1 |
Parenthetical expressions |
|
2 |
Type A functions Functions that take arguments within parentheses: sin(), log(), d/dx(), etc. Prefixes for list, matrix, and vector variables: List, Mat, Vct Composite functions: , r, Xt, Yt, X (: 1-20) |
|
3 |
Type B functions (functions that come after the input value) , , , , , , engineering symbols |
|
4 |
powers ( |
|
5 |
Fractions |
|
6 |
Implied multiplication format in front of , memory name, or variable name: 2, 5A, etc. |
|
7 |
Negative sign ((-)) Type C functions (functions that come before the input value) List calculation function (Δlist) Base Prefix (d, h, b, o) |
|
8 |
Implied multiplication format in front of Type A functions, Type C functions, and parenthesis: , A log(2), etc. |
|
9 |
Permutation (P), combination (C), complex number polar coordinate symbol (∠) |
|
10 |
Metric conversion commands |
|
11 |
× , ÷, Int÷, Rmdr |
|
12 |
+, – |
|
13 |
Relational operators: =, ≠, >, <, ≥, ≤ |
|
14 |
And (logical operator), and (bitwise operator) |
|
15 |
Or, Xor (logical operator), or, xor, xnor (bitwise operator) |
Note
When functions with the same priority are used in series, execution is performed from right to left.
Compound functions are executed from right to left.
If a calculation contains a negative value, you may need to enclose the negative value in parentheses. If you want to square the value -2, for example, you need to input: . This is because is a function preceded by a value (Priority 3, above), whose priority is greater than the negative sign, which is a prefix symbol (Priority 7).
Example:
s-(M)2iE
(s-(M)2)iE
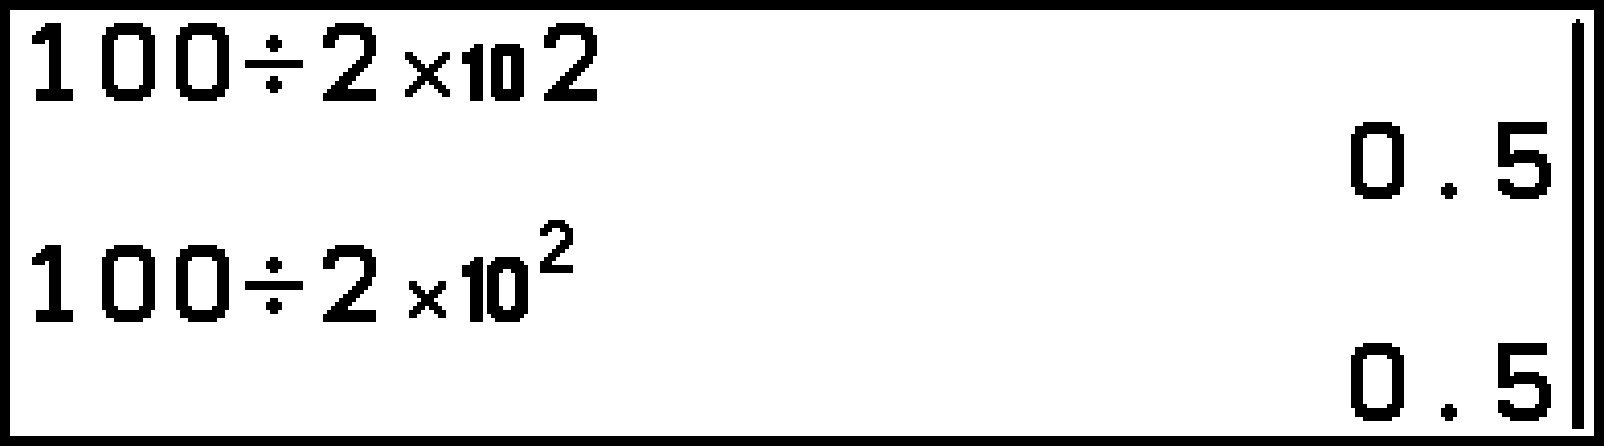
The data that is input when you press the k key depends on the current S > [![]() Key] setting. Calculation priority depends on the syntax of the formula that is input. Because of this, changing the above setting may affect calculation results even if the formula is input using identical key operations.
Key] setting. Calculation priority depends on the syntax of the formula that is input. Because of this, changing the above setting may affect calculation results even if the formula is input using identical key operations.
Example: 100*2k2E
S > [![]() Key] > [
Key] > [![]() (Power)]:
(Power)]:
calculation priority is higher, so the result is .

S > [![]() Key] > [
Key] > [![]() (Sci Notation)] or [
(Sci Notation)] or [![]() (Sci Notation)]:
(Sci Notation)]:
calculation priority is higher, so the result is .
Error Message Table
General calculation errors
|
When you see this message: |
It means this: |
So you need to do this: |
|---|---|---|
|
Syntax ERROR |
There is a problem with the format of the calculation you are performing. |
Make necessary corrections. |
|
Math ERROR |
Calculation result that exceeds the calculation range. Intermediate or final calculation result is outside the allowable calculation range. Mathematical error (division by zero, etc.) |
Check input values and make corrections to ensure that values are within allowable limits. |
|
Stack ERROR |
The calculation you are performing has caused the capacity of the numeric stack or the command stack to be exceeded. |
Simplify the calculation expression so it does not exceed the capacity of the stack. |
|
The calculation you are performing has caused the capacity of the matrix or vector stack to be exceeded. |
Try splitting the calculation into two or more parts. |
|
|
Input value must be integer |
Attempting to input a non-integer value in a location that requires integer input. |
Input an integer value. |
|
Input value must be a matrix |
Attempting to input a non-matrix value in a location that requires matrix input. |
Input a matrix value. |
|
Input value must be a matrix or vector |
Attempt to input a non-matrix or non-vector value in a location where a matrix or vector should be input. |
Input a matrix or vector. |
|
Input value must be a list |
Attempting to input a non-list value in a location that requires list input. |
Input a list value. |
|
Input value must be a real number |
Attempting to input a non-real number value in a location that requires real number input. |
Input a real number value. |
|
Invalid Polar Form |
Attempting to input an imaginary number for polar form (∠) or . |
Check the polar form. |
|
Wrong argument size relationship. |
The size relationship between two arguments is opposite from what it should be. Example: 3C10 |
Change the values so the size relationship required by the syntax is maintained. |
|
Non-Real ERROR |
Calculation that produces a complex number when S > [Complex Mode] > [Real] is specified, even though the argument is a real number. |
Change the [Complex Mode] setting to something other than [Real]. |
|
Can’t Simplify |
Fraction simplification was attempted using the ISimp function, but simplification could not be performed using the specified divisor. Example: Specifying a divisor of 3 to simplify the fraction 4/8. |
Specify a different divisor or execute ISimp without specifying any divisor. |
|
Can’t Solve! Adjust initial value or bounds. Then try again. |
A Solve calculation could not obtain a solution within the specified initial default estimated value. |
Change the specified initial default estimated value or correct the input expression. |
|
Time Out |
A Solve calculation was unable to satisfy convergence conditions. |
If you are performing a Solve calculation, try changing the initial default estimated value closer to the expected solution. |
|
Conversion ERROR |
Attempting to use the unit conversion command to convert between two units in different categories. Executing a conversion calculation using the same command twice in a conversion expression. |
In a conversion expression, specify two different commands that are in the same category. |
|
Invalid Type |
An illegal data type is specified. |
Specify valid data. |
List, matrix, and vector calculation errors
|
When you see this message: |
It means this: |
So you need to do this: |
|---|---|---|
|
Invalid list, matrix or vector |
Incorrect use of a list, matrix, or vector. |
Press b to display the location of an error and make necessary corrections. |
|
Dimension ERROR |
Illegal dimension used during matrix, vector, or list calculations. |
Check the matrix, vector, or list dimension. |
|
Complex Number In List |
List containing complex number used in a calculation or operation for which complex number data is invalid. |
Change all elements in the list to real numbers. |
|
Complex Number In Matrix |
Matrix containing complex number used in a calculation or operation for which complex number data is invalid. |
Change all elements in the matrix to real numbers. |
|
Complex Number In Matrix or Vector |
Matrix or vector containing complex number used in a calculation or operation for which complex number data is invalid. |
Change all elements in the matrix or vector to real numbers. |
|
Improper Number of Elements |
You attempted to create a list, matrix, or vector whose number of elements exceeds the maximum limit. |
A list cannot have more than 999 elements, and a matrix cannot exceed 999 rows × 999 columns. For vector elements, specify within 1 row × 999 columns or 999 rows × 1 column. |
Equation app errors
|
When you see this message: |
It means this: |
So you need to do this: |
|---|---|---|
|
Infinitely Many Solutions |
An infinite number of solutions for simultaneous linear equations. |
– |
|
No Solution |
No solution for simultaneous linear equations. |
– |
|
No Variable |
No variable within a Solver equation. |
Input an equation that includes a variable. |
Graph&Table, Recursion, Dyna Graph, Conic Graphs app errors
|
When you see this message: |
It means this: |
So you need to do this: |
|---|---|---|
|
Range ERROR |
View Window range settings exceeded when a graph is drawn. |
Redraw using the proper View Window settings. |
|
Circular ERROR |
The two recursion formulas that were input cross-reference each other. |
Edit the recursion formulas to resolve the cross-referencing. For details, see the Note under To input or edit a recursion formula. |
|
No Variable |
No variable specified within a function being used for dynamic graphing in the Dyna Graph app. |
Specify a variable for the graph function. |
|
No item is selected |
Attempting to draw a graph or create a table while there is no data selected. |
Select data and try again. |
|
Equation does not have a parameter. |
You attempted to execute a Modify function operation while no expression that contains a variable is selected. |
Select at least one and only one expression that contains a variable. |
|
Condition ERROR |
You attempted to execute a Modify operation while multiple expressions containing variables are selected. |
|
|
Expression in use |
Attempting to copy the expression of a graph while Modify is running to an area where an expression that is being used for graphing is located. |
Select a different area and try again. |
|
Too Many Variables |
Attempting to execute the Modify function using an expression with more than five variables. |
Change the expression so it contains no more than five variables. |
|
Invalid Graph Type |
You selected one of the mathematical function expressions ((a) through (d)) in the Graph&Table app and tried to execute T > [Modify]. You selected one of the mathematical function expressions ((a) through (d)) in the Graph&Table app and attempted to create a number table.
|
Choose another type of function and try again. |
|
Too Many Sectors |
You attempted to perform a calculation using [] > [Root], [] > [Intersection], or [] > [Mixed] with graph analysis (Graph Solve), but there are 21 or more roots (or intersections) within the specified range. |
Specify a range that is narrower and try again. |
Statistics app errors
|
When you see this message: |
It means this: |
So you need to do this: |
|---|---|---|
|
Condition ERROR |
You are attempting to display multiple statistical graphs of different types. |
|
|
Data is in use |
Use the dialog that appears after you select T > [Save Residuals in List] or T > [Save Result in List] to make the list you are currently using the save destination. |
Specify the number of an empty list. |
Spreadsheet app errors
|
When you see this message: |
It means this: |
So you need to do this: |
|---|---|---|
|
Range ERROR |
The spreadsheet cell range was exceeded by paste, recall, or other cell operation. |
Repeat the procedure taking care that the cell range is not exceeded. |
|
Circular ERROR |
There is a circular reference (such as “=A1” in cell A1) in the spreadsheet. |
Change cell contents to remove the circular references. |
Memory app errors
|
When you see this message: |
It means this: |
So you need to do this: |
|---|---|---|
|
Memory ERROR |
Calculation or memory storage operation exceeds remaining memory capacity. |
Simplify the data you are trying to store to keep it within the available memory capacity. Delete no longer needed data to make room for the new data. |
|
Folder has over 200 files. Some will be skipped. |
The number of files in the storage memory folder you are trying to open in the Memory app exceeds 200. |
Use your computer to distribute the files among multiple folders so no folder in storage memory contains more than 200 files. |
|
Sub-folders in this folder cannot be displayed. |
In the Memory app, a level 3 nested storage memory folder is displayed, and it contains a level 4 nested folder. (The level 4 folder will be displayed, but it cannot be opened.) |
Use your computer to store all files you want to access in the top three folder nesting levels. |
|
Too Much Data |
The number of data items is too large. |
Delete unneeded data. |
|
Invalid Name |
The file name you input includes invalid characters. |
Use the correct characters to input a valid file name. |
|
Invalid Type |
An illegal data type is specified. |
Specify valid data. |
|
Storage Memory Full |
The storage memory is full. |
Delete unneeded data. |
|
Data ERROR |
A data error occurred. |
Check to make sure you are writing correct type of data and try again. |
|
Memory Full |
You attempted to load a g4m file into the main memory, but there is not enough space available. |
Delete no longer needed data to make room for loading g4m files. |
|
File System ERROR |
After establishing a connection between the calculator and a computer, the calculator memory has been accidentally formatted by an operation from the computer. This message appears when the USB cable is disconnected following formatting. |
Formatting deletes all data remaining in calculator memory. See If you accidentally format calculator memory for what you need to do. |
|
The memory area has been fatally corrupted due an electronic component in the device reaching the end of its service life, or some other reason. |
From the menu that appears along with the message, select [Initialize All] and then press O. If this does not resolve the problem, contact your retailer or your nearest CASIO service center. |
If you accidentally format calculator memory
If the calculator displays the File System ERROR message because its memory was accidentally formatted, you need to initialize the calculator.
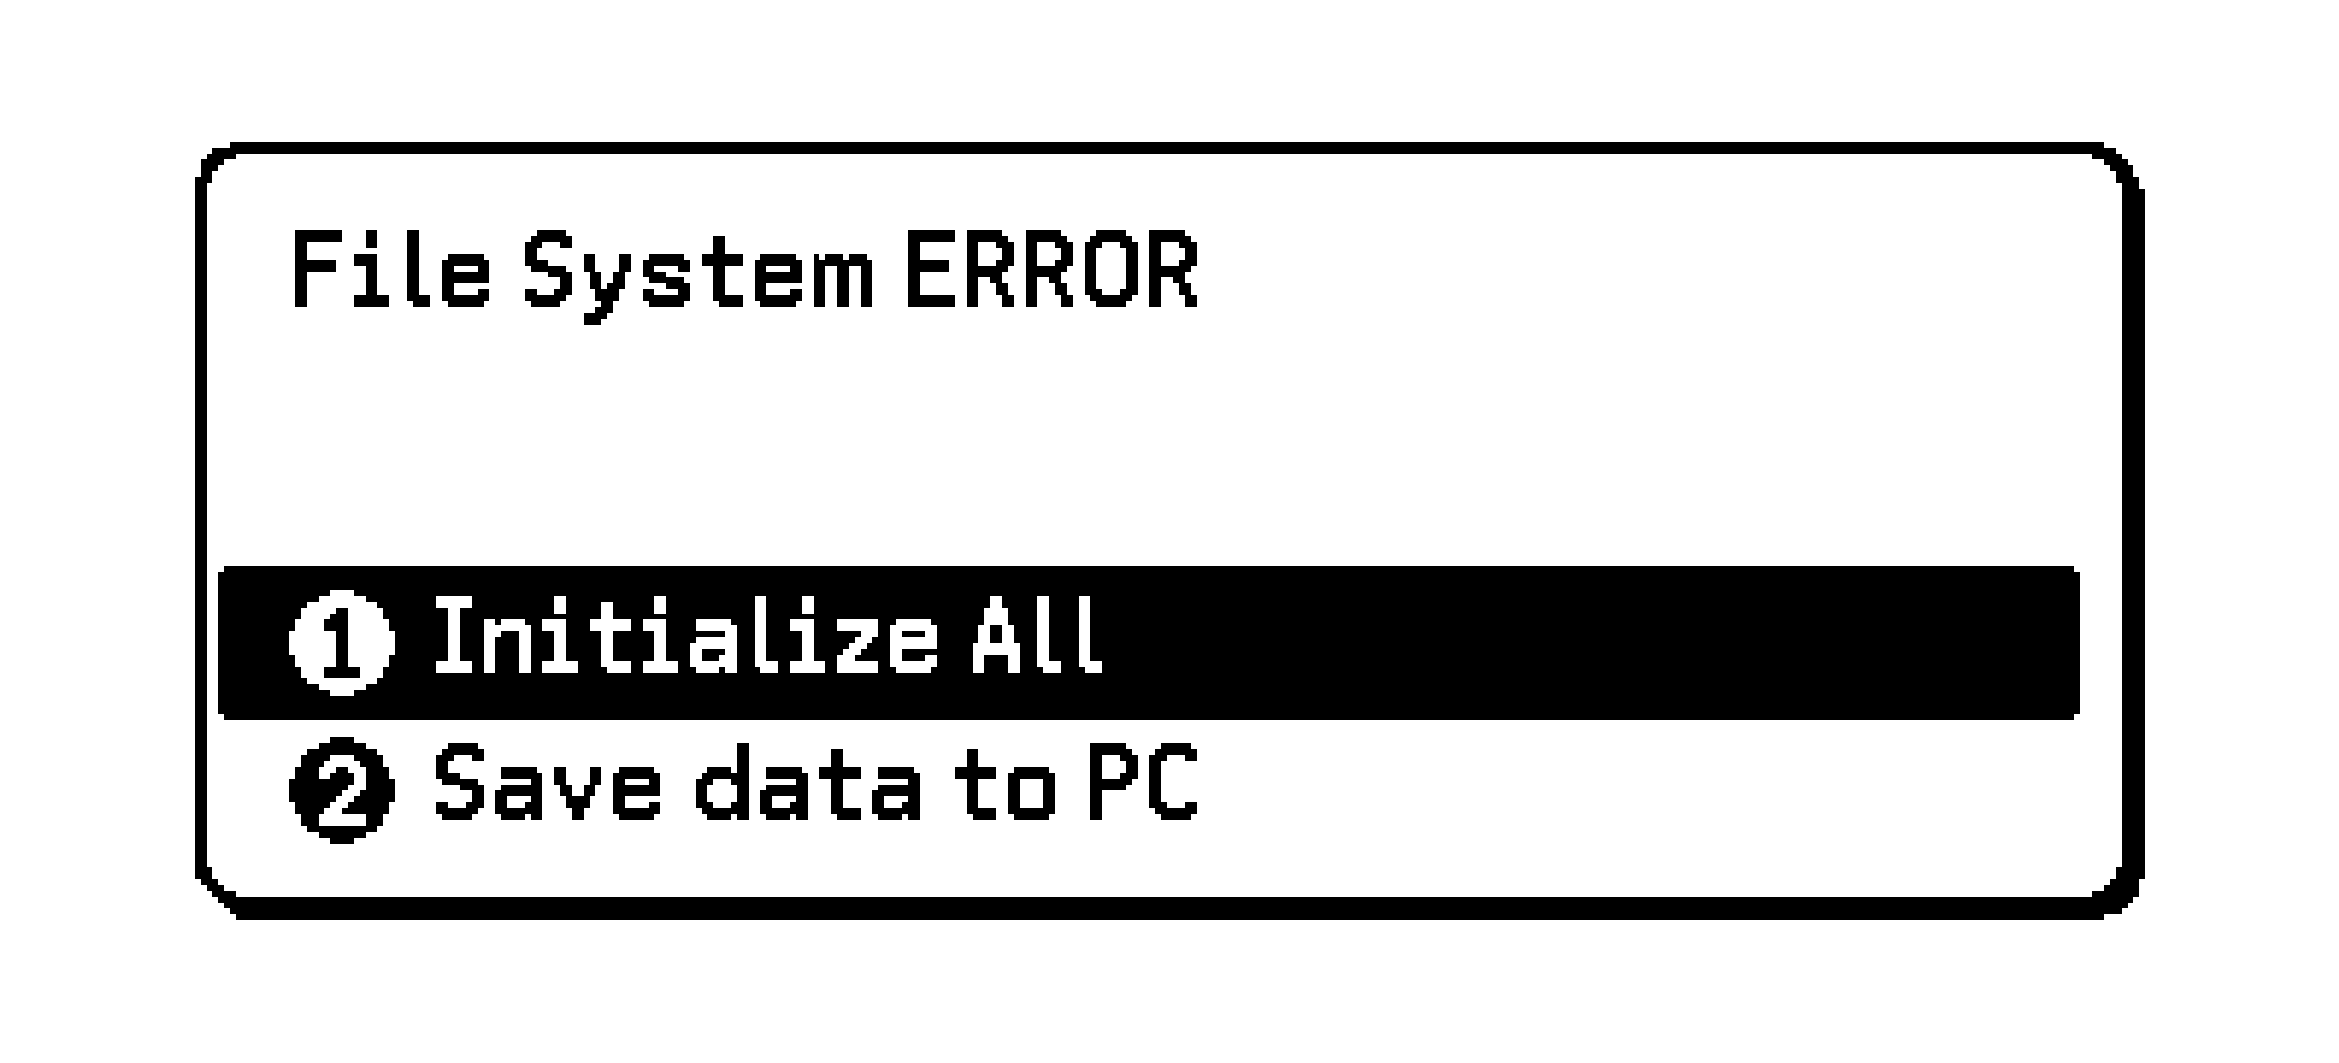
Perform one of the operations shown in the table below.
|
To do this: |
Perform this operation: |
|---|---|
|
If you transferred data to the calculator after executing the formatting operation, save the transferred data to your computer before initializing the calculator. |
This causes the calculator to display the File System ERROR message again. |
|
Initialize the calculator, which discards all data remaining in its memory. |
Highlight [Initialize All] and then press O. |
Data communication errors
|
When you see this message: |
It means this: |
So you need to do this: |
|---|---|---|
|
CSV error in row [A] or column [B] |
The imported CSV file included data that cannot be converted. |
Use your computer to check the row A, column B data in the file and change it to data that can be converted. |
|
USB Connect ERROR |
USB cable connection broken during data communication. |
Use the USB cable to correctly connect the calculator and computer. |
3D Graph app errors
|
When you see this message: |
It means this: |
So you need to do this: |
|---|---|---|
|
No item is selected |
Attempting to draw a graph while there is no data selected. |
Select data and try again. |
|
Intersection requires two or more objects. (fx-CG100 only) |
You tried to determine a point of intersection without first using the Line template or Plane template to draw multiple 3D graphs. |
Use the Line template or Plane template to draw multiple 3D graphs and try again. |
|
Relationship requires two or more objects. (fx-CG100 only) |
You tried to determine relationship without first using the Line template or Plane template to draw multiple 3D graphs. |
Use the Line template or Plane template to draw multiple 3D graphs and try again. |
Geometry app errors
|
When you see this message: |
It means this: |
So you need to do this: |
|---|---|---|
|
First select a segment. |
You are attempting to construct a perpendicular bisector without first selecting a line segment. |
Select the required object(s) and then try again. |
|
First select a line and point. |
You are attempting to construct a perpendicular or parallel without first selecting a line segment and point. |
|
|
First select 2 points or a segment. |
You are trying to construct a midpoint without first selecting two points or a line segment. |
|
|
First select the applicable figure. |
You are trying to construct a point of intersection without first selecting two lines. You are trying to execute T > [Animate] > [Add Animation] or [Replace Animation] without first selecting the required object. You are trying to execute T > [Animate] > [Add Table] without first selecting the required object. |
|
|
First select 2 segments. |
You are trying to construct an angle bisector without first selecting two line segments. |
|
|
Range ERROR |
View Window range settings exceeded. |
Press F (Zoom to Fit) or select T > [View] > [View Window] > [Pre-set Windows] > [Initialize]. |
|
You are trying to specify t0 = t1 on the Edit Animations screen. |
Specify different values for t0 and t1. |
|
|
Too Many Objects! |
Work memory became almost full. |
Delete objects you no longer need or open a new file. |
|
Too Many Objects! Work memory cleared. |
Work memory became full. |
Delete objects you no longer need or open a new file. |
|
Invalid Measurement |
You are attempting to use the Expression command (T > [Option] > [Expression]) to input an expression that contains a measurement that does not exist. |
Check to make sure that the expression you are inputting contains only measurements that are currently on the screen. |
|
Too Many Animations |
You are trying to add more than 10 animations. |
Use the Edit Animations screen to delete animations you no longer need, or create a new file and add new animations. |
|
First select point(s). |
You are trying to execute T > [Animate] > [Trace] without first selecting a point. |
Select one or more points and try again. |
|
Too Many Trace Points |
You are trying to specify more than 10 trace points. |
Select up to 10 points and try again. |
|
Too Many Columns |
You are trying to add more than 26 columns to an animation table. |
Delete columns from the animation table that you do not need and try again. |
|
First configure animation settings. |
You are trying to run an animation without first configuring its settings. You are trying to execute T > [Animate] > [Add Table] without first configuring animation settings. |
Configure animation settings and try again. |
|
Cannot Add Animation |
The point you selected for an Add Animation or Replace Animation command operation cannot be used in an animation because it is locked, etc. The point you selected for an Add Animation or Replace Animation command operation cannot be used in an animation because it is already being used in the animation you are configuring or in another animation. |
Select a point to which animation can be added and try again. |
|
Select the applicable measurement icon. |
You are trying to execute T > [Animate] > [Add Table] without first selecting the appropriate measurement icon. |
Select the icon of a measurement that can be added to an animation table. |
|
First configure animation settings and create a table. |
You tried to execute T > [Animate] > [Display Table] without generating an animation table. |
Generate an animation table first. |
|
Create at least one figure with a fill color. |
You are attempting to execute a surface area calculation (T > [Option] > [Area Calc]) when there is no figure on the screen with a fill color. |
Draw a figure with a fill color and try again. |
Settings errors
|
When you see this message: |
It means this: |
So you need to do this: |
|---|---|---|
|
Out of Domain |
Attempting to input a value that is outside the allowable input range. |
Input a value that is within the allowable range. |
|
Invalid Setting |
Input of an improper View Window value. |
Change the View Window value so it is within range. |
|
Input of an improper value on the range screen and use of that value for execution. |
Input a proper range value. |
|
|
Attempting to create a table with a Step value of 0. |
Specify a Step value other than 0. |
|
|
Attempting to input illegal View Window setting combinations. Example: Minimum = 10, Maximum = 10 |
Enter values that have the proper relationship with each other. |
|
|
Attempting to create a table in the Recursion app when the Start value is greater than or equal to the End value. |
Change the value so the Start value is less than the End value. |
|
|
Internal calculation generated a mathematical error (division by zero, etc.) when executing a function calculation or a calculation in the Statistics or Financial app. |
Since the calculation contains one or more values that cannot be calculated, input different values and try again. |
|
|
Improper values were input in the 3D Graph app for a template coefficient. |
Input coefficient values that can define the 3D graph. |
|
|
Out of Range |
Calculation result that exceeds the calculator display range. |
Change the calculation formula. |
Other errors
|
When you see this message: |
It means this: |
So you need to do this: |
|---|---|---|
|
No Data |
The specified data does not exist. (Occurs when a list or variable that does not contain data is referenced.) |
Change the data specification. |
|
Not Enough Elements |
The list you specified for a calculation does not contain the number of elements required to perform the calculation. |
Check the number of elements required by the calculation you are trying to perform and adjust the number of list elements accordingly. |
|
You attempted to execute a statistical calculation using a list whose elements are all zero for the Frequency data. |
For Frequency data, use a list whose elements contain values greater than zero. |
Calculation Ranges, Number of Digits, and Precision
Calculation Range and Precision
|
Calculation Range |
±1 × to ±9.999999999 × or 0 |
|
Number of Digits for Internal Calculation |
15 digits |
|
Precision |
In general, ±1 at the 10th digit for a single calculation. Precision for exponential display is ±1 at the least significant digit. Errors are cumulative in the case of consecutive calculations. |
Function Calculation Input Ranges and Precision
|
Functions |
Input Range |
|
|---|---|---|
|
sin |
Degree |
|| < 9 × |
|
Radian |
|| < 5 × |
|
|
Gradian |
|| < 1 × |
|
|
tan |
Degree |
Same as sin, except when || ≠ 90(2−1) |
|
Radian |
Same as sin, except when || ≠ /2(2−1) |
|
|
Gradian |
Same as sin, except when || ≠ 100(2−1) |
|
|
sin |
|| ≤ 1 |
|
|
tan |
|| < 1 × |
|
|
sinh |
|| ≤ 230.9516564 |
|
|
tanh |
|| < 1 × |
|
|
sinh |
|| < 1 × |
|
|
cosh |
1 ≤ < 1 × |
|
|
tanh |
|| < 1 |
|
|
log * |
1 × ≤ < 1 × |
|
|
* |
-1 × < < 100 |
|
|
* |
-1 × < ≤ 230.2585092 |
|
|
* |
0 ≤ < 1 × |
|
|
* |
|| < 1 × |
|
|
* |
|| < 1 × ; ≠ 0 |
|
|
0 ≤ ≤ 69 ( is an integer) |
||
|
P |
0 ≤ ≤ , < 1 × (, are integers) 1 ≤ {!/(−)!} < 1 × |
|
|
C |
0 ≤ ≤ , < 1 × (, are integers) 1 ≤ !/! < 1 × or 1 ≤ !/(−)! < 1 × |
|
|
Pol(,) |
< 1 × |
|
|
Rec(,) |
|| < 1 × : Same as , , |
|
|
||, , < 1 × ; 0 ≤ , |
||
|
|| < 1 × Sexagesimal display: || < 1 × |
||
|
* |
> 0: -1 × < log < 100 = 0: > 0 < 0: = , (, are integers) However: -1 × < log || < 100 |
|
|
* |
> 0: ≠ 0, -1 × < log < 100 = 0: > 0 < 0: = 2+1, ( ≠ 0; , are integers) However: -1 × < log || < 100 |
|
|
Total of integer, numerator, and denominator must be 10 digits or less (including separator symbol). |
||
|
GCD(,) |
||, || < 1 × (, are integers) |
|
|
LCM(,) |
0 ≤ , < 1 × (, are integers) |
|
Complex numbers can be used as arguments.
Precision is basically the same as that described under Calculation Range and Precision.
, , , P, C type functions require consecutive internal calculation, which can cause accumulation of errors that occur with each calculation.
Error is cumulative and tends to be large in the vicinity of a function’s singular point and inflection point.
MicroPython license information
The MIT License (MIT)
Copyright (c) 2013-2017 Damien P. George, and others
Permission is hereby granted, free of charge, to any person obtaining a copy of this software and associated documentation files (the “Software”, to deal in the Software without restriction, including without limitation the rights to use, copy, modify, merge, publish, distribute, sublicense, and/or sell copies of the Software, and to permit persons to whom the Software is furnished to do so, subject to the following conditions:
The above copyright notice and this permission notice shall be included in all copies or substantial portions of the Software.
THE SOFTWARE IS PROVIDED “AS IS”, WITHOUT WARRANTY OF ANY KIND, EXPRESS OR IMPLIED, INCLUDING BUT NOT LIMITED TO THE WARRANTIES OF MERCHANTABILITY, FITNESS FOR A PARTICULAR PURPOSE AND NONINFRINGEMENT.
IN NO EVENT SHALL THE AUTHORS OR COPYRIGHT HOLDERS BE LIABLE FOR ANY CLAIM, DAMAGES OR OTHER LIABILITY, WHETHER IN AN ACTION OF CONTRACT, TORT OR OTHERWISE, ARISING FROM, OUT OF OR IN CONNECTION WITH THE SOFTWARE OR THE USE OR OTHER DEALINGS IN THE SOFTWARE.