Dyna Graph App
You can use the Dyna Graph app to input a function like , which includes alpha variables as coefficients. A displayed graph is continuously re-drawn as the value of a specific coefficient of its function is varied within a specific range. A Dynamic Graph makes it possible to observe the effect of coefficient values on the form and position of a graph.
Operation Flow
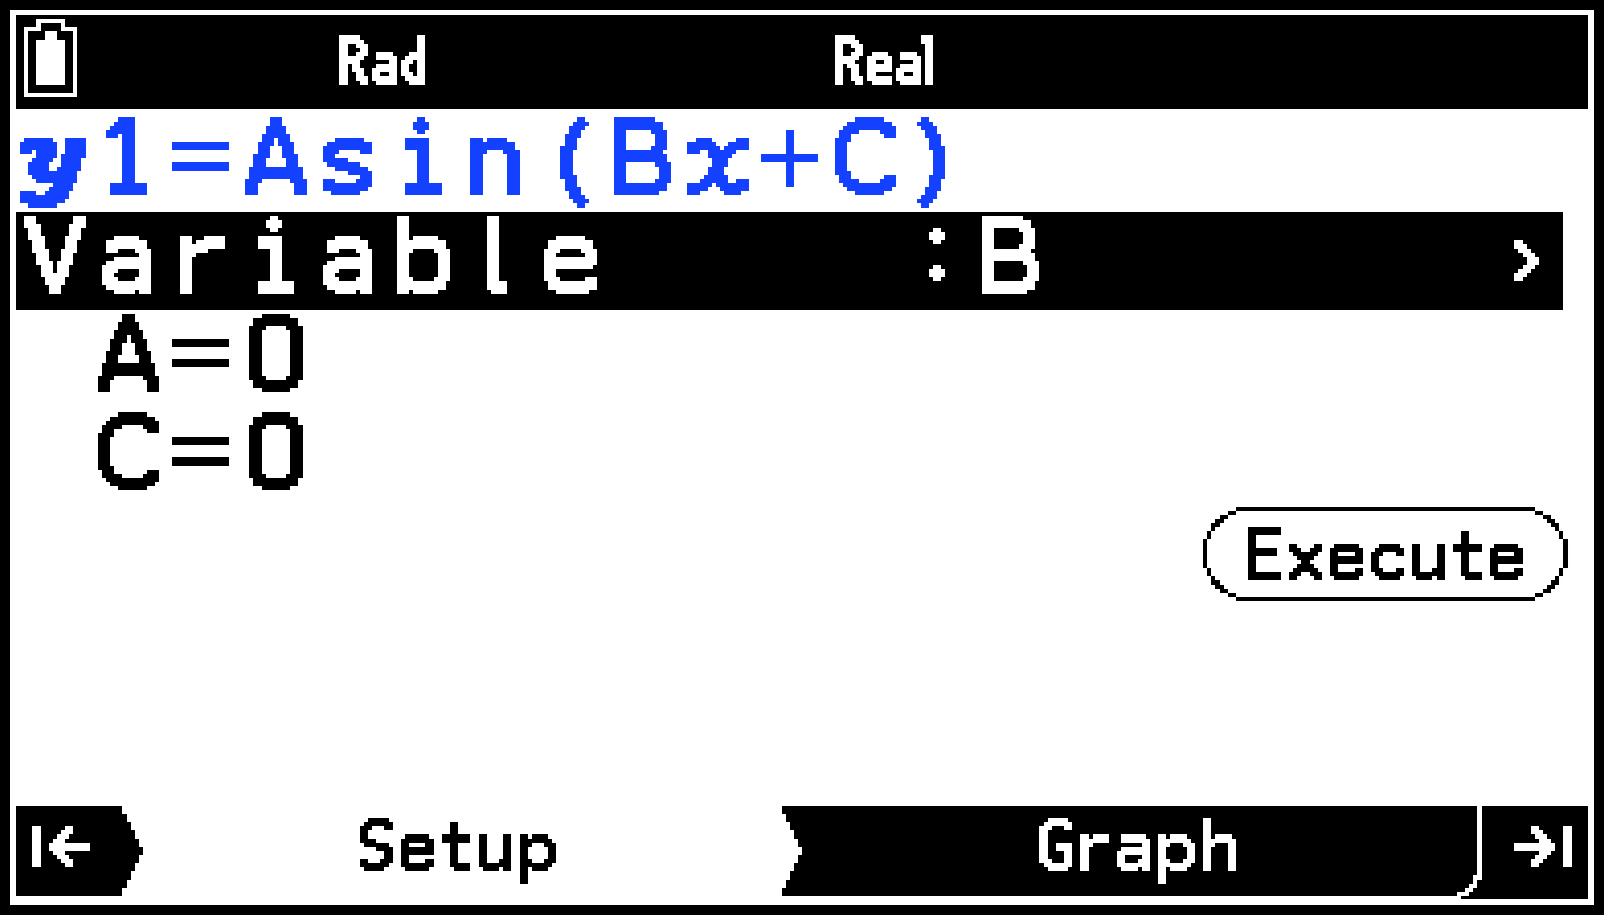
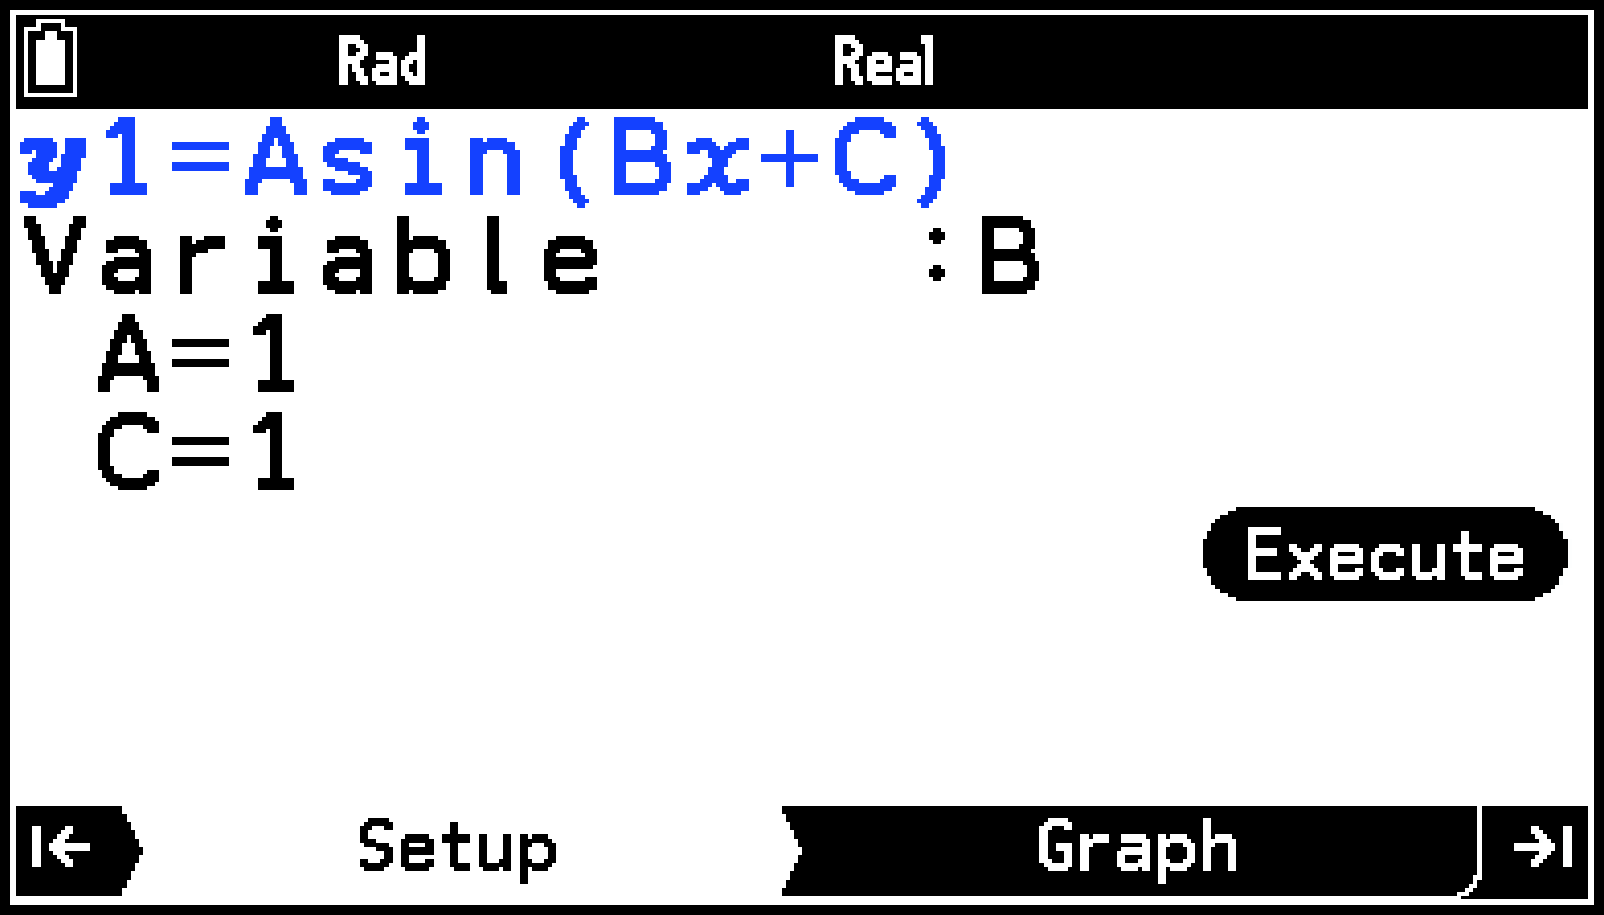
Example: To select the Dyna Graph app’s Asin built-in function and input it. Observe the change in the graph as the value of the coefficient B of the function is varied. Specify a value of 1 for A and C.
Note
If there are already functions on the Function tab of the Graph&Table app, they will also appear on the Function tab of the Dyna Graph app of step 1 in the procedure below. Note that the Function tab shown in the example below starts out with no functions.
-
h > Dyna Graph
-
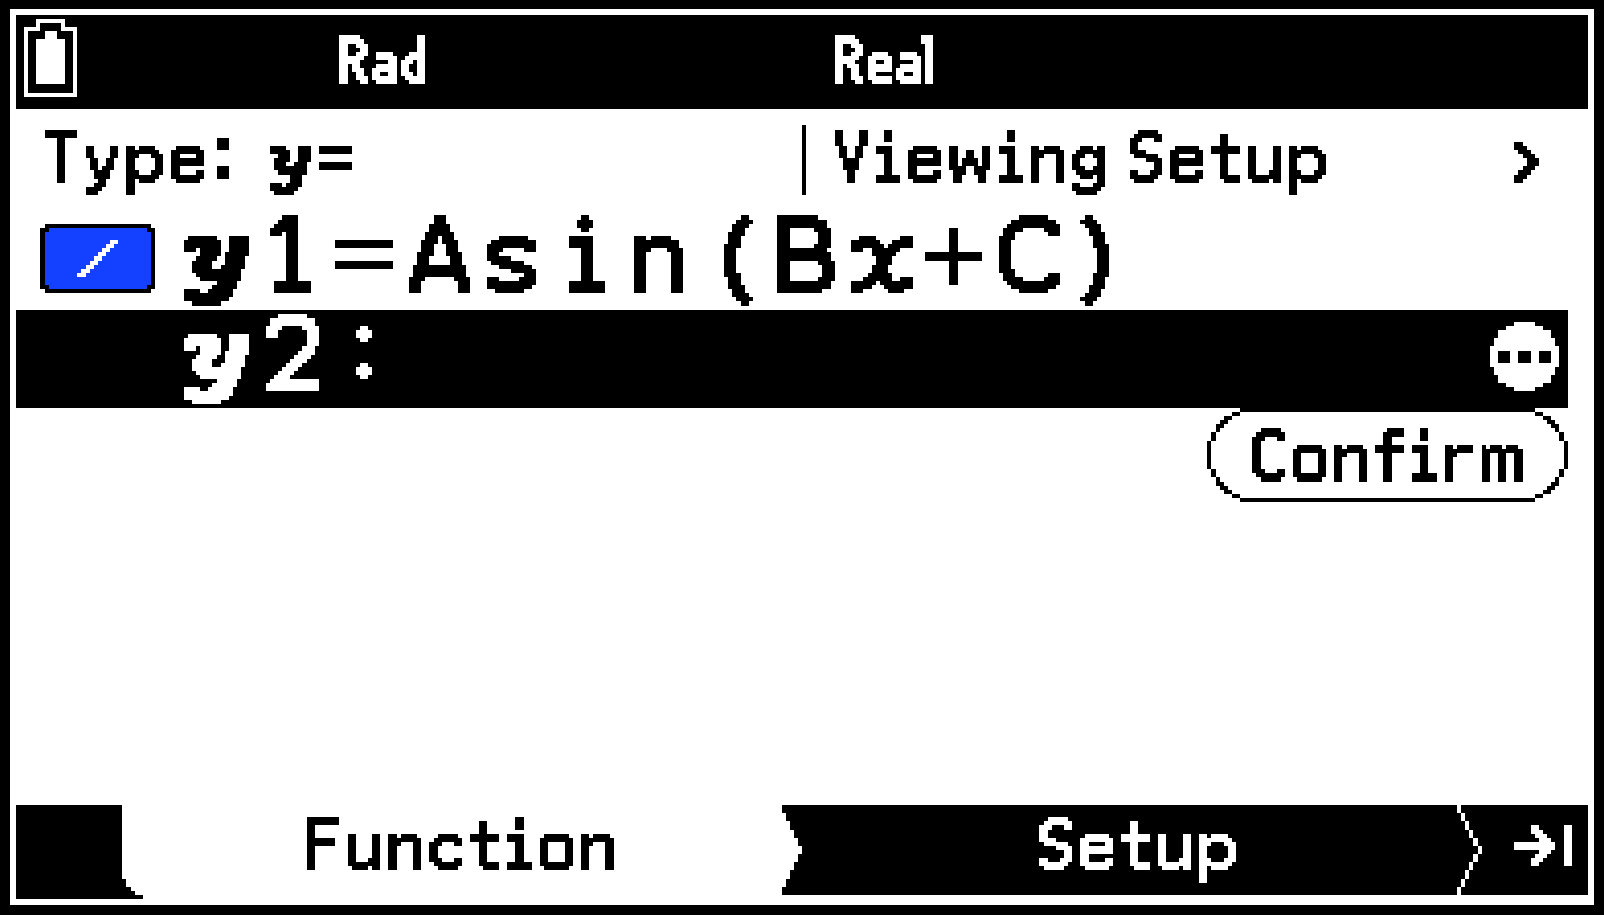
Select T > [Built-In Function] > [=Asin(B+C)].
-
Press >, or highlight
 and then press O.
 -
In the Setup tab that appears, specify the variable name of the coefficient whose value is to be varied.
-
Highlight [Variable] and then press O.
-
On the menu that appears, highlight [B] and then press O.
-
Assign values to the variables for each of the other coefficients.
-
Press > (or highlight
 and then press O.)
 -
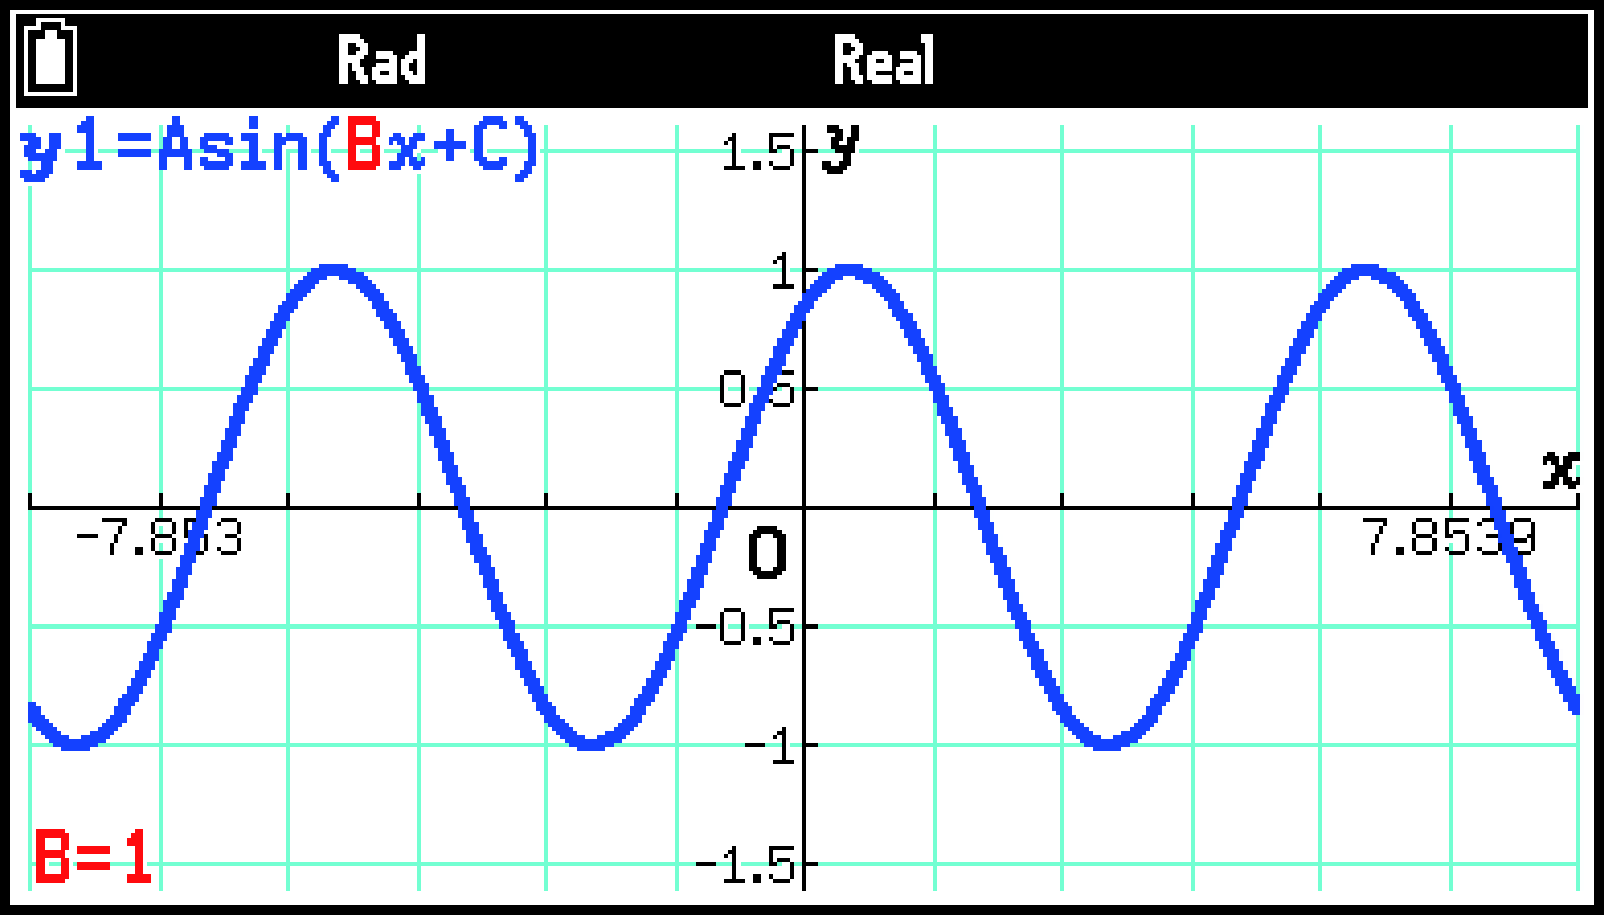
Configure View Window settings and draw the graph.
-
Select [Pre-set Windows] > [Trigonometric].
-
Highlight
 and then press O.
This displays the Function tab.
This inputs the function you select.
d1E1E
This displays the View Window menu. See Specifying the Display Range of the Graph Window (View Window) for details.
The graph is continually re-drawn as the value of coefficient B is increased or decreased within the range of 1 and 5, in increments of 1 (default setting*1).
The Setup tab reappears after 10 iterations of coefficient value increase and decrease (default setting*2).
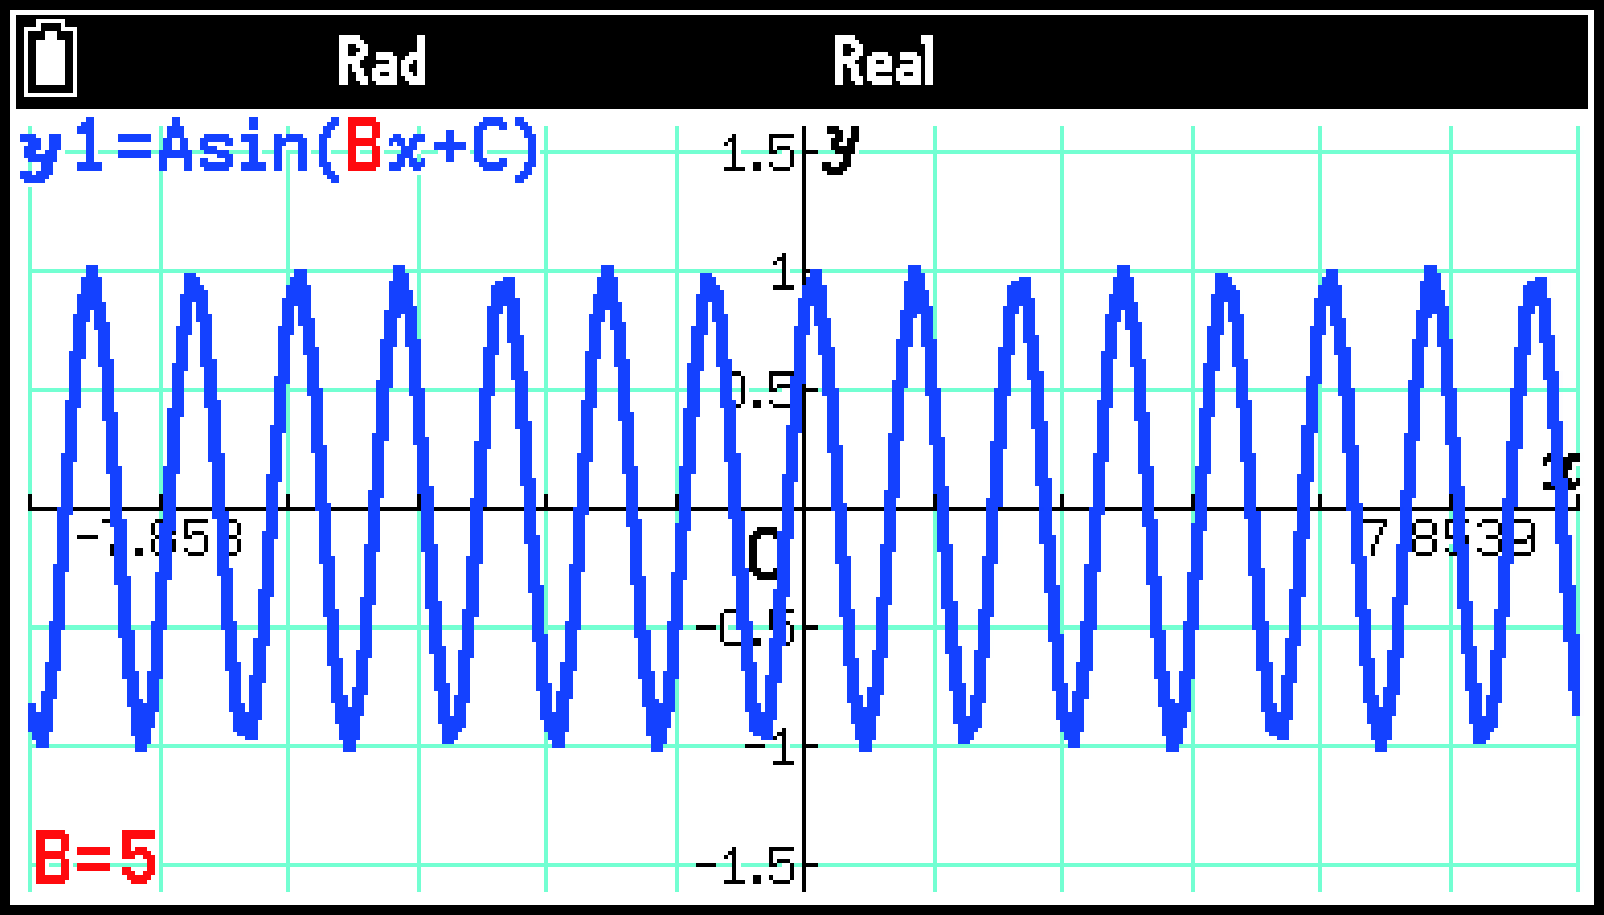
To interrupt re-drawing of the graph and return to the Setup tab, press a.
You can specify the start value, end value, and step value of the increase/decrease. See Using the Setup Tab for details.
You can specify the speed at which the coefficient values are automatically varied during the graph drawing operation. See Using the Setup Tab for details.
Using the Function Tab
You can enter up to 20 functions on the Function tab.
Note
Functions input on the Function tab of the Dyna Graph app also appear on the Function tab of the Graph&Table app.
Inputting and Editing Functions
To select the function type and input a function manually
-
On the Function tab, highlight the first line and then press O.
-
On the Setup menu that appears, select [Type].
-
Perform the operations shown in the table below.
-
Highlight the line where you want to input a function, and then input it.
This displays the Type menu.
|
To select this function type: |
Select this menu item: |
|---|---|
|
Cartesian coordinate type ( form) |
[=] |
|
Polar coordinate type ( form) |
[r=] |
|
Parametric type ( form) |
[Param] |
The function type you choose is applied to the function you are about to input. It does not affect any function that has already been entered.
Press X to input the variables (, , ) in accordance with the function type you chose.
Example 1: To input the Cartesian coordinate type
PX(A)Xi-Pe(B)E
Example 2: To input the polar coordinate type
PX(A)vX)-Pe(B)E

Example 3: To input the parametric type
PX(A)vX)-Pe(B)E
PX(A)cX)-Pe(B)E
To select and input a built-in function
-
On the Function tab, highlight the line where you want to input.
-
Select T > [Built-In Function].
-
On the menu that appears, highlight the function you want to input and then press O.
You can input the functions listed below.
To edit or delete a function
To edit or delete an existing function, use the same operation as one in the Graph&Table app. See To edit a function and To delete a function for more information.
To change the line color for graph drawing
-
On the Function tab, highlight the function you want to change the line color of the graph.
-
Select T > [Line Color].
-
Use the list that appears to select a color.
To select a function to draw a graph
-
On the Function tab, highlight a line that contains an input function.
-
Press T.
-
Change [Select] to
 (On) to enable or to
  (Off) to disable graphing for the selected function.
 -
Press b to close the Tools menu.
This displays a Tools menu with [Select] highlighted.
The on/off setting of step 3 is indicated by the icons to the left of each line of the Function tab.
|
|
|
Note
If multiple functions are selected on the Function tab for graphing, the message “Too Many Functions” will appear on the Setup tab.
Using the Setup Tab
You can use the Setup tab to configure the settings described below, which appear when you press T.
|
To do this: |
Perform this operation: |
|---|---|
|
Specify the range of variation of the coefficient value |
|
|
Specify the speed that the coefficient value changes automatically during graph drawing |
You can select one of the speeds described below. [Stop&Go]: Coefficient value changes with each press of l or r instead of automatically.* [Slow]: Coefficient value changes at half of normal speed. [Normal]: Coefficient value changes at normal speed. [Fast]: Coefficient value changes at double normal speed. |
|
Specify the display range |
Select T > [View Window]. For details, see Specifying the Display Range of the Graph Window (View Window). |
If [Stop&Go] is selected for graph drawing, press b to return from the Graph tab to the Setup tab.
Dyna Graph App Settings Menu Items
The Settings menu items described below are specific to the Dyna Graph app.
S > [Looping]: Specifies whether graphing should end automatically or continue once started.
S > [Locus]: Specify whether or not to display the graph locus.
S > [Processing Speed]: Speeds up drawing by thinning out the graph dots.