Using Math Box
The Math Box app has the following learning support functions.
Dice Roll: Dice Roll is function that simulates dice probability.
Coin Toss: Coin Toss is a function that simulates coin toss probability.
Circle: Circle uses a Unit Circle or Half Circle graphic to display angle and trigonometric values. You can also use a Clock graphic to display angles.
Dice Roll
Dice Roll performs a simulation of one, two, or three virtual dice rolls a specified number of times. You can select either of the following screens for the result.
List screen
Relative Freq screen
Dice Roll General Operation Procedure
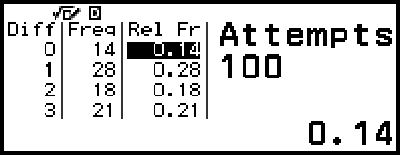
Example: To simulate 100 rolls of two dice. For this example, the Relative Freq screen is used for simulation results, showing the number of occurrences (frequencies) and relative frequencies of the numeric difference (0, 1, 2, 3, 4, 5) between the two dice each roll.
1. Press  , select the Math Box app icon, and then press
  .
.
This displays the Math Box menu.

2. Select [Dice Roll], and then press .
This displays the parameter input screen.
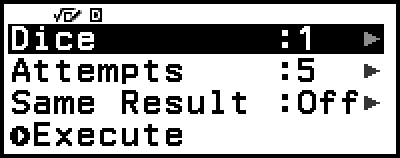
Dice: Select the number of dice as 1, 2, or 3.
Attempts: Input the number of dice rolls (number of trials) as a value from 1 to 250.
Same Result: This setting is normally Off (initial default setting). For details, see "Same Result Setting".
3. Select each of the menu settings and configure them the way you want.
(1) Select [Dice] and then press . On the menu that appears, select [2 Dice] and then press .
(2) Select [Attempts] and then press . On the input screen that appears, input 100 and then press . Select [Confirm] and then press .
(3) Leave the [Same Result] set to Off (initial default setting).
4. After all of the settings are the way you want, select [Execute] and then press .
This displays the Result Type menu.
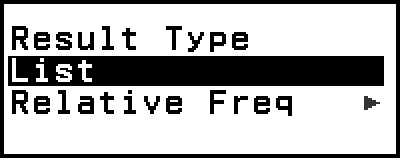
List: Shows a list of the outcome of each roll (trial).*1
Relative Freq: Shows the number of occurrences based on roll results*2 and their relative frequencies.
*1 When there are two dice, the outcome of each roll is displayed along with each roll’s sum and difference. When there are three dice, the outcome of each roll is displayed along with the sum of the roll.
*2 Outcome (1 through 6) in the case of one die, sum (2 through 12) or difference (0 through 5) of the outcomes in the case of two dice, and sum (3 through 18) of the outcomes in the case of three dice.
5. Use the Result Type menu to select a result display format.
(1) Here, we want to display the number of occurrences and relative frequencies, so select [Relative Freq] and then press .
This displays the [Sum] or [Difference] selection menu.
(2) Here, we want to display the difference in the outcome of each roll, so select [Difference] and then press .
The simulation result is displayed on the Relative Freq screen.
- (The result differs with each execution.)
For details about the simulation result screen, see "Dice Roll Result Screen".
6. To display results using a different format, display the result screen and then press  .
.
This returns to the Result Type menu, so you can repeat step 5 of this procedure and change the result display format.
7. If you want to perform a simulation with different settings, press while the Result Type menu is displayed.
This clears the simulation result and returns to the parameter input screen. Perform the procedure again from step 3.
8. To exit Dice Roll, press while the parameter input screen is displayed.
This returns to the Math Box menu.
Note
On the Relative Freq screen, you can store the value in a Rel Fr column cell to a variable. For example, performing the following operation in step 5, above, will store the value in the first row of the "Rel Fr" column to variable A:  – [A=] > [Store]. For details about variables, see "Variables (A, B, C, D, E, F, x, y, z)".
Dice Roll Result Screen
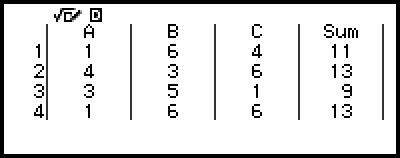
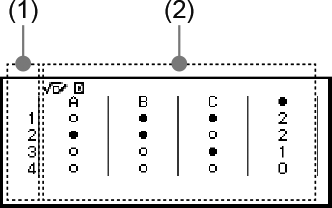
List screen
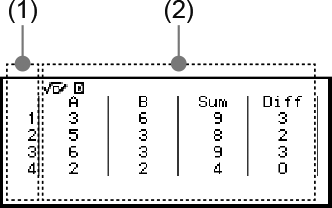
(1) Each row shows a sequential roll number. For example, 1 is the first roll, 2 is the second roll, and so on.
(2) A, B, and C indicate each of the die being used. "Sum" is for the outcome total, and "Diff" is for the difference between the outcomes of two dice. The columns that appear on the display depend on how many dice are being used.
1 die: A-column only.
2 dice: A, B, Sum, and Diff columns.
3 dice: A, B, C, and Sum columns.
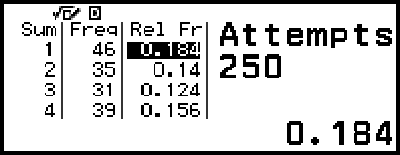
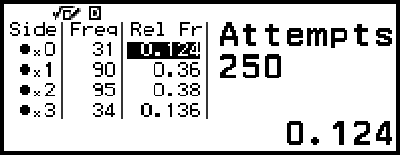
Relative Freq screen
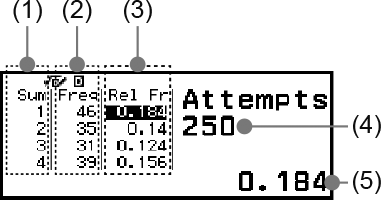
(1) Sum or Diff: Shows the one die outcome (Sum: 1 through 6), two dice outcome sum (Sum: 2 through 12) or difference (Diff: 0 through 5), or three dice outcome sum (Sum: 3 through 18).
(2) Freq: Shows the number of occurrences (frequency) of each roll outcome.
(3) Rel Fr: Shows the relative frequency (frequency divided by number of rolls) of roll results.
(4) Number of trials
(5) Highlighted Rel Fr cell’s value
Same Result Setting
When executing a Dice Roll or Coin Toss simulation with Same Result at its initial default setting (Off), each execution displays a different (random) result. If the Same Result setting is changed to something other than Off, the displayed results are those determined by the calculator. Using the #1, #2, or #3 setting is useful when you want the same result to be displayed by all the calculators being used by the students in a class.
Note
To have multiple calculators display the same result, make sure that the settings below are identical on all of the calculators.
- Number of dice or coins
- Number of trials (rolls or tosses)
- Same Result setting (#1, #2, or #3)
Coin Toss
Coin Toss performs a simulation of one, two, or three virtual coin tosses a specified number of times. You can select either of the following screens for the result.
List screen
Relative Freq screen
The screen shows heads as  and tails as
  .
.
Coin Toss General Operation Procedure
Example: To simulate 100 tosses of three coins. For this example, the Relative Freq screen is used for simulation results, showing the number of heads (0, 1, 2, 3) and the relative frequencies of heads of each toss.
1. Press , select the Math Box app icon, and then press .
This displays the Math Box menu.

2. Select [Coin Toss], and then press .
This displays the parameter input screen.
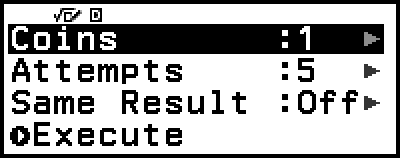
Coins: Select the number of coins as 1, 2, or 3.
Attempts: Input the number of coin tosses (number of trials) as a value from 1 to 250.
Same Result: This setting is normally Off (initial default setting). For details, see "Same Result Setting".
3. Select each of the menu settings and configure them the way you want.
(1) Select [Coins] and then press . On the menu that appears, select [3 Coins] and then press .
(2) Select [Attempts] and then press . When the input screen appears, input 100 and then press . Select [Confirm] and then press .
(3) Leave the [Same Result] set to Off (initial default setting).
4. After all of the settings are the way you want, select [Execute] and then press .
This displays the Result Type menu.
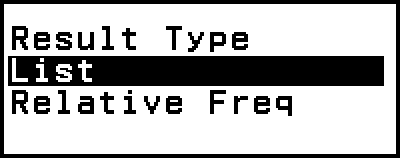
List: Shows a list of heads or tails*1 for each toss (trial).
Relative Freq: Shows the number of occurrences for each coin that comes up heads,*2 and their relative frequencies.
*1 When there are two or three coins, shows the number of coins of each toss that come up heads.
*2 For two or three coins. When there is one coin, this shows the frequencies of heads and tails and the relative frequencies.
5. Use the Result Type menu to select a result display format.
Here we want to display the number of occurrences and relative frequencies, so select [Relative Freq] and then press .
The simulation result is shown on the Relative Freq screen.
- (The result differs with each execution.)
For details about the simulation result screen, see "Coin Toss Result Screen".
6. To display results using a different format, display the result screen and then press .
This returns to the Result Type menu, so you can repeat step 5 of this procedure and change the result display format.
7. If you want to perform a simulation with different settings, press while the Result Type menu is displayed.
This clears the simulation result and returns to the parameter input screen. Perform the procedure again from step 3.
8. To exit Coin Toss, press while the parameter input screen is displayed.
This returns to the Math Box menu.
Note
On the Relative Freq screen, you can store the value in a Rel Fr column cell to a variable. For example, performing the following operation in step 5, above, will store the value in the first row of the "Rel Fr" column to variable A: – [A=] > [Store].
Coin Toss Result Screen
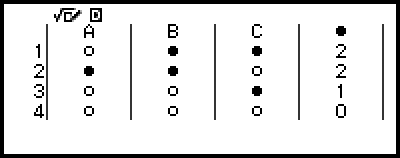
List screen
(1) Each row shows a sequential toss number. For example, 1 is the first toss, 2 is the second toss, and so on.
(2) A, B, and C indicate each of the coins being used. When two coins or three coins are being used, the column on the right shows the number of coins that came up heads.
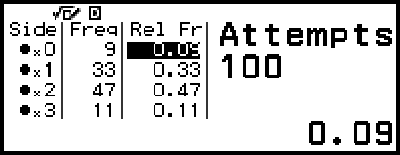
Relative Freq screen
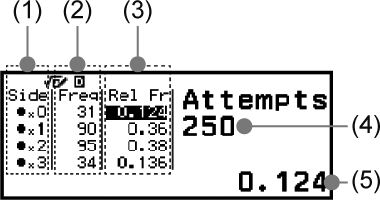
(1) Side: When using only one coin, "" indicates heads while "" indicates tails. When using two or three coins, this column shows the number of heads (0 to 3).
(2) Freq: Shows the number of occurrences (frequency) of each toss outcome.
(3) Rel Fr: Shows the relative frequency (frequency divided by number of tosses) of toss results.
(4) Number of trials
(5) Highlighted Rel Fr cell’s value
Circle
Circle provides the functions described below, which can be used to learn about angles and trigonometric functions.
Unit Circle and Half Circle Graphics
The Unit Circle graphic shows the unit circle with a radius of 1, while the Half Circle graphic shows a half circle with a radius of 1. Both the unit circle and half circle are centered on the origin of rectangular coordinates. The figures below show each type of circle with angles of θ1 and θ2, along with trigonometric function values.
Unit Circle
Half Circle
Clock Graphic
The Clock graphic can be used to show the two angles that the hour and minute hands form depending on the time of day. The figure below shows a clock graphic with angles θ1 and θ2. In this graphic, the position of the minute hand is fixed at 12 o’clock.
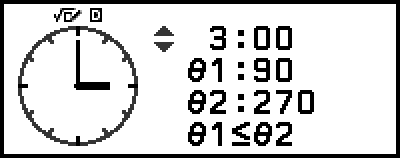
Clock
Circle General Operation Procedure
1. Press , select the Math Box app icon, and then press .
This displays the Math Box menu.

2. Configure the Angle Unit setting as required.
You can select any one of the following units for angle value input: Degree, Radian, Gradian. See "Changing Calculator Settings".
3. Select [Circle], and then press .
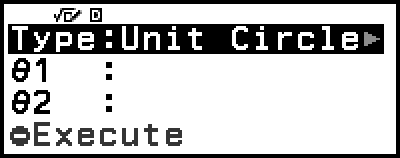
This displays the parameter input screen.
If you want to select Unit Circle for this procedure, you can proceed directly to step 5. (In this case, press  to selects [θ1] in step 5.)
4. Select the Circle type you want to use.
(1) Select [Type], and then press .
(2) On the type list that appears, select [Unit Circle], [Half Circle], or [Clock] and then press .
If you selected [Unit Circle] or [Half Circle], you can proceed directly to step 5.
If you selected [Clock], proceed to step 6.
5. Input the [θ1] and [θ2] angles.
When inputting an angle value, use the unit for the currently selected Angle Unit setting.
For example, perform the operation below to input 45° for [θ1] and 135° for [θ2] (Angle Unit: Degree).
- 45135
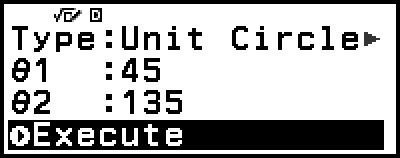
For the allowable input range for angle values, see the "Note" below.
6. After making sure that [Execute] is selected, press .
This displays the graphic screen.
Refer to the sections below for information about how to view the graphic screen and perform its operations.
"Unit Circle and Half Circle Graphic Screens"
"Clock Graphic Screen"
7. Press to return to the parameter input screen from the graphic screen.
8. To exit Circle, display the parameter input screen and then press .
This returns to the Math Box menu.
Note
The table below shows the allowable input ranges for values you input in step 5 above.
| Angle Unit setting | Unit Circle | Half Circle |
| Degree | -10000 < θ < 10000 | 0 ≤ θ ≤ 180 |
| Radian | 0 ≤ θ ≤ π* | |
| Gradian | 0 ≤ θ ≤ 200 |
* 3.1415926535897932384626
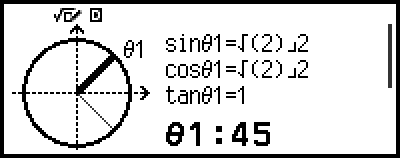
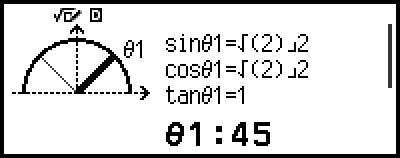
Unit Circle and Half Circle Graphic Screens
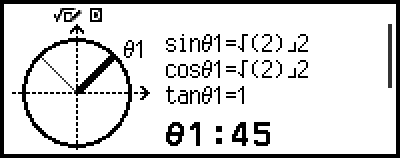
The Unit Circle and Half Circle appear as shown below. The sample displays below are for when values for both θ1 and θ2 have been input.
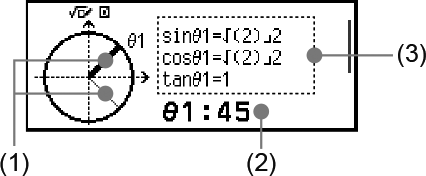
Unit Circle
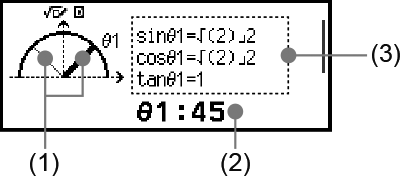
Half Circle
(1) Lines forming angles [θ1] and [θ2]. The currently selected line is thicker than the other line. You can change the selection between θ1 and θ2 by pressing  or .
or .
(2) Angle value of the currently selected line’s angle (θ1 or θ2).
(3) Trigonometric function values of the currently selected line’s angle (θ1 or θ2).
Note
When only a single angle (θ1 or θ2) is input, a single thick line will be displayed to form the angle. In this case, the angle value of the single angle is shown for (2), and trigonometric function values for the angle are shown for (3).
On the graphic screen, the values of the trigonometric functions are displayed in accordance with the settings of Input/Output and Angle Unit.
When MathI/MathO or MathI/DecimalO is selected for Input/Output, trigonometric values may include fraction or √ values as applicable.
Example: sin (45) = √2/2, cos (30) = √3/2 (Angle Unit: Degree)
Clock Graphic Screen
The example below shows a typical Clock graphic screen.
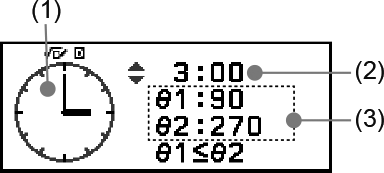
(1) Clock graphic. The Clock always initially indicates 12 o’clock.
Press to advance the hour hand by one hour, or to move it back.
(2) Time indicated by the clock.
(3) θ1: The smaller angle between the hour and minute hands.
θ2: The larger angle between the hour and minute hands.
Note
Angle values are displayed in accordance with the settings of Input/Output and Angle Unit.
If Radian is selected for Angle Unit and MathI/MathO is selected for Input/Output, the angle value will be displayed in π format.