Distribution Calculations
In the Distribution app, you can obtain the probability value by selecting the distribution calculation type and inputting various parameters.* Executable distribution calculation types are shown in the table below.
| Distribution Calculation Type | Menu Item |
|---|---|
| Binomial probability | Binomial PD |
| Binomial cumulative probability | Binomial CD |
| Normal probability density | Normal PD |
| Normal cumulative probability | Normal CD |
| Inverse normal cumulative distribution* | Inverse Normal |
| Poisson probability | Poisson PD |
| Poisson cumulative probability | Poisson CD |
* "Inverse Normal" performs inverse calculation to determine the data value (xInv) from a probability value (Area).
General Procedure for Performing a Distribution Calculation
Example: To calculate binomial cumulative probability for the x data {2, 3, 4, 5} when N (number of trials) = 5 and p (probability of success) = 0.5
1. Press  , select the Distribution app icon, and then press
  .
.
This displays the distribution calculation type menu.
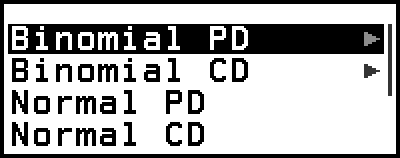
2. On the menu, select a distribution calculation type.
Here we want to calculate binomial cumulative probability. Select [Binomial CD], and then press .
3. On the menu that appears, select a data (x) input method.

[List] ... Select to input multiple x-data items at the same time. Selecting this menu item causes the list screen to appear.
[Variable] ... Select to input a single x-data item. Selecting this menu item causes a parameter input screen to appear.
Here we want to input multiple x-data items at the same time, select [List] and then press .
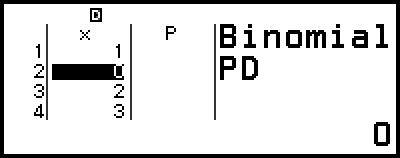
4. On the list screen, input x data {2, 3, 4, 5}.
- 2
 345
345 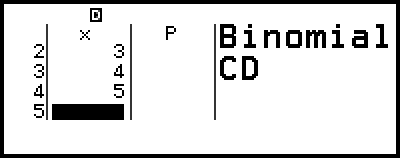
5. Press .
This displays the Binomial CD parameter input screen.
6. Input values for the parameters (N = 5, p = 0.5).
- 50
 5
5 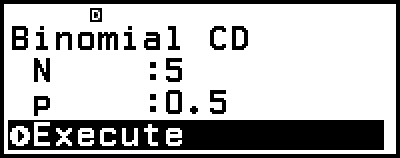
The parameters that require data input depend on the calculation type you selected in step 2 of this procedure. For details, see the "Parameter List".
7. After inputting values for all of the parameters, select [Execute] and then press .
This displays the calculation result screen.
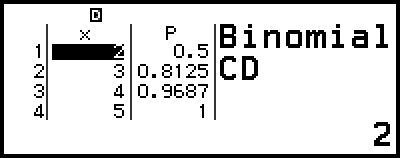
If you selected [List] in step 3, calculation results (P column) will appear on the list screen. For details, see "List Screen".
If you perform any editing operation (see "Editing the List Screen Contents") on the list screen while calculation results are displayed, all the calculation results will be cleared. The list will return to its state in step 4 (list screen data input complete) of this procedure.
An error message appears if the input value is outside the allowable range. "ERROR" will appear in the P column of the calculation result screen when the value input for the corresponding data is outside the allowable range.
Pressing while the calculation result screen is displayed will return to the parameter input screen.
Note
If you selected Normal PD, Normal CD, or Inverse Normal in step 2 above, the data (x) input method is always "Variable" (single x-data item input). Because of this, the menu in step 3 is not displayed at this time.
If the data (x) input method is "Variable", the calculation result will be stored in Ans memory.
Distribution calculation accuracy is up to 6 significant digits.
Parameter List
The list below shows the meanings of the symbols that appear on the parameter input screen.
Binomial PD, Binomial CD
x … data
N … number of trials
p … probability of success (0 ≤ p ≤ 1)
Normal PD
x … data
μ … population mean
σ … population standard deviation (σ > 0)
Normal CD
Lower … lower boundary
Upper … upper boundary
μ … population mean
σ … population standard deviation (σ > 0)
Inverse Normal
Area … probability value (0 ≤ Area ≤ 1)
μ … population mean
σ … population standard deviation (σ > 0)
(This function returns the upper limit value xInv when the left tail of a normal distribution is the lower limit.)
Poisson PD, Poisson CD
x … data
λ … mean
Note
The last value input for each parameter name is retained, regardless of the input screen where it is input. For example, inputting a value for N on the Binomial PD parameter input screen will also change the value of N on the Binomial CD parameter input screen.
The values you input for each of the parameters are retained as long as you do not execute either of the following operations:  – [Reset] > [Settings & Data] or – [Reset] > [Initialize All].
List Screen
You can use the list screen to input up to 45 x-data items. Calculation results are also displayed on the list screen.
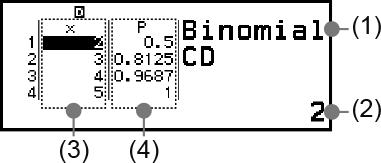
(1) Distribution calculation type
(2) Value at current cursor position
(3) Data (x)
(4) Calculation results (P)
Note
On the list screen, you can store the value in a cell to a variable. For example, performing the following operation while the above screen is displayed will store 1 to variable A:  – [A=] > [Store]. For details about variables, see "Variables (A, B, C, D, E, F, x, y, z)".
Performing one of the operations below deletes all x-data input on the list screen.
- Returning to the HOME screen and launching another calculator app
- Executing [Delete All] (See "To delete all list screen contents".)
- Executing – [Reset] > [Settings & Data] or – [Reset] > [Initialize All]
Editing the List Screen Contents
To change the x data in a cell
On the list screen, move the cursor to the cell containing the data you want to change, input the new data, and then press .
To delete a row
On the list screen, move the cursor to the row you want to delete and then press  .
.
To insert a row
1. On the list screen, move the cursor to the row that will be under the row you will insert.
2. Perform the following operation:  – [Edit] > [Insert Row].
This inserts a row with 0 input as the initial default value.
3. Input the data.
To delete all list screen contents
On the list screen, perform the following operation: – [Edit] > [Delete All].
Calculation Example
To calculate the normal probability density when x = 36, μ = 35, σ = 2
1. Press , select the Distribution app icon, and then press .
2. On the distribution calculation type menu that appears, select [Normal PD], and then press .
This displays the Normal PD parameter input screen.
3. Input values for the parameters (x = 36, μ = 35, σ = 2).
- 36352

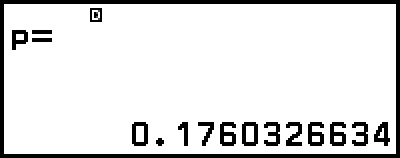
4. Press .
Pressing again or pressing  or
or  returns to the parameter input screen in step 3 of this procedure.
You can store the currently displayed calculation result to a variable. For example, performing the following operation while the screen in step 4 is displayed above will store the calculation result to variable A: – [A=] > [Store]. For details about variables, see "Variables (A, B, C, D, E, F, x, y, z)".