Checking Changes in Barometric Pressure Over Time
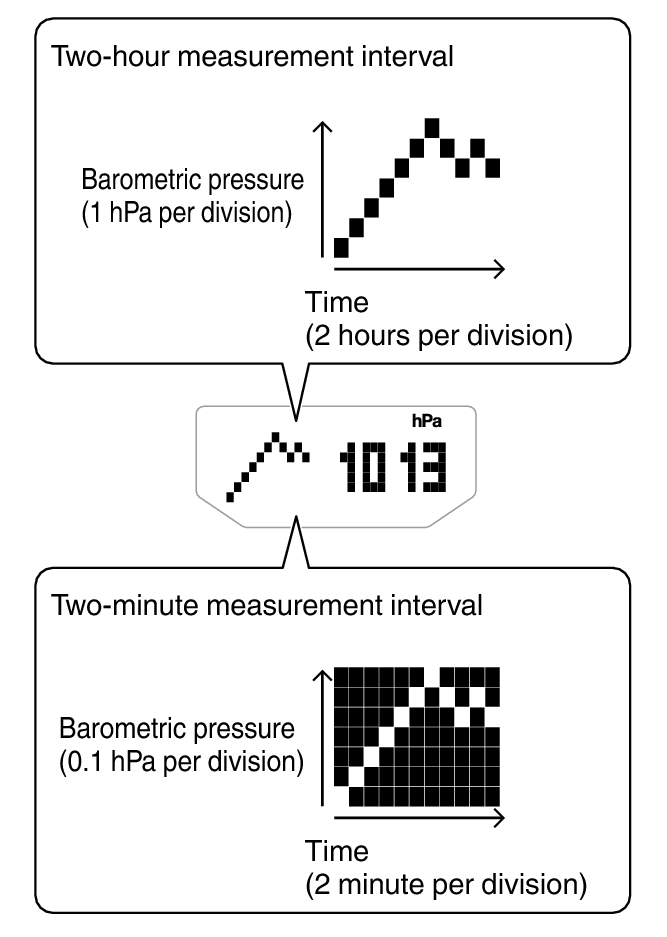
The watch can be configured to show a graph of pressure readings taken every two hours or every two minutes.
You can display a graph of barometric pressure readings for the past 20 hours or the past 20 minutes. The square ( ) at the far right of the graph indicates the latest barometric pressure reading.
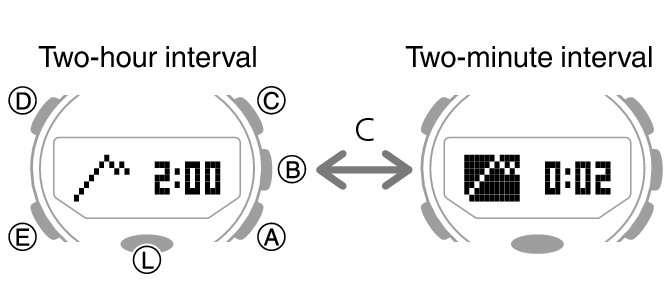
Changing the Measurement Interval of the Barometric Pressure Graph
You can select a measurement interval of two hours or two minutes for the barometric pressure graph.
-
1.Hold down (C) for at least two seconds to toggle between measurement interval settings.
-
- When the measurement interval of the barometric pressure graph is two hours, measurements are taken every two minutes.
- When the measurement interval of the barometric pressure graph is two minutes, measurements are taken every five seconds.
Predicting Upcoming Weather
|
A trend like this: |
Means this: |
|---|---|
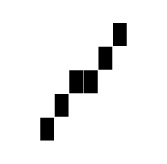 |
Rising barometric pressure, which indicates that upcoming weather probably will be fair. |
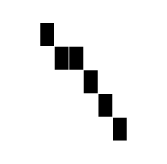 |
Falling barometric pressure, which indicates that upcoming weather probably will be bad. |
 Top of page