Using Tide Graph (When connected with an Android smartphone only)
The Tide Graph screen shows tide information for a specific point (port). A Fishing Time screen indicates optimum fishing times based on the Moon age and Moon hour angle of your current location.
Color Display

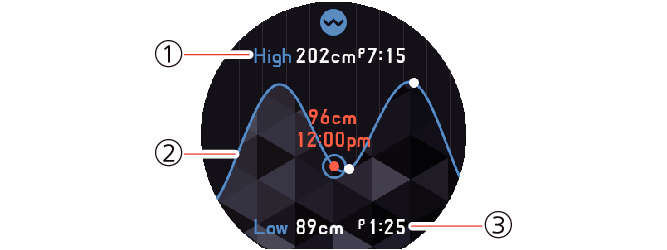
Tide Graph Screen

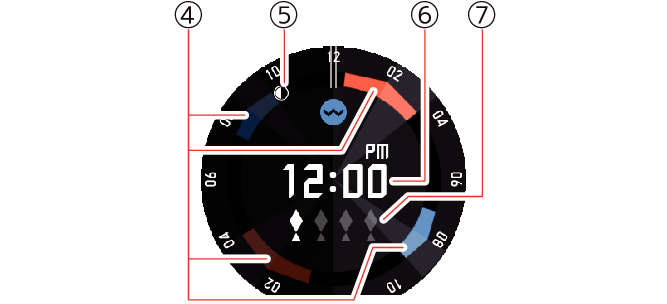
Fishing Time Screen
- ①
-
Shows the next high tide level and time for the 12-hour period starting from the current time.
- ②
-
Graphic indication of tide levels for the previous 12-hour period and the following 12-hour period starting from the current time (24 hours total). Orange characters shows current time and tide level.
- ③
-
Shows the next low tide level and time for the 12-hour period starting from the current time.
- ④
-
Shows the predicted optimum fishing time frame for the current date.
- ⑤
-
The position of the indicator indicates the current Moon position (hour angle). It also indicates the Moon phase based on current Moon age.
- ⑥
-
Current time.
- ⑦
-
Fish marks indicate the projected probability of fishing success. The more fish marks, the better the probability.
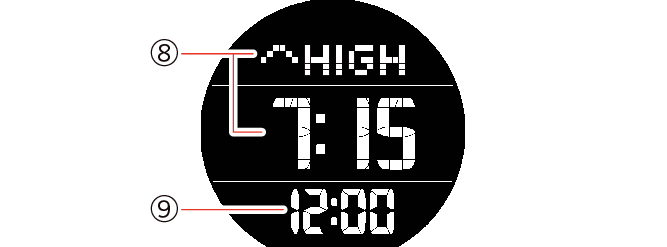
Monochrome Display

- ⑧
-
Alternates at 10-second intervals between high tide time and low tide time.
 is displayed for the high tide time, while
  is displayed for the low tide time.
 - ⑨
-
Current time.
To switch the color display screen
On the Tide Graph screen, swiping from right to left changes to the Fishing Time screen. Swiping the Fishing Time screen from left to right displays the Tide Graph screen.

 Top of page