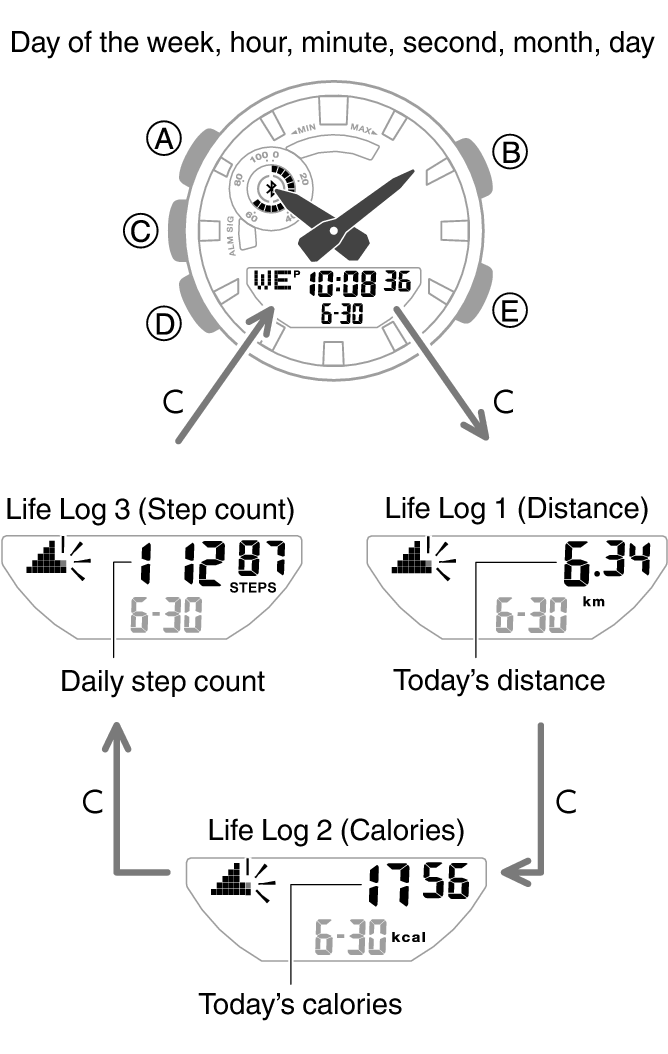
Scrolling Between Life Log Screens
1. Enter the Timekeeping Mode.
2. Press (C) to display the Life Log screen.
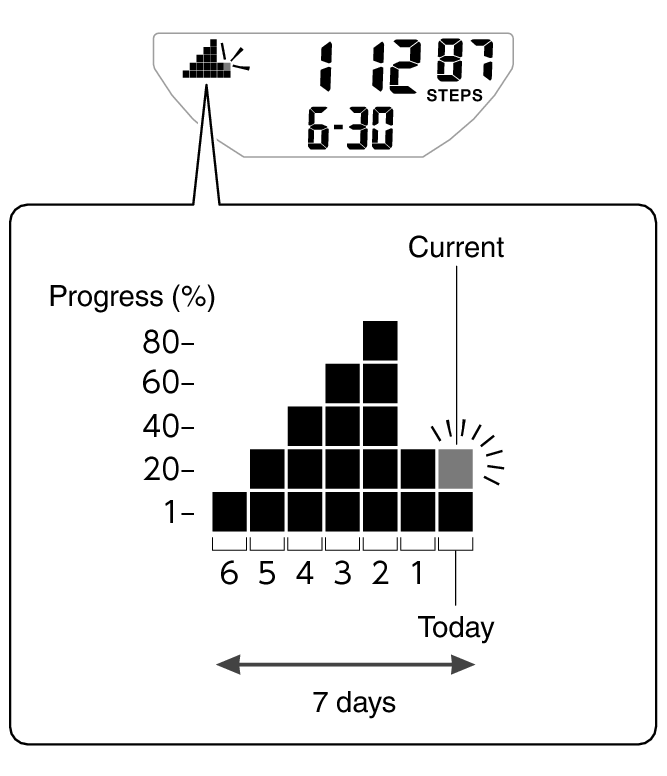
Interpreting the Progress Graph The progress graph shows the progress you have made towards reaching the daily distance, calorie, and step count target values you specified. You can view your daily progress for up to seven days.
Graph contents are normally refreshed every minute.
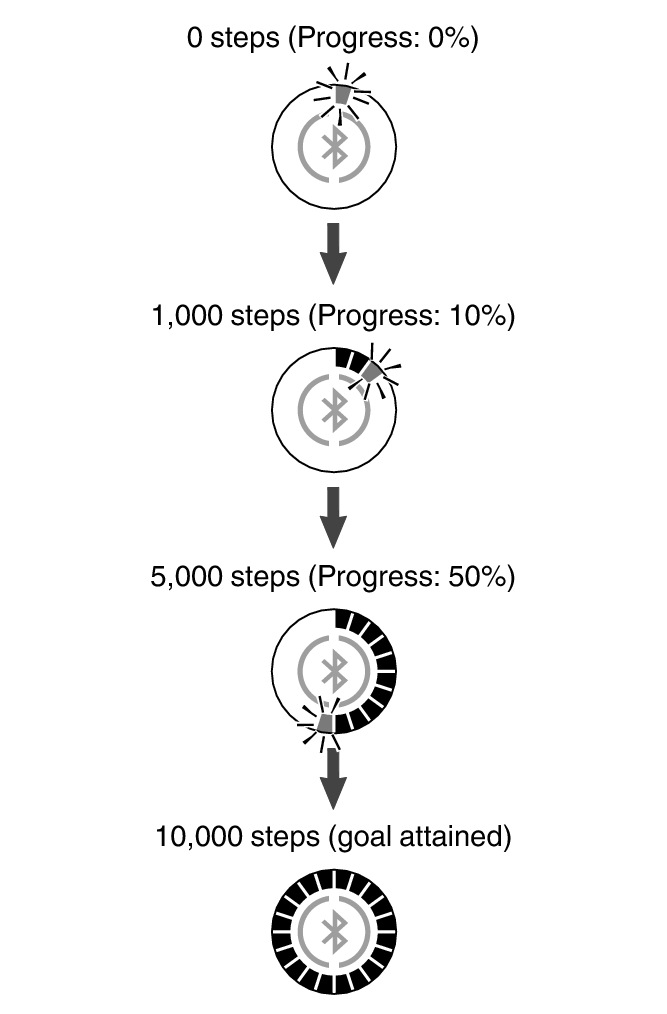
Checking Your Progress to Your Daily Step Target Graphic Indicator A shows the current percent (%) of the preset target value that has been reached.
Example: Daily target of 10,000 steps
Note
Distance can be measured up to 9,999.99 km. The watch display will continue to show 9,999.99 km even if the actual distance becomes 10,000 km or greater.
Calories can be measured up to 999,999kcal. The watch display will continue to show 999,999kcal even if the actual calories burned becomes 1,000,000kcal or greater.
The step count can show a value up to 99,999 steps. If the step count exceeds 99,999, the maximum value (99,999) remains on the display.
To avoid miscounting of non-walking movements, the step count will not start until after you have been walking for about 20 seconds. The number of steps you took during the first 20 seconds will be included in the total.
The step count is reset to zero at midnight each day.
To save power, step counting stops automatically if you take off the watch (no detectable watch movement) and you do not perform any operation for two or three minutes.
Graph contents are updated even when any one of the events below occurs.
When the step counting is disabled to save power
When counting is not possible due to accelerometer error or insufficient power


 Top of page