fx-83GT X/fx-85GT X
CLASSWIZ
Scientific Calculator
Before Using the Calculator
Calculation Modes and Calculator Setup
Inputting Expressions and Values
- ▶Inputting a Calculation Expression Using Values
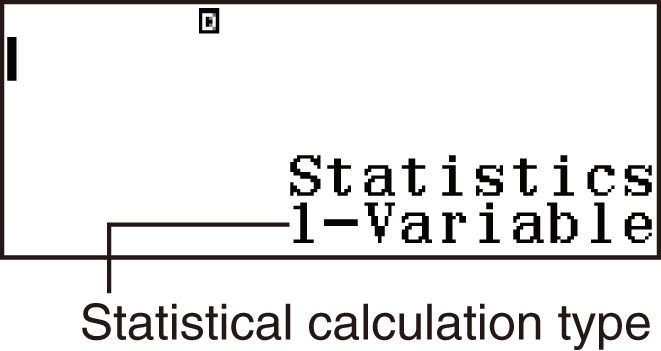
- ▶Inputting an Expression Using Natural Textbook Format
(MathI/MathO or MathI/DecimalO Only) - ▶Displaying Calculation Results in a Form that Includes
√2, π, etc. (Irrational Number Form)
Basic Calculations
- ▶Recurring Decimal Calculations
- ▶Toggling Calculation Results
- ▶Arithmetic Calculations
- ▶Fraction Calculations
- ▶Percent Calculations
- ▶Degree, Minute, Second (Sexagesimal) Calculations
- ▶Multi-Statements
- ▶Using Engineering Notation
- ▶Prime Factorization
- ▶Calculation History and Replay
- ▶Using Memory Functions
Function Calculations
- ▶Pi (π), Natural Logarithm Base e
- ▶Trigonometric Functions, Inverse Trigonometric Functions
- ▶Hyperbolic Functions, Inverse Hyperbolic Functions
- ▶Converting an Input Value to the Calculator’s Default Angle Unit
- ▶Exponential Functions, Logarithmic Functions
- ▶Power Functions and Power Root Functions
- ▶Rectangular-Polar Coordinate Conversion
- ▶Factorial (!)
- ▶Absolute Value Calculation (Abs)
- ▶Random Number (Ran#), Random Integer (RanInt#)
- ▶Permutation (nPr) and Combination (nCr)
- ▶Rounding Function (Rnd)
Using Calculation Modes
- ▶Statistical Calculations
- Inputting Data with Statistics Editor
- Statistical Calculation Screen
- Using the Statistical Menu
- Displaying Statistical Values Based On Input Data
- Displaying Regression Calculation Results Based On
Input Data (Paired-Variable Data Only) - Single-variable Statistical Calculation Commands
- Single-variable Statistical Calculation Examples
- Linear Regression Calculation (y=a+bx) Commands
- Linear Regression Calculation Examples
- Quadratic Regression Calculation (y=a+bx+cx2) Commands
- Quadratic Regression Calculation Examples
- Logarithmic Regression Calculation (y=a+b・ln(x)) Commands
- Logarithmic Regression Calculation Examples
- e Exponential Regression Calculation (y=a・e^(bx)) Commands
- e Exponential Regression Calculation Examples
- ab Exponential Regression Calculation (y=a・b^x) Commands
- ab Exponential Regression Calculation Examples
- Power Regression Calculation (y=a・x^b) Commands
- Power Regression Calculation Examples
- Inverse Regression Calculation (y=a+b/x) Commands
- Inverse Regression Calculation Examples
- ▶Creating a Number Table
- ▶Ratio Calculations
Technical Information
- ▶Errors
- ▶Before Assuming Malfunction of the Calculator...
- ▶Replacing the Battery
- ▶Calculation Priority Sequence
- ▶Stack Limitations
- ▶Calculation Ranges, Number of Digits, and Precision
- ▶Specifications
Frequently Asked Questions
Statistical Calculations
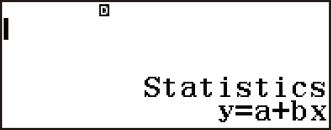
Perform the steps below to start a statistical calculation.
1. Press  , select the Statistics Mode icon, and then press
  .
.
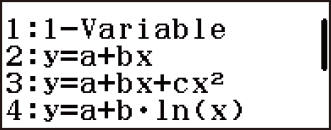
2. On the Select Type screen that appears, press one of the keys below to select a statistical calculation type.
 (1-Variable) (1-Variable) |
Single-variable (x) |
 (y=a+bx) (y=a+bx) |
Paired-variable (x, y), linear regression |
 (y=a+bx+cx2) (y=a+bx+cx2) |
Paired-variable (x, y), quadratic regression |
 (y=a+b・ln(x)) (y=a+b・ln(x)) |
Paired-variable (x, y), logarithmic regression |
 (y=a・e^(bx)) (y=a・e^(bx)) |
Paired-variable (x, y), e exponential regression |
| (y=a・b^x) |
Paired-variable (x, y), ab exponential regression |
| (y=a・x^b) |
Paired-variable (x, y), power regression |
| (y=a+b/x) |
Paired-variable (x, y), inverse regression |
Performing any of the above key operations displays the Statistics Editor.
Note
When you want to change the calculation type after entering the Statistics Mode, perform the key operation  (Select Type) to display the calculation type selection screen.
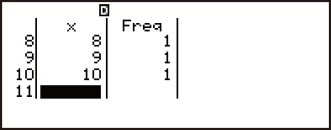
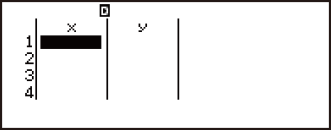
Inputting Data with Statistics Editor
Statistics Editor
There are two Statistics Editor formats, depending on the type of statistical calculation you selected.
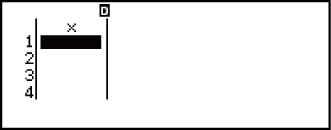
Single-variable

Paired-variable
The first line of the Statistics Editor shows the value for the first sample or the values for their first pair of samples.
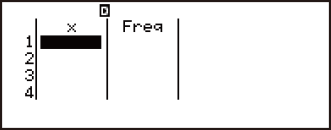
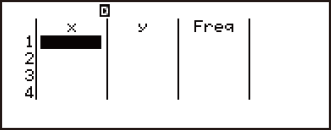
Freq (Frequency) Column
If you turn on the Statistics setting on the setup menu, a column labeled “Freq” will also be included on the Statistics Editor.
You can use the Freq column to specify the frequency (the number of times the same sample appears in the group of data) of each sample value.
Single-variable
Paired-variable
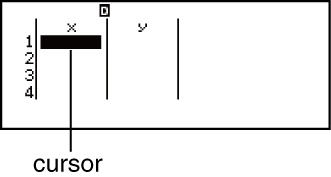
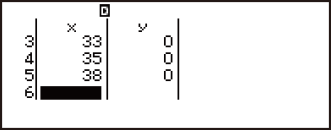
Rules for Inputting Sample Data on the Statistics Editor
Data you input is inserted into the cell where the cursor is located. Use the cursor keys to move the cursor between cells.
After inputting a value, press . This registers the value and displays up to six of its digits in the currently selected cell.
Example 1: To input the value 1234 in cell X1
(Move the cursor to cell X1.)
- 1234
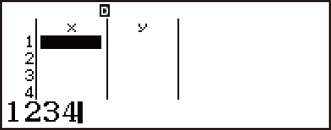
- The value you input appears in the formula area.
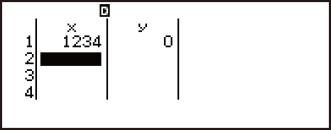
- Registering a value causes the cursor to move down one cell.
Example 2: To select logarithmic regression and input the following data: (170, 66), (173, 68), (179, 75)
- (Select Type)(y=a+b・ln(x))

- 170173179

666875 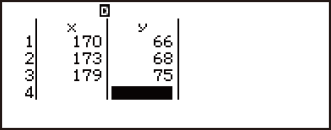
Statistics Editor Input Precautions
The number of lines in Statistics Editor (the number of sample data values you can input) depends on the type of statistical calculation you selected, and on the Statistics setting on the setup menu.
Statistics setting calculation type |
Off (No Freq column) |
On (Freq column) |
| Single-variable | 160 lines | 80 lines |
| Paired-variable | 80 lines | 53 lines |
Pressing the  key while the Statistics Editor is on the screen will display a statistical calculation screen for performing calculations based on the input data. What you need to do to return to the Statistics Editor from the statistical calculation screen depends on the calculation type you selected. Press (Data) if you selected single-variable or (Data) if you selected paired-variable.
Precautions Concerning Sample Data Storage
All data currently input in the Statistics Editor is deleted whenever you exit the Statistics Mode, switch between the single-variable and a paired-variable statistical calculation type, or change the Statistics setting on the setup menu.
Editing Sample Data
To replacing the data in a cell
1. On the Statistics Editor, move the cursor to the cell you want to edit.
2. Input the new data value or expression, and then press .
Important!
Note that you must totally replace the existing data of the cell with new input. You cannot edit parts of the existing data.
To delete a line
1. On the Statistics Editor, move the cursor to the line you want to delete.
2. Press  .
.
To insert a line
1. On the Statistics Editor, move the cursor to the line that will be under the line you will insert.
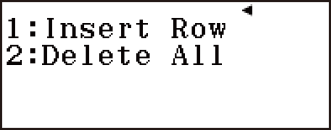
2. Press (Editor).
3. Press (Insert Row).
Important!
Note that the insert operation will not work if the maximum number of lines allowed for the Statistics Editor are already used.
To delete all Statistics Editor contents
1. On the Statistics Editor, press (Editor).
2. Press (Delete All).
Statistical Calculation Screen
The statistical calculation screen is for performing statistical calculations with the data you input with the Statistics Editor. Pressing the key while the Statistics Editor is displayed switches to the statistical calculation screen.
Using the Statistical Menu
While the Statistics Editor or statistical calculation screen is on the display, press to display the statistical menu.
The content to the statistical menu depends on whether the currently selected statistical operation type uses a single variable or paired variables.
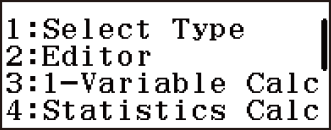
Statistics Editor: Single-variable
| Select this menu item: | When you want to do this: |
|---|---|
| (Select Type) |
Display the statistical calculation type selection screen |
| (Editor) |
Display the Editor sub-menu for editing Statistics Editor contents |
| (1-Variable Calc) |
Display statistical values based on input data |
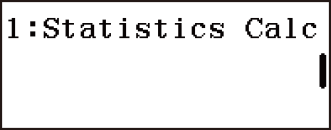
| (Statistics Calc) |
Display the statistical calculation screen |
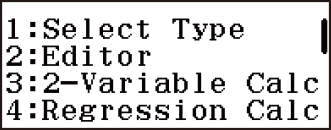
Statistics Editor: Paired-variable
| Select this menu item: | When you want to do this: |
|---|---|
| (Select Type) |
Display the statistical calculation type selection screen |
| (Editor) |
Display the Editor sub-menu for editing Statistics Editor contents |
| (2-Variable Calc) |
Display statistical values based on input data |
| (Regression Calc) |
Display regression calculation results based on input data |
| (Statistics Calc) |
Display the statistical calculation screen |
Statistical calculation screen: Single-variable
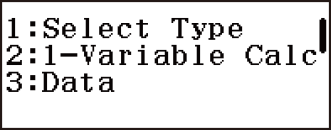
| Select this menu item: | When you want to do this: |
|---|---|
| (Select Type) |
Display the statistical calculation type selection screen |
| (1-Variable Calc) |
Display statistical values based on input data |
| (Data) |
Display the Statistics Editor |
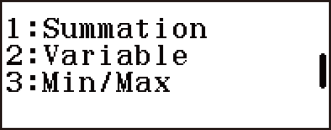
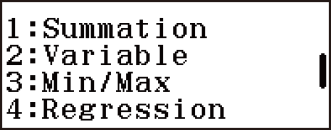
| (Summation) |
Display the Summation sub-menu of commands for calculating sums |
| (Variable) |
Display the Variable sub-menu of commands for calculating the mean, standard deviation, etc. |
| (Min/Max) |
Display the Min/Max sub-menu of commands for obtaining maximum and minimum values |
Statistical calculation screen: Paired-variable
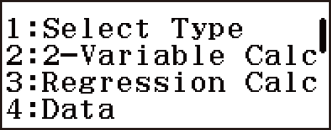
| Select this menu item: | When you want to do this: |
|---|---|
| (Select Type) |
Display the statistical calculation type selection screen |
| (2-Variable Calc) |
Display statistical values based on input data |
| (Regression Calc) |
Display regression calculation results based on input data |
| (Data) |
Display the Statistics Editor |
| (Summation) |
Display the Summation sub-menu of commands for calculating sums |
| (Variable) |
Display the Variable sub-menu of commands for calculating the mean, standard deviation, etc. |
| (Min/Max) |
Display the Min/Max sub-menu of commands for obtaining maximum and minimum values |
| (Regression) |
Display the Regression sub-menu of commands for regression calculations |
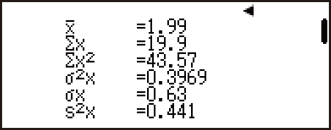
Displaying Statistical Values Based On Input Data
- From the Statistics Editor:
(1-Variable Calc or 2-Variable Calc)
From the statistical calculation screen:
(1-Variable Calc or 2-Variable Calc) 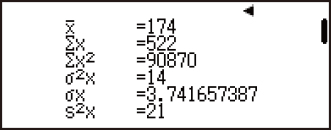
Displaying Regression Calculation Results Based On Input Data (Paired-Variable Data Only)
- From the Statistics Editor:
(Regression Calc)
From the statistical calculation screen:
(Regression Calc) 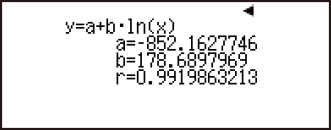
Single-variable Statistical Calculation Commands
The following are the commands that appear on the sub-menus that appear when you select Summation, Variable, or Min/Max on the statistical menu while a single-variable statistical calculation type is selected.
The following is the calculation formula used for each command.
Summation Sub-menu ((Summation))

| Select this menu item: | When you want to obtain this: |
|---|---|
| (Σx) |
Sum of the sample data |
| (Σx2) |
Sum of squares of the sample data |
Variable Sub-menu ((Variable))
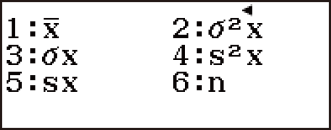
| Select this menu item: | When you want to obtain this: |
|---|---|
| (x) |
Mean of the sample data |
| (σ2x) |
Population variance |
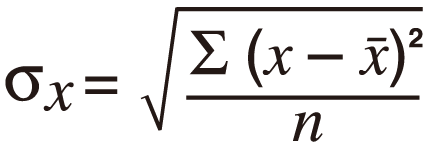
| (σx) |
Population standard deviation |
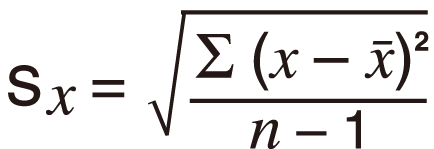
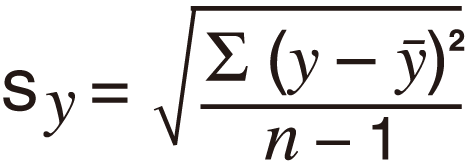
| (s2x) |
Sample variance |
 (sx) (sx) |
Sample standard deviation |
 (n) (n) |
Number of items |
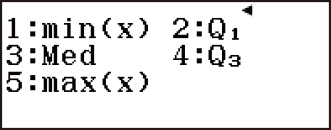
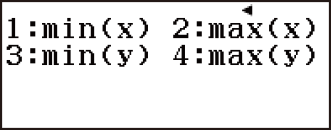
Min/Max Sub-menu ((Min/Max))

| Select this menu item: | When you want to obtain this: |
|---|---|
| (min(x)) |
Minimum value |
| (Q1) |
First quartile |
| (Med) |
Median |
| (Q3) |
Third quartile |
| (max(x)) |
Maximum value |
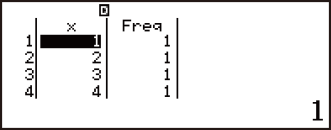
Single-variable Statistical Calculation Examples
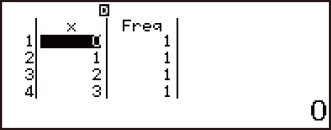
Select single-variable and input the following data: {1, 2, 3, 4, 5, 6, 7, 8, 9, 10} (Statistics: On)
- (Select Type)(1-Variable)

- 12345678910

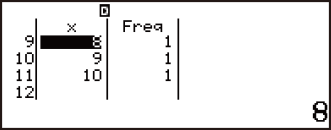
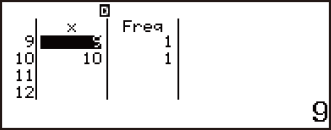
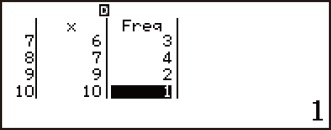
Edit the data to the following, using insert and delete: {0, 1, 2, 3, 4, 5, 6, 7, 9, 10}
- (Data)
- (Editor)
- (Insert Row)


Edit the Freq data to the following: {1, 2, 1, 2, 2, 2, 3, 4, 2, 1}
- (Data)
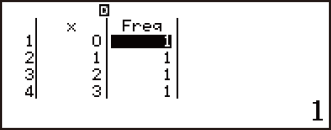
- 2222342

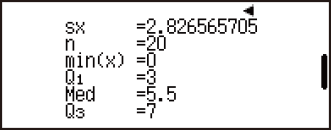
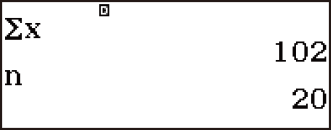
Display statistical values based on input data.
- (1-Variable Calc)
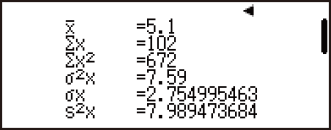
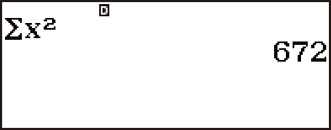
Calculate sum of squares of the sample data and sum of the sample data.
- (Summation)
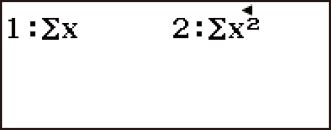
- (Σx2)
- (Summation)
(Σx) 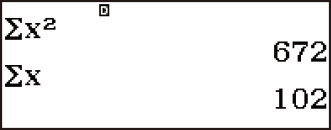
Calculate number of samples, mean, and population standard deviation.
- (Variable)

- (n)
- (Variable)
(x) 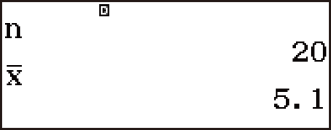
- (Variable)
(σx) 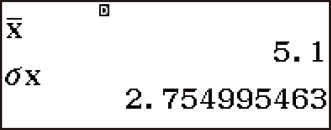
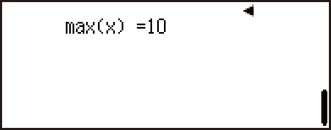
Calculate minimum value and maximum value.
- (Min/Max)
- (min(x))
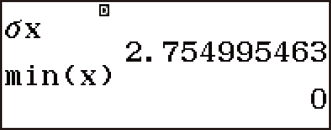
- (Min/Max)
(max(x)) 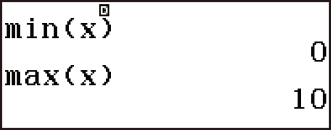
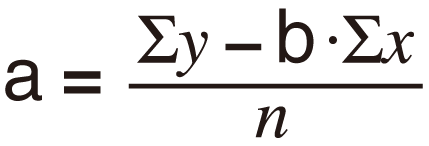
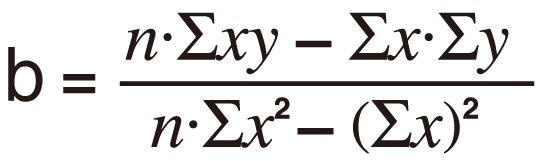
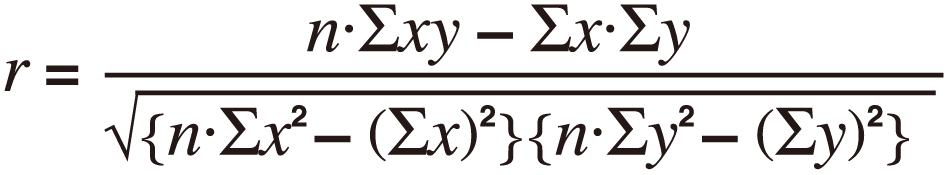
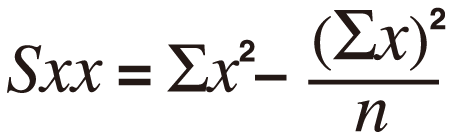
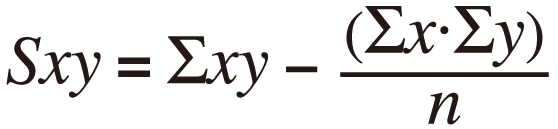
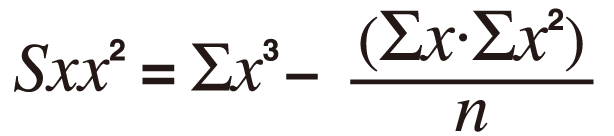
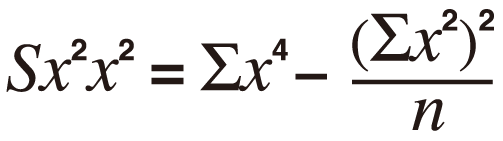
Linear Regression Calculation (y=a+bx) Commands
With linear regression, regression is performed in accordance with the following model equation.
y = a + bx
The following is the calculation formula used for each command.
![]()

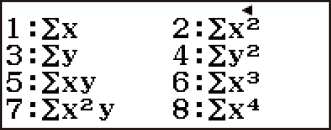
Summation Sub-menu ((Summation))
| Select this menu item: | When you want to obtain this: |
|---|---|
| (Σx) |
Sum of the x-data |
| (Σx2) |
Sum of squares of the x-data |
| (Σy) |
Sum of the y-data |
| (Σy2) |
Sum of squares of the y-data |
| (Σxy) |
Sum of products of the x-data and y-data |
| (Σx3) |
Sum of cubes of the x-data |
 (Σx2y) (Σx2y) |
Sum of (x-data squares × y-data) |
 (Σx4) (Σx4) |
Sum of biquadrate of the x-data |
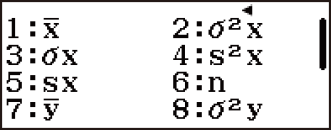
Variable Sub-menu ((Variable))
| Select this menu item: | When you want to obtain this: |
|---|---|
| (x) |
Mean of the x-data |
| (σ2x) |
Population variance of the x-data |
| (σx) |
Population standard deviation of the x-data |
| (s2x) |
Sample variance of the x-data |
| (sx) |
Sample standard deviation of the x-data |
| (n) |
Number of items |
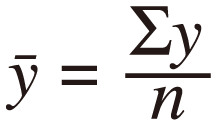
| (y) |
Mean of the y-data |
| (σ2y) |
Population variance of the y-data |
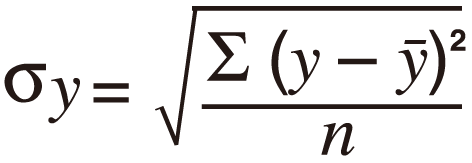
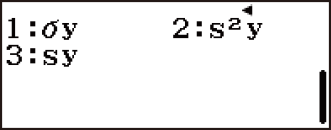
| (σy) |
Population standard deviation of the y-data |
| (s2y) |
Sample variance of the y-data |
| (sy) |
Sample standard deviation of the y-data |
Min/Max Sub-menu ((Min/Max))
| Select this menu item: | When you want to obtain this: |
|---|---|
| (min(x)) |
Minimum value of the x-data |
| (max(x)) |
Maximum value of the x-data |
| (min(y)) |
Minimum value of the y-data |
| (max(y)) |
Maximum value of the y-data |
Regression Sub-menu ((Regression))

| Select this menu item: | When you want to obtain this: |
|---|---|
| (a) |
Regression coefficient constant term a |
| (b) |
Regression coefficient b |
| (r) |
Correlation coefficient r |
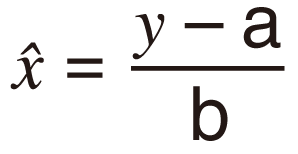
| (xˆ) |
Estimated value of x |
| (yˆ) |
Estimated value of y |
Linear Regression Calculation Examples
Select linear regression and input the following data (Statistics: Off)
| x | y | x | y | |
| 1.0 | 1.0 | 2.1 | 1.5 | |
| 1.2 | 1.1 | 2.4 | 1.6 | |
| 1.5 | 1.2 | 2.5 | 1.7 | |
| 1.6 | 1.3 | 2.7 | 1.8 | |
| 1.9 | 1.4 | 3.0 | 2.0 |
- (Select Type)(y=a+bx)

- 11.21.51.61.9
2.12.42.52.73 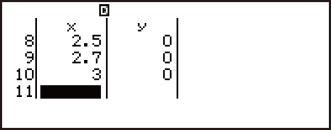
11.11.21.31.4
1.51.61.71.82
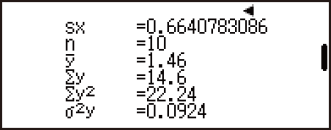
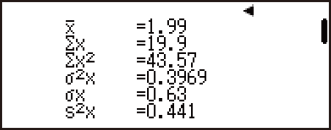
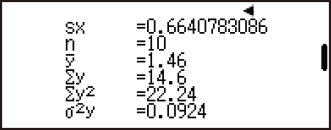
Display statistical values based on input data.
- (2-Variable Calc)
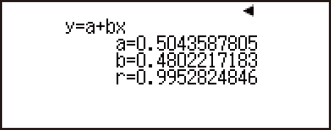
Display regression calculation results based on input data.
- (Regression Calc)
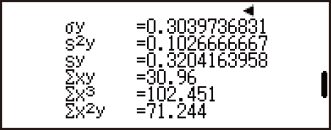
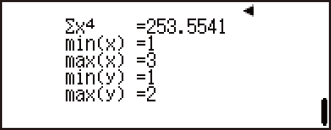
Calculate sum of products of the x-data and y-data, Population standard deviation of the x-data, and maximum value of the y-data.
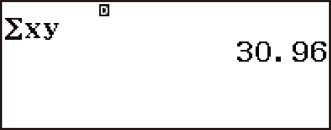
- (Summation)
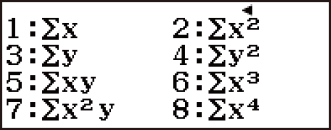
- (Σxy)
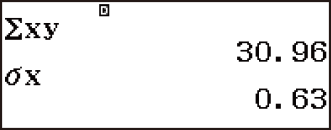
- (Variable)
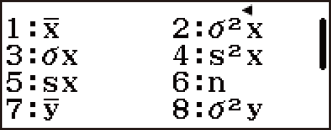
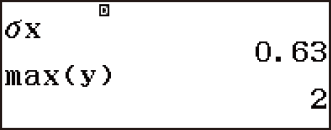
- (σx)
- (Min/Max)
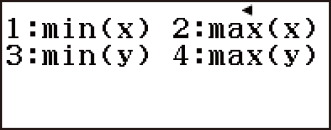
- (max(y))
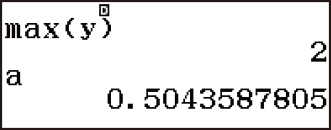
Calculate regression coefficient constant term a, regression coefficient b, and correlation coefficient r.
- (Regression)

- (a)
- (Regression)
(b) 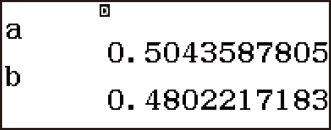
- (Regression)
(r) 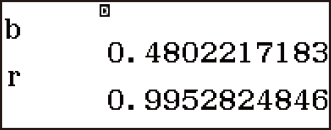
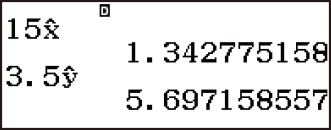
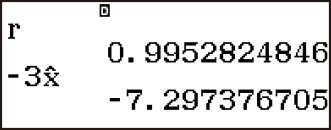
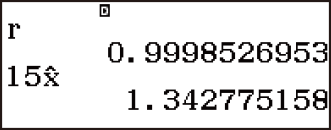
Calculate estimated values.
(y=-3 → xˆ=?)
 3(Regression)
- (xˆ)
(x=2 → yˆ=?)
- 2(Regression)
(yˆ) 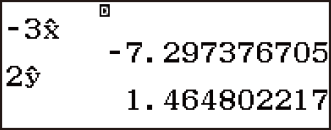
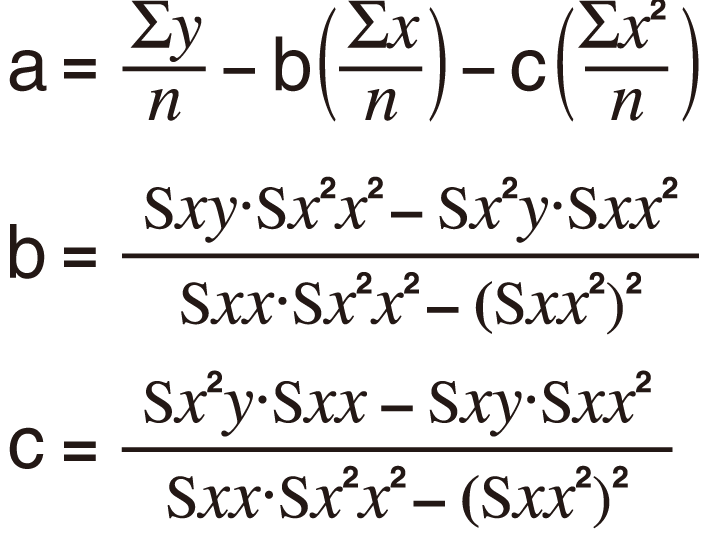
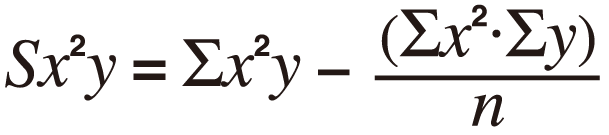
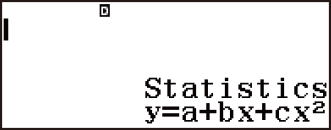
Quadratic Regression Calculation (y=a+bx+cx2) Commands
With quadratic regression, regression is performed in accordance with the following model equation.
y = a + bx + cx2
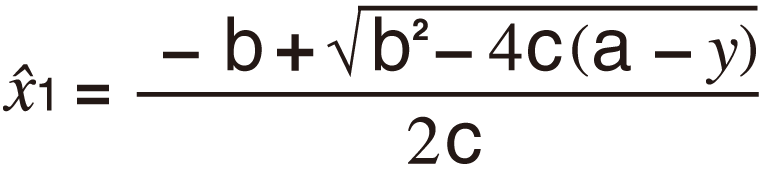
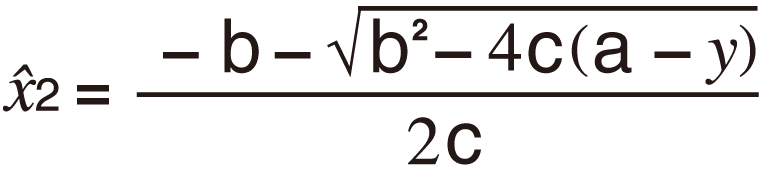
The following is the calculation formula used for each command.

Summation Sub-menu, Variable Sub-menu, and Min/Max Sub-menu operations are the same those for linear regression calculations.
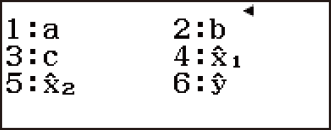
Regression Sub-menu ((Regression))
| Select this menu item: | When you want to obtain this: |
|---|---|
| (a) |
Regression coefficient constant term a |
| (b) |
Linear coefficient b of the regression coefficients |
| (c) |
Quadratic coefficient c of the regression coefficients |
| (xˆ1) |
Estimated value of x1 |
| (xˆ2) |
Estimated value of x2 |
| (yˆ) |
Estimated value of y |
Quadratic Regression Calculation Examples
Select quadratic regression and input the following data (Statistics: Off)
| x | y | x | y | |
| 1.0 | 1.0 | 2.1 | 1.5 | |
| 1.2 | 1.1 | 2.4 | 1.6 | |
| 1.5 | 1.2 | 2.5 | 1.7 | |
| 1.6 | 1.3 | 2.7 | 1.8 | |
| 1.9 | 1.4 | 3.0 | 2.0 |
- (Select Type)(y=a+bx+cx2)

- 11.21.51.61.9
2.12.42.52.73 
11.11.21.31.4
1.51.61.71.82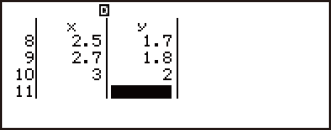
Display statistical values based on input data.
- (2-Variable Calc)
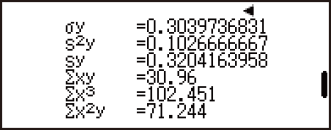

Display regression calculation results based on input data.
- (Regression Calc)
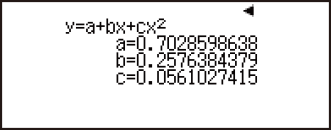
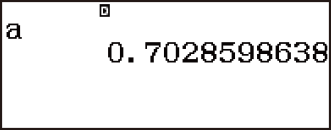
Calculate regression coefficient constant term a, linear coefficient b, and quadratic coefficient c.
- (Regression)

- (a)
- (Regression)
(b) 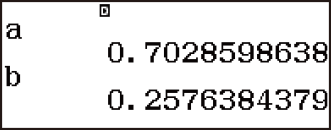
- (Regression)
(c) 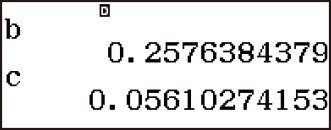
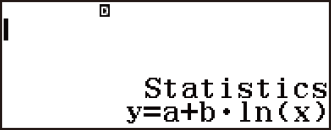
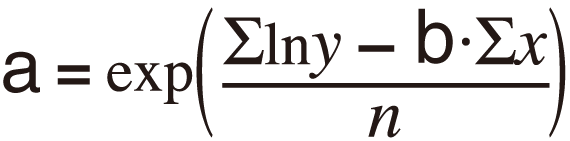
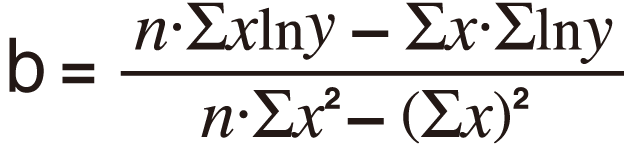
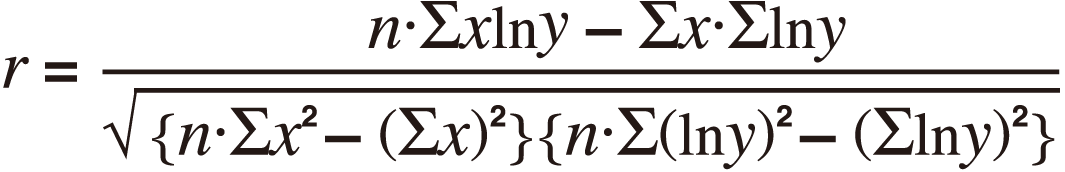
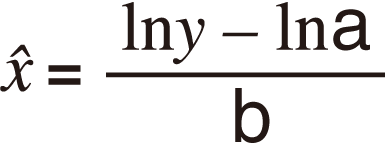
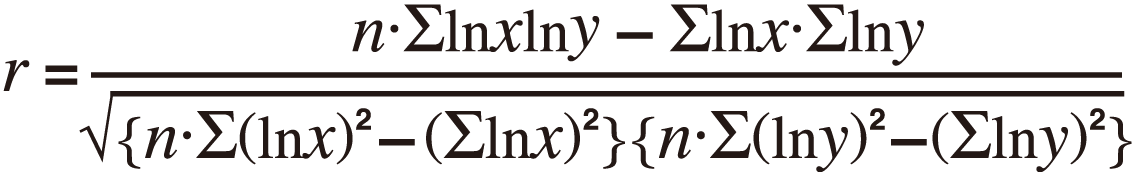
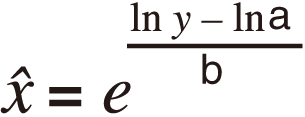
Logarithmic Regression Calculation (y=a+b・ln(x)) Commands
With logarithmic regression, regression is performed in accordance with the following model equation.
y = a + blnx
The following is the calculation formula used for each command.
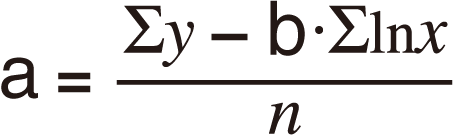
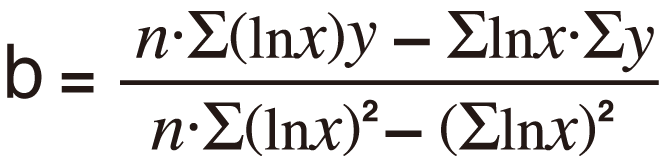
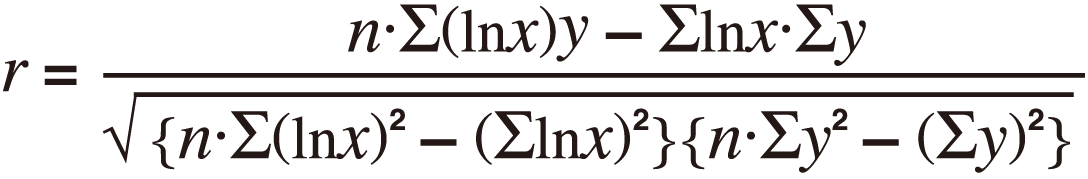

Summation Sub-menu, Variable Sub-menu, Min/Max Sub-menu, and Regression Sub-menu operations are the same those for linear regression calculations.
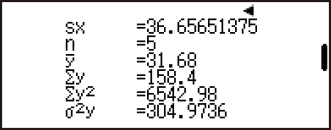
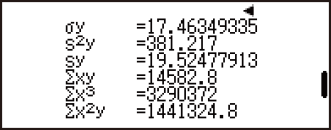
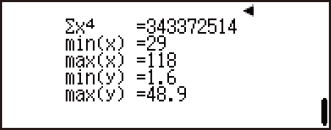
Logarithmic Regression Calculation Examples
Select logarithmic regression and input the following data (Statistics: Off)
| x | y |
| 29 | 1.6 |
| 50 | 23.5 |
| 74 | 38.0 |
| 103 | 46.4 |
| 118 | 48.9 |
- (Select Type)(y=a+b・ln(x))

- 295074103118
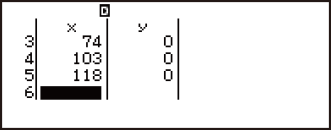
1.623.53846.448.9
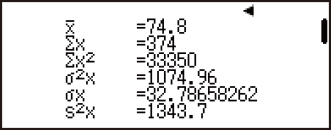
Display statistical values based on input data.
- (2-Variable Calc)
Display regression calculation results based on input data.
- (Regression Calc)
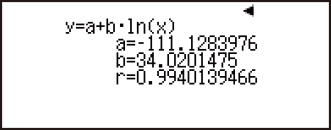
Calculate regression coefficient constant term a, regression coefficient b, and correlation coefficient r.
- (Regression)

- (a)
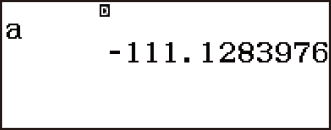
- (Regression)
(b) 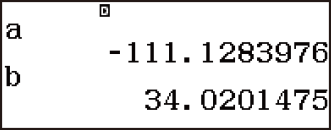
- (Regression)
(r) 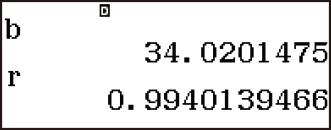
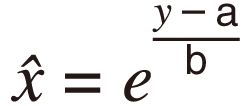
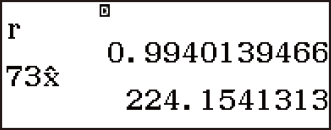
Calculate estimated values.
(y=73 → xˆ=?)
- 73(Regression)

- (xˆ)
(x=80 → yˆ=?)
- 80(Regression)
(yˆ) 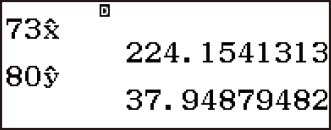
e Exponential Regression Calculation (y=a・e^(bx)) Commands
With e exponential regression, regression is performed in accordance with the following model equation.
y = aebx
The following is the calculation formula used for each command.

Summation Sub-menu, Variable Sub-menu, Min/Max Sub-menu, and Regression Sub-menu operations are the same those for linear regression calculations.
e Exponential Regression Calculation Examples
Select e exponential regression and input the following data (Statistics: Off)
| x | y |
| 6.9 | 21.4 |
| 12.9 | 15.7 |
| 19.8 | 12.1 |
| 26.7 | 8.5 |
| 35.1 | 5.2 |
- (Select Type)(y=a・e^(bx))

- 6.912.919.826.735.1
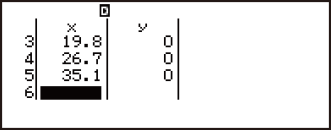
21.415.712.18.55.2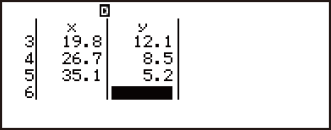
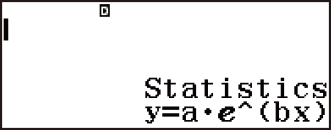
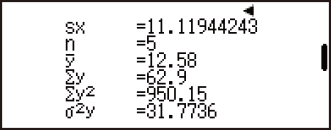
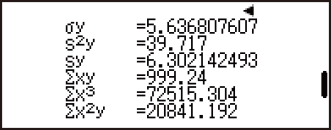
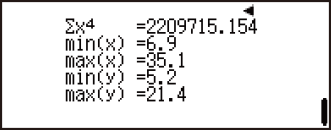
Display statistical values based on input data.
- (2-Variable Calc)
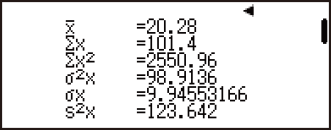
Display regression calculation results based on input data.
- (Regression Calc)
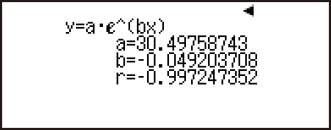
Calculate regression coefficient constant term a, regression coefficient b, and correlation coefficient r.
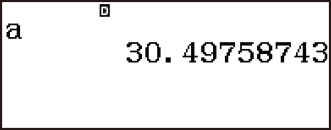
- (Regression)

- (a)
- (Regression)
(b) 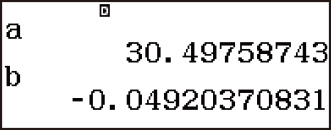
- (Regression)
(r) 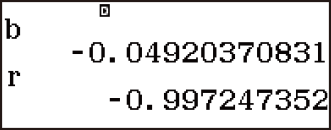
Calculate estimated values.
(y=20 → xˆ=?)
- 20(Regression)

- (xˆ)
(x=16 → yˆ=?)
- 16(Regression)
(yˆ) 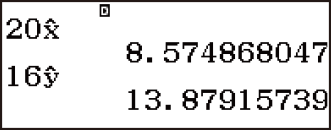
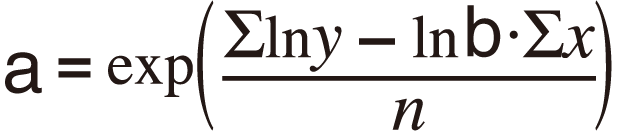
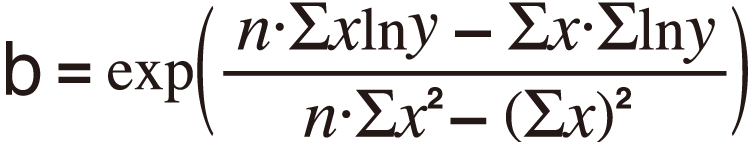
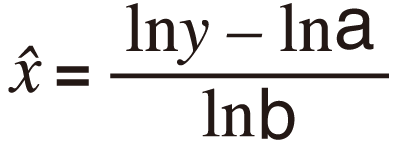
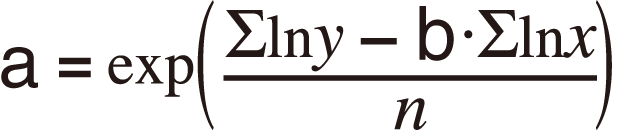
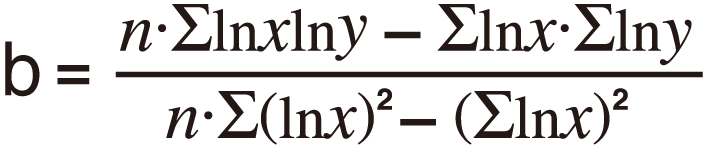
ab Exponential Regression Calculation (y=a・b^x) Commands
With ab exponential regression, regression is performed in accordance with the following model equation.
y = abx
The following is the calculation formula used for each command.

Summation Sub-menu, Variable Sub-menu, Min/Max Sub-menu, and Regression Sub-menu operations are the same those for linear regression calculations.
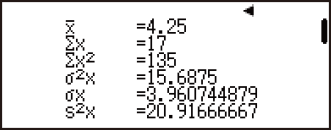
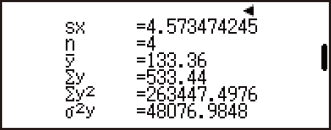
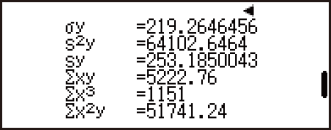
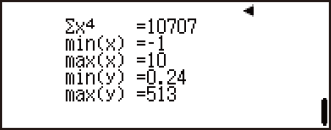
ab Exponential Regression Calculation Examples
Select ab exponential regression and input the following data (Statistics: Off)
| x | y |
| -1 | 0.24 |
| 3 | 4 |
| 5 | 16.2 |
| 10 | 513 |
- (Select Type)(y=a・b^x)

- 13510
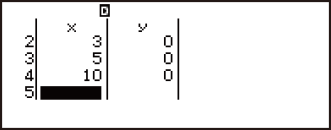
0.24416.2513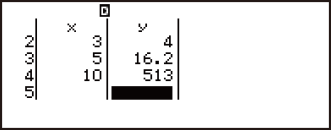
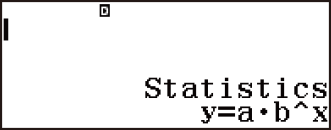
Display statistical values based on input data.
- (2-Variable Calc)
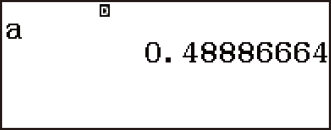
Display regression calculation results based on input data.
- (Regression Calc)
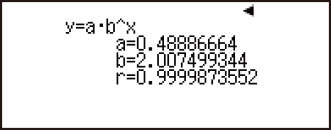
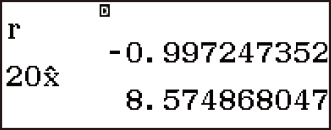
Calculate regression coefficient constant term a, regression coefficient b, and correlation coefficient r.
- (Regression)

- (a)
- (Regression)
(b) 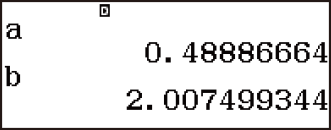
- (Regression)
(r) 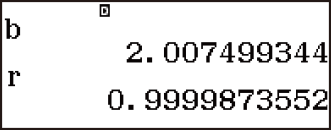
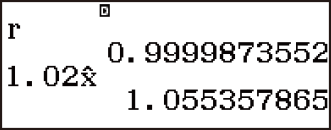
Calculate estimated values.
(y=1.02 → xˆ=?)
- 1.02(Regression)

- (xˆ)
(x=15 → yˆ=?)
- 15(Regression)
(yˆ) 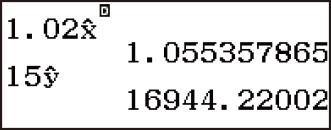
Power Regression Calculation (y=a・x^b) Commands
With power regression, regression is performed in accordance with the following model equation.
y = axb
The following is the calculation formula used for each command.

Summation Sub-menu, Variable Sub-menu, Min/Max Sub-menu, and Regression Sub-menu operations are the same those for linear regression calculations.
Power Regression Calculation Examples
Select power regression and input the following data (Statistics: Off)
| x | y |
| 28 | 2410 |
| 30 | 3033 |
| 33 | 3895 |
| 35 | 4491 |
| 38 | 5717 |
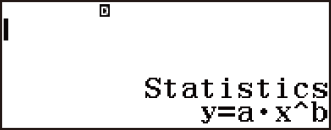
- (Select Type)(y=a・x^b)
- 2830333538
24103033389544915717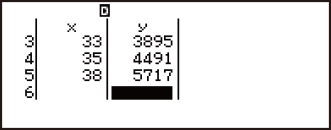
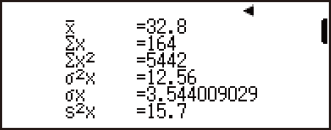
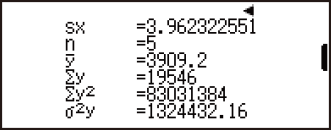
Display statistical values based on input data.
- (2-Variable Calc)
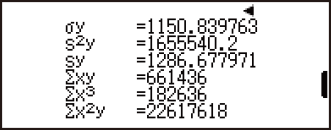
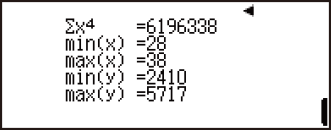
Display regression calculation results based on input data.
- (Regression Calc)
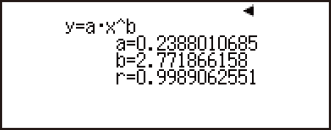
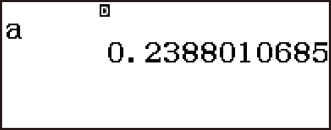
Calculate regression coefficient constant term a, regression coefficient b, and correlation coefficient r.
- (Regression)

- (a)
- (Regression)
(b) 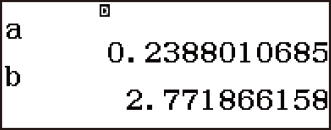
- (Regression)
(r) 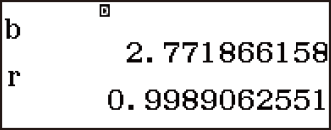
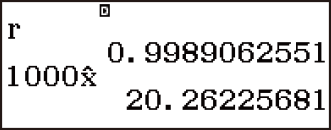
Calculate estimated values.
(y=1000 → xˆ=?)
- 1000(Regression)

- (xˆ)
(x=40 → yˆ=?)
- 40(Regression)
(yˆ) 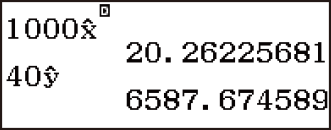
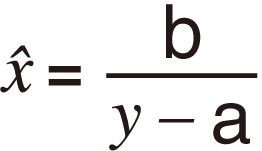
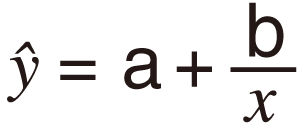
Inverse Regression Calculation (y=a+b/x) Commands
With inverse regression, regression is performed in accordance with the following model equation.
y = a + bx
The following is the calculation formula used for each command.
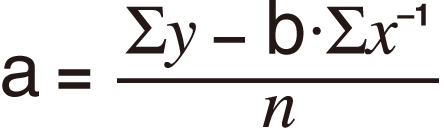
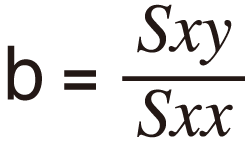

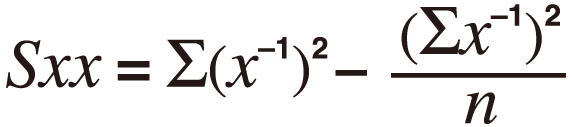
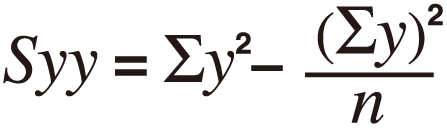

Summation Sub-menu, Variable Sub-menu, Min/Max Sub-menu, and Regression Sub-menu operations are the same those for linear regression calculations.
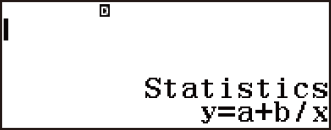
Inverse Regression Calculation Examples
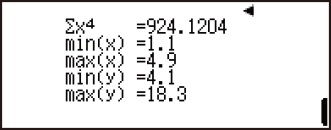
Select inverse regression and input the following data (Statistics: Off)
| x | y |
| 1.1 | 18.3 |
| 2.1 | 9.7 |
| 2.9 | 6.8 |
| 4.0 | 4.9 |
| 4.9 | 4.1 |
- (Select Type)(y=a+b/x)

- 1.12.12.944.9
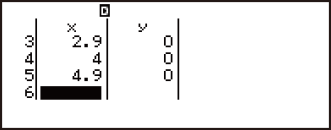
18.39.76.84.94.1
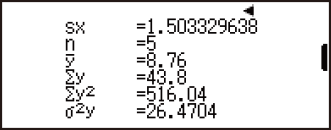
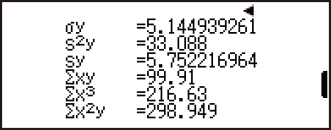
Display statistical values based on input data.
- (2-Variable Calc)
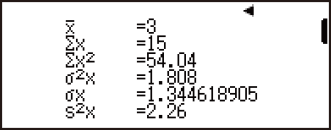
Display regression calculation results based on input data.
- (Regression Calc)
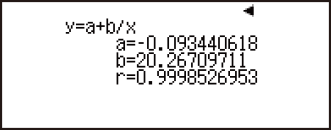
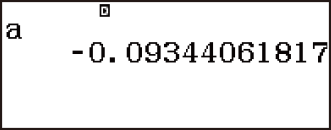
Calculate regression coefficient constant term a, regression coefficient b, and correlation coefficient r.
- (Regression)
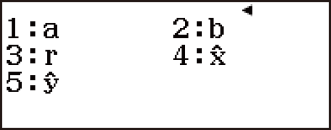
- (a)
- (Regression)
(b) 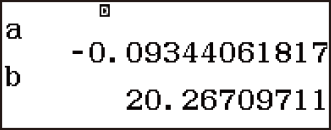
- (Regression)
(r) 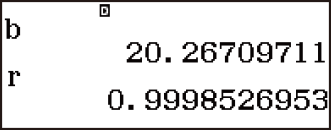
Calculate estimated values.
(y=15 → xˆ=?)
- 15(Regression)

- (xˆ)
(x=3.5 → yˆ=?)
- 3.5(Regression)
(yˆ)