Using Barometer
Barometer has a color display Barometer Screen (left), a color display Barometric Pressure Graph Screen (right), and a monochrome display.
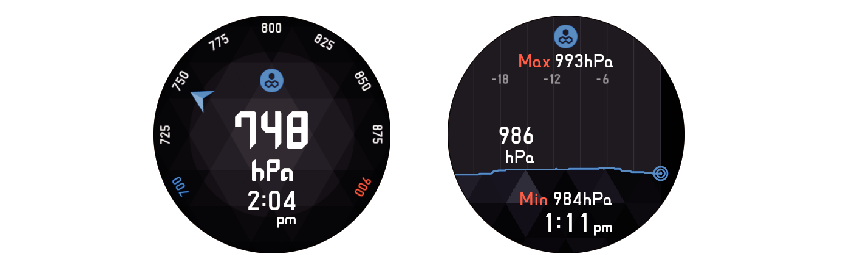
- All of the screens show the barometric pressure at your current location.
- The Barometric Pressure Graph Screen shows a graph of pressure changes over the past 24 hours, along with the low pressure (Min) and high pressure (Max) during that period.
- Your watch measures barometric pressure within the range of 260 to 1,100 hPa (or 7.6 to 32.5 inHg), in units of 1 hPa (or 0.1 inHg).
Calibrating Barometric Pressure Readings Manually
Though the pressure sensor built into the watch is adjusted at the factory and normally does not require calibration, you can perform the calibration operation above if you notice that readings are very different from those from other sources. After reading “Common Outdoor Function Settings”, perform the operation under “Barometric Pressure Calibration”.
Barometer Precautions
- The barometric pressure graph produced by this watch can be used to obtain an idea of upcoming weather conditions. Note that this graph provides only a rough idea of barometric pressure trends, and it is not intended for official weather predictions or reporting activities.
- Pressure sensor readings can be affected by sudden changes in temperature. Because of this, there may be some error in the readings produced by the watch.
 Top of page