Using Math Box
The Math Box app has the following learning support functions.
Dice Roll: Dice Roll is function that simulates dice probability.
Coin Toss: Coin Toss is a function that simulates coin toss probability.
Dice Roll
Dice Roll performs a simulation of one, two, or three virtual dice rolls a specified number of times. You can select either of the following screens for the result.
List screen
Relative Freq screen
Dice Roll General Operation Procedure
Example: To simulate 100 rolls of two dice. For this example, the Relative Freq screen is used for simulation results, showing the number of occurrences (frequencies) and relative frequencies of the numeric difference (0, 1, 2, 3, 4, 5) between the two dice each roll.
1. Press  , select the Math Box app icon, and then press
  .
.
This displays the Math Box menu.

2. Select [Dice Roll], and then press .
This displays the parameter input screen.
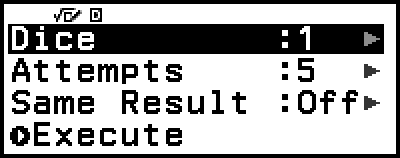
Dice: Select the number of dice as 1, 2, or 3.
Attempts: Input the number of dice rolls (number of trials) as a value from 1 to 250.
Same Result: This setting is normally Off (initial default setting). For details, see "Same Result Setting".
3. Select each of the menu settings and configure them the way you want.
(1) Select [Dice] and then press . On the menu that appears, select [2 Dice] and then press .
(2) Select [Attempts] and then press . On the input screen that appears, input 100 and then press . Select [Confirm] and then press .
(3) Leave the [Same Result] set to Off (initial default setting).
4. After all of the settings are the way you want, select [Execute] and then press .
The screen showing execution of the simulation will appear, and then the screen will change to the Result Type menu.
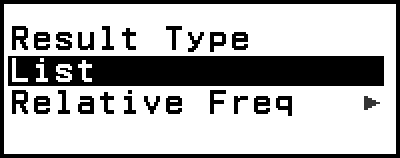
List: Shows a list of the outcome of each roll (trial).*1
Relative Freq: Shows the number of occurrences based on roll results*2 and their relative frequencies.
*1 When there are two dice, the outcome of each roll is displayed along with each roll’s sum and difference. When there are three dice, the outcome of each roll is displayed along with the sum of the roll.
*2 Outcome (1 through 6) in the case of one die, sum (2 through 12) or difference (0 through 5) of the outcomes in the case of two dice, and sum (3 through 18) of the outcomes in the case of three dice.
5. Use the Result Type menu to select a result display format.
(1) Here, we want to display the number of occurrences and relative frequencies, so select [Relative Freq] and then press .
This displays the [Sum] or [Difference] selection menu.
(2) Here, we want to display the difference in the outcome of each roll, so select [Difference] and then press .
The simulation result is displayed on the Relative Freq screen.
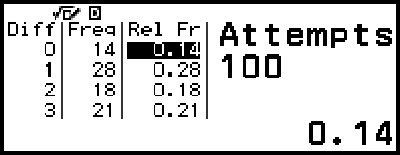
- (The result differs with each execution.)
For details about the simulation result screen, see "Dice Roll Result Screen".
6. To display results using a different format, display the result screen and then press  .
.
This returns to the Result Type menu, so you can repeat step 5 of this procedure and change the result display format.
7. If you want to perform a simulation with different settings, press while the Result Type menu is displayed.
This clears the simulation result and returns to the parameter input screen. Perform the procedure again from step 3.
8. To exit Dice Roll, press while the parameter input screen is displayed.
This returns to the Math Box menu.
Note
On the Relative Freq screen, you can store the value in a Rel Fr column cell to a variable. For example, performing the following operation in step 5, above, will store the value in the first row of the "Rel Fr" column to variable A:  – [A=] > [Store]. For details about variables, see "Variables (A, B, C, D, E, F, x, y, z)".
Dice Roll Result Screen
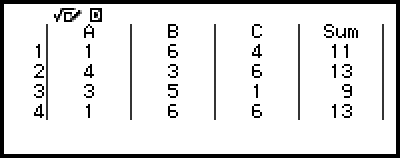
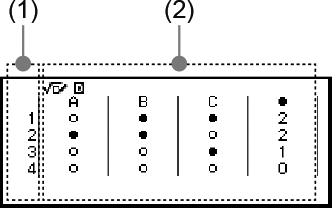
List screen
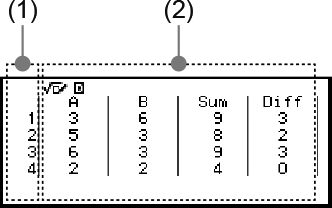
(1) Each row shows a sequential roll number. For example, 1 is the first roll, 2 is the second roll, and so on.
(2) A, B, and C indicate each of the die being used. "Sum" is for the outcome total, and "Diff" is for the difference between the outcomes of two dice. The columns that appear on the display depend on how many dice are being used.
1 die: A-column only.
2 dice: A, B, Sum, and Diff columns.
3 dice: A, B, C, and Sum columns.
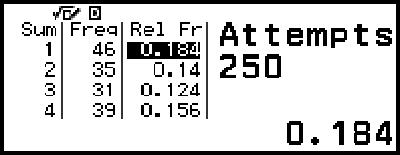
Relative Freq screen
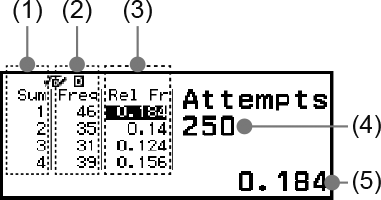
(1) Sum or Diff: Shows the one die outcome (Sum: 1 through 6), two dice outcome sum (Sum: 2 through 12) or difference (Diff: 0 through 5), or three dice outcome sum (Sum: 3 through 18).
(2) Freq: Shows the number of occurrences (frequency) of each roll outcome.
(3) Rel Fr: Shows the relative frequency (frequency divided by number of rolls) of roll results.
(4) Number of trials
(5) Highlighted Rel Fr cell’s value
Same Result Setting
When executing a Dice Roll or Coin Toss simulation with Same Result at its initial default setting (Off), each execution displays a different (random) result. If the Same Result setting is changed to something other than Off, the displayed results are those determined by the calculator. Using the #1, #2, or #3 setting is useful when you want the same result to be displayed by all the calculators being used by the students in a class.
Note
To have multiple calculators display the same result, make sure that the settings below are identical on all of the calculators.
- Number of dice or coins
- Number of trials (rolls or tosses)
- Same Result setting (#1, #2, or #3)
Coin Toss
Coin Toss performs a simulation of one, two, or three virtual coin tosses a specified number of times. You can select either of the following screens for the result.
List screen
Relative Freq screen
The screen shows heads as  and tails as
  .
.
Coin Toss General Operation Procedure
Example: To simulate 100 tosses of three coins. For this example, the Relative Freq screen is used for simulation results, showing the number of heads (0, 1, 2, 3) and the relative frequencies of heads of each toss.
1. Press , select the Math Box app icon, and then press .
This displays the Math Box menu.

2. Select [Coin Toss], and then press .
This displays the parameter input screen.
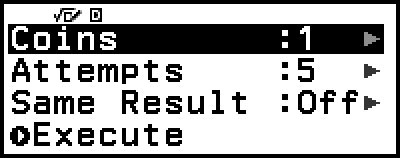
Coins: Select the number of coins as 1, 2, or 3.
Attempts: Input the number of coin tosses (number of trials) as a value from 1 to 250.
Same Result: This setting is normally Off (initial default setting). For details, see "Same Result Setting".
3. Select each of the menu settings and configure them the way you want.
(1) Select [Coins] and then press . On the menu that appears, select [3 Coins] and then press .
(2) Select [Attempts] and then press . When the input screen appears, input 100 and then press . Select [Confirm] and then press .
(3) Leave the [Same Result] set to Off (initial default setting).
4. After all of the settings are the way you want, select [Execute] and then press .
The screen showing execution of the simulation will appear, and then the screen will change to the Result Type menu.
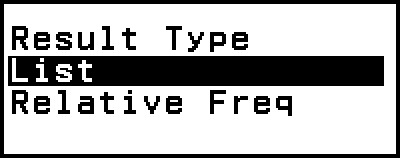
List: Shows a list of heads or tails*1 for each toss (trial).
Relative Freq: Shows the number of occurrences for each coin that comes up heads,*2 and their relative frequencies.
*1 When there are two or three coins, shows the number of coins of each toss that come up heads.
*2 For two or three coins. When there is one coin, this shows the frequencies of heads and tails and the relative frequencies.
5. Use the Result Type menu to select a result display format.
Here we want to display the number of occurrences and relative frequencies, so select [Relative Freq] and then press .
The simulation result is shown on the Relative Freq screen.
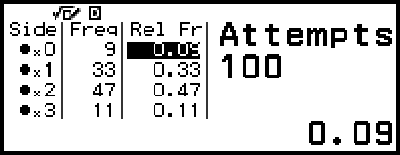
- (The result differs with each execution.)
For details about the simulation result screen, see "Coin Toss Result Screen".
6. To display results using a different format, display the result screen and then press .
This returns to the Result Type menu, so you can repeat step 5 of this procedure and change the result display format.
7. If you want to perform a simulation with different settings, press while the Result Type menu is displayed.
This clears the simulation result and returns to the parameter input screen. Perform the procedure again from step 3.
8. To exit Coin Toss, press while the parameter input screen is displayed.
This returns to the Math Box menu.
Note
On the Relative Freq screen, you can store the value in a Rel Fr column cell to a variable. For example, performing the following operation in step 5, above, will store the value in the first row of the "Rel Fr" column to variable A: – [A=] > [Store].
Coin Toss Result Screen
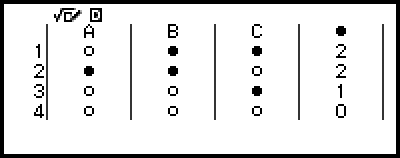
List screen
(1) Each row shows a sequential toss number. For example, 1 is the first toss, 2 is the second toss, and so on.
(2) A, B, and C indicate each of the coins being used. When two coins or three coins are being used, the column on the right shows the number of coins that came up heads.
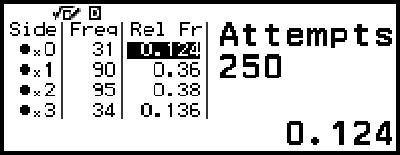
Relative Freq screen
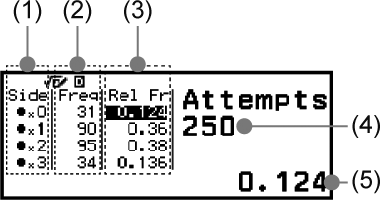
(1) Side: When using only one coin, "" indicates heads while "" indicates tails. When using two or three coins, this column shows the number of heads (0 to 3).
(2) Freq: Shows the number of occurrences (frequency) of each toss outcome.
(3) Rel Fr: Shows the relative frequency (frequency divided by number of tosses) of toss results.
(4) Number of trials
(5) Highlighted Rel Fr cell’s value