fx-300ES PLUS
(2nd edition / NATURAL-V.P.A.M.)
Before Using the Calculator
Calculation Modes and Calculator Setup
Inputting Expressions and Values
- ▶Basic Input Rules
- ▶Inputting with Natural Display
- ▶√ Form Calculation Range
- ▶Using Values and Expressions as Arguments (Natural Display only)
- ▶Overwrite Input Mode (Linear Display only)
- ▶Correcting and Clearing an Expression
Basic Calculations
- ▶Toggling Calculation Results
- ▶Fraction Calculations
- ▶Percent Calculations
- ▶Degree, Minute, Second (Sexagesimal) Calculations
- ▶Multi-Statements
- ▶Using Engineering Notation
- ▶Remainder Calculations
- ▶Recurring Decimal Calculations
- ▶Prime Factrization
- ▶Calculation History and Replay
- ▶Using Memory Functions
Function Calculations
- ▶Pi (π), Natural Logarithm Base e
- ▶Trigonometric Functions
- ▶Hyperbolic Functions
- ▶Angle Unit Conversion
- ▶Exponential Functions
- ▶Logarithmic Functions
- ▶Power Functions and Power Root Functions
- ▶Rectangular-Polar Coordinate Conversion
- ▶Factorial Function (!)
- ▶Absolute Value Function (Abs)
- ▶Random Number (Ran#)
- ▶Random Integer (RanInt#)
- ▶Permutation (nPr) and Combination (nCr)
- ▶Rounding Function (Rnd)
- ▶Greatest Common Divisor (GCD) and Least Common Multiple (LCM)
- ▶Integer Part of a Value (Int) and Largest Integer that does not Exceed a Value (Intg)
Using Calculation Modes
Technical Information
- ▶Errors
- ▶Before Assuming Malfunction of the Calculator...
- ▶Replacing the Battery
- ▶Calculation Priority Sequence
- ▶Calculation Ranges, Number of Digits, and Precision
- ▶Specifications
- ▶Verifying the Authenticity of Your Calculator
Frequently Asked Questions
Statistical Calculations (STAT)
To start a statistical calculation, perform the key operation 
 (STAT) to enter the STAT Mode and then use the screen that appears to select the type of calculation you want to perform.
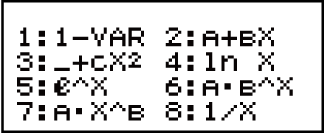
To select this type of statistical calculation: (Regression formula shown in parentheses) |
Press this key: |
|---|---|
| Single-variable (X) |  (1-VAR) (1-VAR) |
| Paired-variable (X, Y), linear regression (y = A + Bx) |
(A+BX) |
| Paired-variable (X, Y), quadratic regression (y = A + Bx + Cx2) |
 (_+CX2) (_+CX2) |
| Paired-variable (X, Y), logarithmic regression (y = A + Blnx) |
 (ln X) (ln X) |
| Paired-variable (X, Y), e exponential regression (y = A eBx) |
 (e∧X) (e∧X) |
| Paired-variable (X, Y), ab exponential regression (y = ABx) |
 (A•B∧X) (A•B∧X) |
| Paired-variable (X, Y), power regression (y = AxB) |
 (A•X∧B) (A•X∧B) |
| Paired-variable (X, Y), inverse regression (y = A + B/x) |
 (1/X) (1/X) |
Pressing any of the above keys ( to ) displays the Statistics Editor.
Note
When you want to change the calculation type after entering the STAT Mode, perform the key operation  (STAT)(Type) to display the calculation type selection screen.
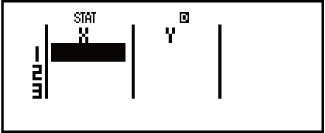
Inputting Data
Use the Statistics Editor to input data. Perform the following key operation to display the Statistics Editor: (STAT)(Data).
The Statistics Editor provides 40 rows for data input when there is an X column only or when there are X and Y columns, 20 rows when there are X and FREQ columns, or 26 rows when there are X, Y, and FREQ columns.
Note
Use the FREQ (frequency) column to input the quantity (frequency) of identical data items. Display of the FREQ column can be turned on (displayed) or off (not displayed) using the Stat Format setting on the setup menu.
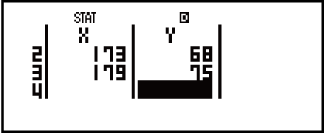
Example 1: To select linear regression and input the following data: (170, 66), (173, 68), (179, 75)
- (STAT)(A+BX)
- 170
 173179

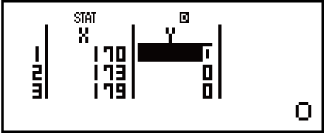
- 666875
Important!
All data currently input in the Statistics Editor is deleted whenever you exit the STAT Mode, switch between the single-variable and a paired-variable statistical calculation type, or change the Stat Format setting on the setup menu.
The following operations are not supported by the Statistics Editor:  , (M-),
  (STO). Pol, Rec, ÷R, and multi-statements also cannot be input with the Statistics Editor.
To change the data in a cell:
In the Statistics Editor, move the cursor to the cell that contains the data you want to change, input the new data, and then press .
To delete a line:
In the Statistics Editor, move the cursor to the line that you want to delete and then press  .
.
To insert a line:
In the Statistics Editor, move the cursor to the location where you want to insert the line and then perform the following key operation:
(STAT)(Edit)(Ins).
To delete all Statistics Editor contents:
In the Statistics Editor, perform the following key operation:
(STAT)(Edit)(Del-A).
Statistics Calculation Screen
The Statistics Calculation Screen is for performing statistical calculations with the data you input with the Statistics Editor. Pressing the  key while the Statistics Editor is displayed switches to the Statistics Calculation Screen.
Using the Statistics Menu
While the Statistics Calculation Screen is on the display, press (STAT) to display the Statistics Menu.
The content to the Statistics Menu depends on whether the currently selected statistical operation type uses a single variable or paired variables.
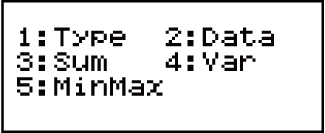
Single-variable Statistics
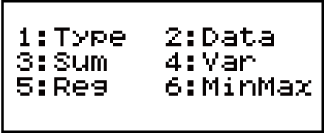
Paired-variables Statistics
Statistics Menu Items
Common Items
| Select this menu item: | When you want to obtain this: |
|---|---|
| (Type) |
Display the calculation type selection screen |
| (Data) |
Display the Statistics Editor |
| (Sum) |
Display the Sum sub-menu of commands for calculating sums |
| (Var) |
Display the Var sub-menu of commands for calculating the mean, standard deviation, etc. |
| Single-variable: (MinMax) Paired-variable: (MinMax)
|
Display the MinMax sub-menu of commands for obtaining maximum and minimum values |
Single-variable (1-VAR) Statistical Calculation Commands
Sum Sub-menu ((STAT)(Sum))
| Select this menu item: | When you want to obtain this: |
|---|---|
| (∑x2) |
Sum of squares of the sample data |
| (∑x) |
Sum of the sample data |
Var Sub-menu ((STAT)(Var))
| Select this menu item: | When you want to obtain this: |
|---|---|
| (n) |
Number of samples |
| (x) |
Mean of the sample data |
| (σx) |
Population standard deviation |
| (sx) |
Sample standard deviation |
MinMax Sub-menu ((STAT)(MinMax))
| Select this menu item: | When you want to obtain this: |
|---|---|
| (minX) |
Minimum value |
| (maxX) |
Maximum value |
| (Q1) |
First quartile |
| (med) |
Median |
| (Q3) |
Third quartile |
Commands when Linear Regression Calculation (A+BX) Is Selected
Sum Sub-menu ((STAT)(Sum))
| Select this menu item: | When you want to obtain this: |
|---|---|
| (∑x2) |
Sum of squares of the X-data |
| (∑x) |
Sum of the X-data |
| (∑y2) |
Sum of squares of the Y-data |
| (∑y) |
Sum of the Y-data |
| (∑xy) |
Sum of products of the X-data and Y-data |
| (∑x3) |
Sum of cubes of the X-data |
| (∑x2y) |
Sum of (X-data squares × Y-data) |
| (∑x4) |
Sum of biquadrate of the X-data |
Var Sub-menu ((STAT)(Var))
| Select this menu item: | When you want to obtain this: |
|---|---|
| (n) |
Number of samples |
| (x) |
Mean of the X-data |
| (σx) |
Population standard deviation of the X-data |
| (sx) |
Sample standard deviation of the X-data |
| (y) |
Mean of the Y-data |
| (σy) |
Population standard deviation of the Y-data |
| (sy) |
Sample standard deviation of the Y-data |
Reg Sub-menu ((STAT)(Reg))
| Select this menu item: | When you want to obtain this: |
|---|---|
| (A) |
Regression coefficient constant term A |
| (B) |
Regression coefficient B |
| (r) |
Correlation coefficient r |
| (xˆ) |
Estimated value of X |
| (yˆ) |
Estimated value of Y |
MinMax Sub-menu ((STAT)(MinMax))
| Select this menu item: | When you want to obtain this: |
|---|---|
| (minX) |
Minimum value of the X-data |
| (maxX) |
Maximum value of the X-data |
| (minY) |
Minimum value of the Y-data |
| (maxY) |
Maximum value of the Y-data |
Commands when Quadratic Regression Calculation (_+CX2) Is Selected
Reg Sub-menu ((STAT)(Reg))
| Select this menu item: | When you want to obtain this: |
|---|---|
| (A) |
Regression coefficient constant term A |
| (B) |
Linear coefficient B of the regression coefficients |
| (C) |
Quadratic coefficient C of the regression coefficients |
| (xˆ1) |
Estimated value of x1 |
| (xˆ2) |
Estimated value of x2 |
| (yˆ) |
Estimated value of y |
Note
xˆ, xˆ1, xˆ2 and yˆ are not variables. They are commands of the type that take an argument immediately before them. See "Calculating Estimated Values" for more information.
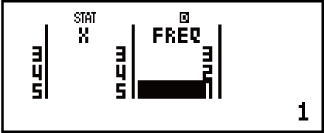
Example 2: To input the single-variable data x = {1, 2, 2, 3, 3, 3, 4, 4, 5}, using the FREQ column to specify the number of repeats for each items ({xn; freqn} = {1;1, 2;2, 3;3, 4;2, 5;1}), and calculate the mean and population standard deviation.
- (SETUP)(STAT)(ON)
(STAT)(1-VAR)
12345
1232
- (STAT)(Var)(x)
- 3
- (STAT)(Var)(σx)
- 1.154700538
Results: Mean: 3, Population Standard Deviation: 1.154700538
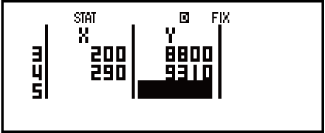
Example 3: To calculate the linear regression and logarithmic regression correlation coefficients for the following paired-variable data and determine the regression formula for the strongest correlation: (x, y) = (20, 3150), (110, 7310), (200, 8800), (290, 9310). Specify Fix 3 (three decimal places) for results.
- (SETUP)(STAT)(OFF)
(SETUP)(Fix)
(STAT)(A+BX)
20110200290
3150731088009310
- (STAT)(Reg)(r)
- 0.923
- (STAT)(Type)(ln X)
(STAT)(Reg)(r) - 0.998
- (STAT)(Reg)(A)
- -3857.984
- (STAT)(Reg)(B)
- 2357.532
Results: Linear Regression Correlation Coefficient: 0.923
Logarithmic Regression Correlation Coefficient: 0.998
Logarithmic Regression Formula: y = -3857.984 + 2357.532lnx
Calculating Estimated Values
Based on the regression formula obtained by paired-variable statistical calculation, the estimated value of y can be calculated for a given x-value.
The corresponding x-value (two values, x1 and x2, in the case of quadratic regression) also can be calculated for a value of y in the regression formula.
Example 4: To determine the estimate value for x when y = -130 in the regression formula produced by logarithmic regression of the data in Example 3. Specify Fix 3 for the result. (Perform the following operation after completing the operations in Example 3.)
 130(STAT)(Reg)(xˆ)
- 4.861
Important!
Regression coefficient, correlation coefficient, and estimated value calculations can take considerable time when there are a large number of data items.