Module No. 3513
Checking Changes in Barometric Pressure Over Time
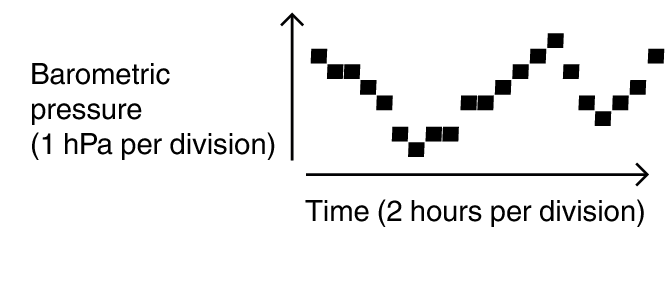
Your watch shows a graph of barometric pressure readings taken at two-hour intervals. You can view barometric pressure readings for the past 42 hours. The square ( ) at the far right of the graph indicates the latest barometric pressure reading.
Predicting Upcoming Weather
|
A trend like this: |
Means this: |
|---|---|
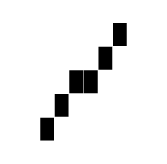 |
Rising barometric pressure, which indicates that upcoming weather probably will be fair. |
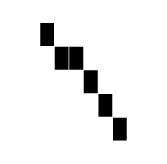 |
Falling barometric pressure, which indicates that upcoming weather probably will be bad. |
Note
Large changes in barometric pressure and/or temperature can cause past data readings to be plotted outside of the visible area of the graph. Though plots are not visible, the data is still maintained in watch memory.