Module No. 5682
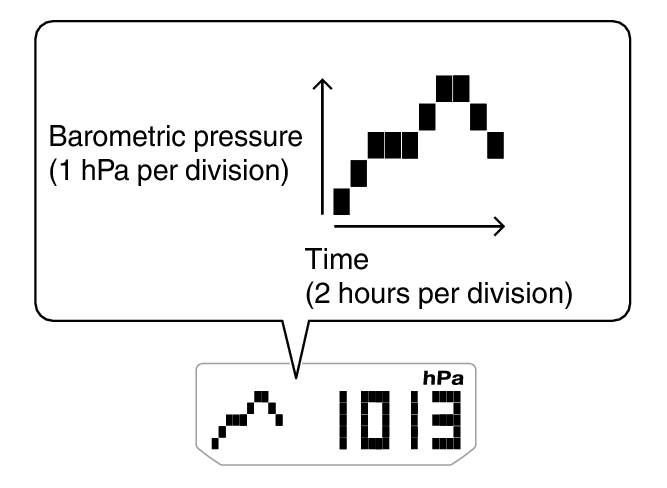
Checking Changes in Barometric Pressure Over Time
The watch displays a graph of 20 hours of barometric pressure readings taken every two hours. The square ( ) at the far right of the graph indicates the latest barometric pressure reading.
Predicting Upcoming Weather
|
A trend like this: |
Means this: |
|---|---|
 |
Rising barometric pressure, which indicates that upcoming weather probably will be fair. |
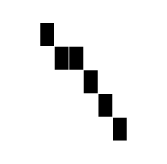 |
Falling barometric pressure, which indicates that upcoming weather probably will be bad. |
Note
Large changes in barometric pressure and/or temperature can cause past data readings to be plotted outside of the visible area of the graph. Though plots are not visible, the data is still maintained in watch memory.
The barometric pressure graph is not displayed while Barometric Pressure Change Indications are displayed.