Using My Graph
My Graph shows the status of your activities for the current day.
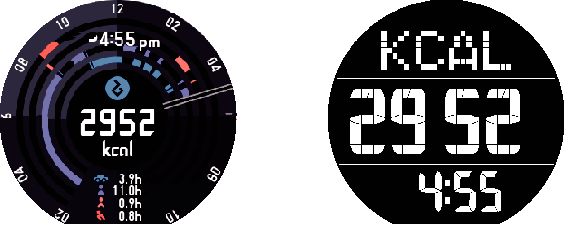
- Under initial default settings, both screens show how many calories you have burned from the start (00:00) of the current day.
- A color display shows what types of activities you have performed on the current day as a concentric circle graph. Values at the bottom of the screen show the cumulative times spent engaged in each type of activity (
 : Riding,
  : Resting,
  : Walking,
  : Running).
- You can hide the current time and cumulative activity times by tapping the touch screen of the color display. Tap the touch screen again to show the times.
Before Using My Graph
My Graph cannot be displayed under the watch’s initial default configuration. To display it, you need to change the “Save daily activity records” setting to “ON”. For more accurate burned calorie calculation, you need to input the following information: height, weight, wrist where you wear the watch. After reading “Common Outdoor Function Settings”, configure the following settings: “Save daily activity records”, “Height”, “Weight”, “Wrist where you wear the watch”.
To specify the type of values shown in the center of the My Graph screen
-
1.Swipe the touch screen from right to left. On the “Settings” Screen that appears, tap
 . This displays the setting menu.
 -
2.Scroll the setting menu upwards and downwards. When “Centered value / My Graph” is displayed, tap it. This displays a list of value types.
-
3.Scroll the list upwards and downwards. When the type of value you want shown in the center of the My Graph Screen is displayed, tap it.
 Top of page