
CARDIO LOAD STATUS
Cardio Load
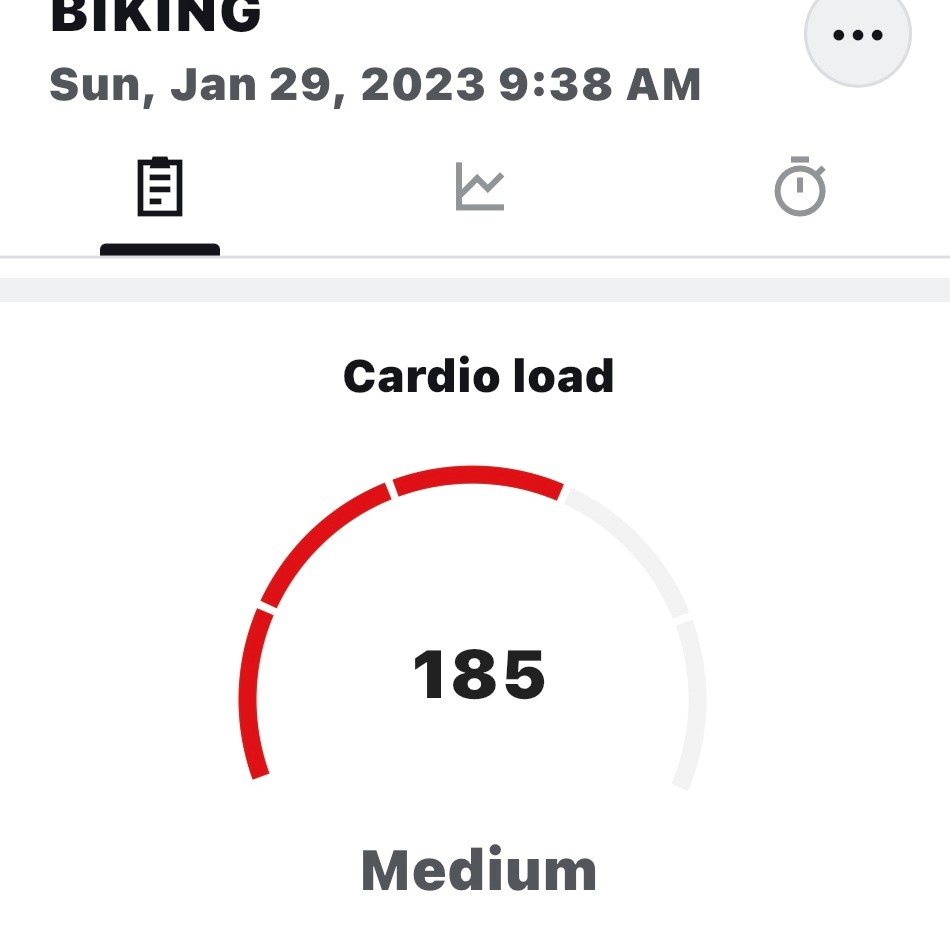
Cardio Load measures your cardiac response to a training session, or in other words how much strain a training session put on your cardiovascular system. Your Cardio Load is shown as training impulse (TRIMP), a commonly accepted method to quantify training load. TRIMP is calculated after every workout from your heart rate and session duration, and it’s affected by your physical settings, resting and maximal heart rate, and gender.
It takes into account the duration and intensity of the session and can be calculated for all sports from which heart rate data is available. Typical values for a 60-minute training session range from 70 to 130
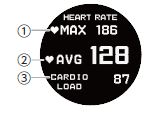
① Maxim Heart Rate
② Average Heart Rate
③ Cardio Load
The numbers show the absolute calculated Cardio values for each session. The verbal descriptions and bullets are adaptive, showing how hard a training session was compared to your session average from the past 90 days.
Cardio Load Status
Your Cardio Load Status looks at how your Strain compares to your Tolerance and shows how your training is impacting your body. Following your Cardio Load Status helps you keep your total training volume in control in in the short and long-term
When you start following your Cardio Load Status, you need to gather data for a while to build up your personal baseline for analysis before we can give you accurate feedback on your status. You need a certain amount of training history before your strain and tolerance can be determined reliably. This why you won’t see all of the available information right away. It takes some weeks to establish a baseline. Before we can give accurate feedback, you’ll see an estimate.
Strain and tolerance
When monitoring your short and long-term training load which is calculated from your Cardio Load, Training Load Pro uses parameters called Strain and Tolerance.
Strain shows how much you have strained yourself with training lately. It shows your average daily load from the past 7 days.
Tolerance describes how prepared you are to endure cardio training. It shows your average daily load from the past 28 days. To improve your tolerance for cardio training, slowly increase your training over a longer period of time. The higher your tolerance is, more training you can handle.
Cardio Load Status
Your Cardio Load Status looks at how your Strain compares to your Tolerance and estimates how your training is impacting your body. It’s estimated by comparing your average daily load from the past seven days (Strain) to your past month’s training (Tolerance). So, the numeric value for Cardio Load status is Strain divided by Tolerance.
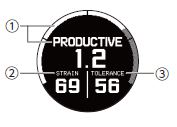
① Cardio Load Status
② Strain
③ Tolerance
Cardio Load Status graph
The graph shows your current Cardio Load Status at a glance.
Cardio Load Status based on strain-to-tolerance ratio
Your current Cardio Load Status and the correponding strain-to-tolerance ratio
Detraining – ratio below 0.8
Maintaining – ratio between 0.8 – 1.0
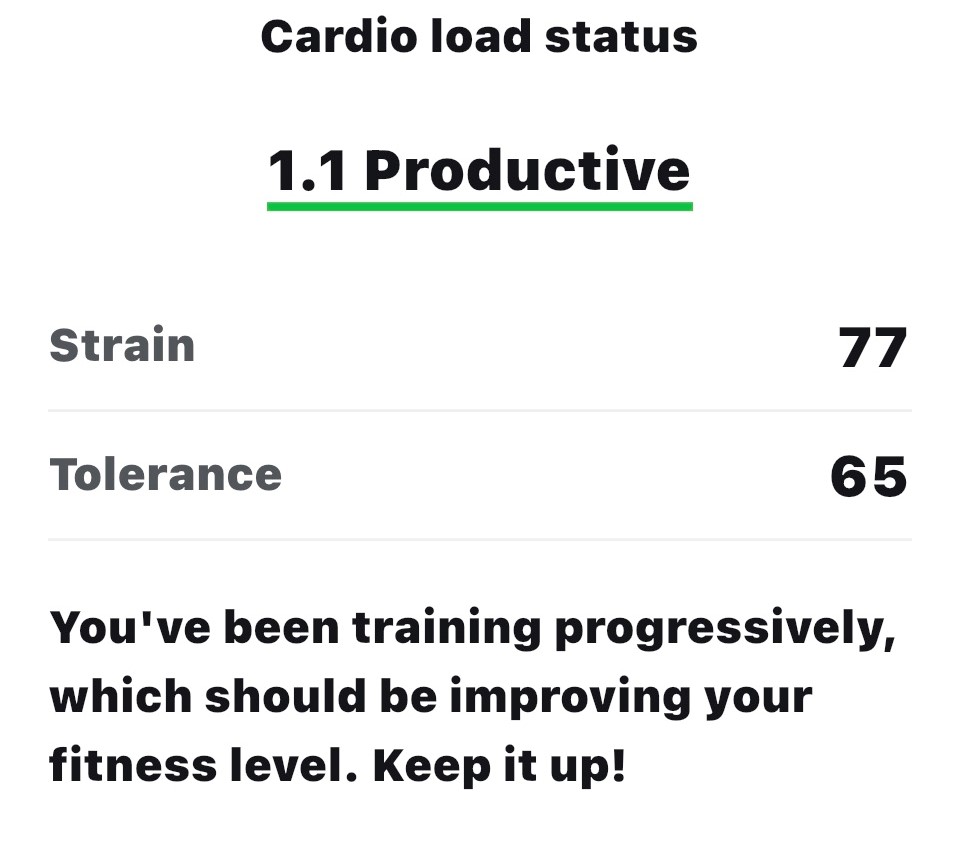
Productive - ratio between 1.0 -1.3
Overreaching – ratio over 1.3
Cardio Load Status feedback
Your status with verbal feedback about your current state.
- Detraining: You’ve been training less than usual. If you keep this up, your fitness level will start going down.
- Maintaining: You’ve been training less than usual, but just enough to maintain your fitness level. If you keep this up for long, detraining will occur.
- Productive: You’ve been training progressively, which should be improving your fitness level. Keep it up!
- Overreaching: You’ve been training much more than usual during the last few days. If you keep this up for long, your risk for sports related injuries will increase and your training may become counterproductive.
Source: Polar Research
Polar science