Statistical Calculations
The Statistics app calculates various statistical values based on single-variable (x) or paired-variable (x, y) data.
General Procedure for Performing a Statistical Calculation
1. Press  , select the Statistics app icon, and then press
  .
.
2. On the menu that appears, select [1-Variable] (single-variable) or [2-Variable] (paired-variable), and then press .
This displays the Statistics Editor.

Single-variable

Paired-variable
3. Display the Freq (frequency) column as needed.
For details, see "Freq (Frequency) Column".
4. Input data.
For details, see "Inputting Data with Statistics Editor".
5. After you finish inputting data, press .
This causes the menu below to appear.

Single-variable
Paired-variable
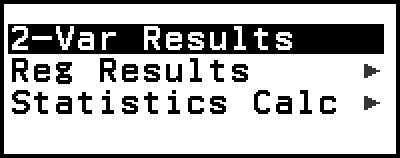
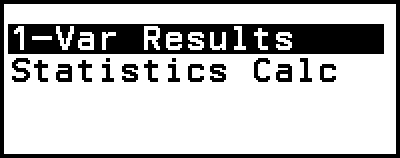
6. Select the menu item for the operation you want to perform.
Select [1-Var Results], [2-Var Results], or [Reg Results] to see a list of calculation results based on the data you entered. For details, see "Displaying Statistical Calculation Results".
To display a statistical calculation screen for performing calculations based on the input data, select [Statistics Calc]. For details, see "Using Statistical Calculation Screen".
Note
To return to the Statistics Editor from a statistical calculation screen, press  and then
  .
.
Inputting Data with Statistics Editor
Statistics Editor displays one, two, or three columns: single-variable (x), single-variable and frequency (x, Freq), paired-variable (x, y), paired-variable and frequency (x, y, Freq). The number of data rows that can be input depends on the number of columns: 160 rows for one column, 80 rows for two columns, 53 rows for three columns.
Important!
All data currently input in the Statistics Editor is deleted whenever you perform any of the operations below.
- Switching the statistical calculation type between single-variable and paired-variable
- Changing the Frequency setting on the TOOLS menu
Statistical calculations can take considerable time when there are a large number of data items.
Freq (Frequency) Column
If you turn on the Frequency setting on the TOOLS menu, a column labeled "Freq" will also be included on the Statistics Editor. You can use the Freq column to specify the frequency (the number of times the same sample appears in the data group) of each sample value.
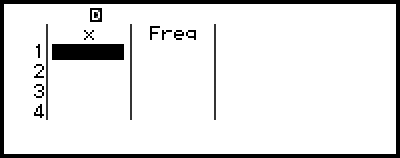
Single-variable
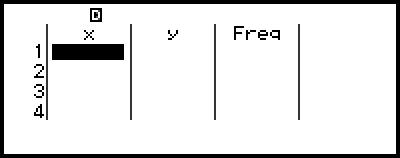
Paired-variable
To display the Freq column
1. While the Statistics Editor is displayed, press  and then select [Frequency] > [On].
2. Press to return to the Statistics Editor.
To hide the Freq column
1. While the Statistics Editor is displayed, press and then select [Frequency] > [Off].
2. Press to return to the Statistics Editor.
Rules for Inputting Sample Data on the Statistics Editor
Data you input is inserted into the cell where the cursor is located. Use the cursor keys to move the cursor between cells.
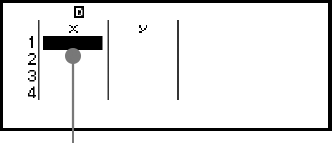
- Cursor
After inputting a value, press  . This registers the value and displays up to six of its digits in the cell.
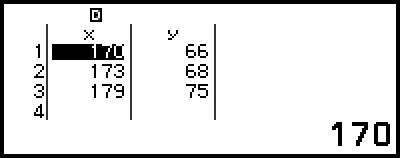
Example 1: To select paired-variable and input the following data: (170, 66), (179, 75), (173, 68)
1. Press , select the Statistics app icon, and then press .
2. Select [2-Variable], and then press .

3. Use the operation below to input data.
- 170179173


667568 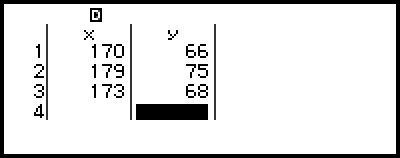
Note
On the Statistics Editor, you can store the value in a cell to a variable. For example, performing the following operation while the screen in step 3 is displayed above will store 68 to variable A: 
 – [A=] > [Store]. For details about variables, see "Variables (A, B, C, D, E, F, x, y, z)".
Editing Sample Data
To replace the data in a cell
On the Statistics Editor, move the cursor to the cell containing the data you want to edit, input the new data, and then press .
To delete a row
On the Statistics Editor, move the cursor to the row you want to delete and then press  .
.
To insert a row
1. On the Statistics Editor, move the cursor to the row that will be under the row you will insert.
2. Perform the following operation: – [Edit] > [Insert Row].
To delete all Statistics Editor contents
On the Statistics Editor, perform the following operation: – [Edit] > [Delete All].
Sorting Data
You can sort Statistics Editor data in ascending or descending order on its x, y, or Freq-column values.
Important!
Note that after you change the data sort sequence, you will not be able to return it to its original sequence.
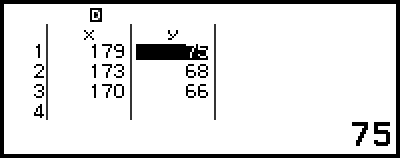
Example 2: To sort the data input in Example 1 in ascending order on the x column, and then in descending order on the y column
1. Use the procedure in Example 1 to input the data.

2. Sort the data in ascending order on the x column.
- – [Sort] > [x Ascending]
3. Sort the data in descending order on the y column.
- – [Sort] > [y Descending]
Displaying Statistical Calculation Results
Displaying Single-Variable Statistical Calculation Results
The 1-Var Results screen shows a list of various statistical values (such as mean and population standard deviation) calculated based on single-variable data. This section describes the operation required to display the 1-Var Results screen.
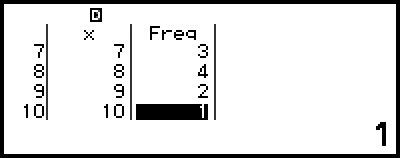
Example 3: To input the data below and display single-variable statistical calculation results
| x | 1 | 2 | 3 | 4 | 5 | 6 | 7 | 8 | 9 | 10 |
| Freq | 1 | 2 | 1 | 2 | 2 | 2 | 3 | 4 | 2 | 1 |
1. Press , select the Statistics app icon, and then press .
2. Select [1-Variable], and then press .
This displays the Statistics Editor.
3. Press and then select [Frequency] > [On].
Press to return to the Statistics Editor.
4. Input data into the x-column.
- 12345678910
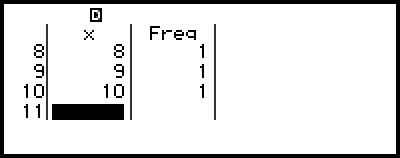
5. Input data into the Freq column.
- 2222342
6. Press .
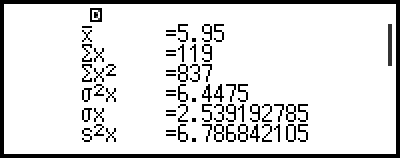
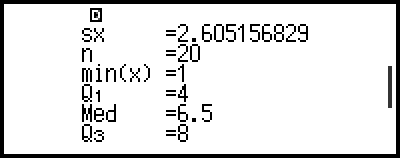
7. Select [1-Var Results], and then press .
This displays the 1-Var Results screen.
- (or
 )
) 
- (or )

For the meanings of the variables shown on the 1-Var Results screen, see the "List of Statistical Value Variables and Statistical Calculation Functions".
8. Press or to return to the Statistics Editor.
Displaying Paired-Variable Statistical Calculation Results
The 2-Var Results screen shows a list of various statistical values (such as mean and population standard deviation) calculated based on paired-variable data. This section describes the operation required to display the 2-Var Results screen.
Example 4: To input the data below and display paired-variable statistical calculation results
| x | 1.0 | 1.2 | 1.5 | 1.6 | 1.9 | 2.1 | 2.4 | 2.5 | 2.7 | 3.0 |
| y | 1.0 | 1.1 | 1.2 | 1.3 | 1.4 | 1.5 | 1.6 | 1.7 | 1.8 | 2.0 |
1. Press , select the Statistics app icon, and then press .
2. Select [2-Variable], and then press .
This displays the Statistics Editor.
3. Input data into the x-column.
- 11
 2151619
212425273 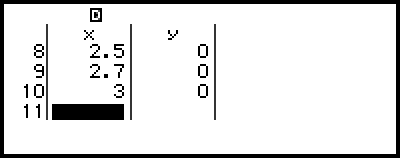
4. Input data into the y-column.
- 111121314
151617182 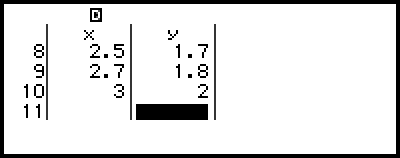
5. Press .

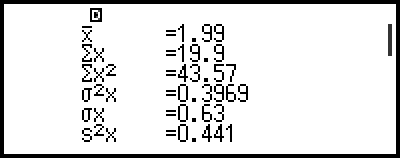
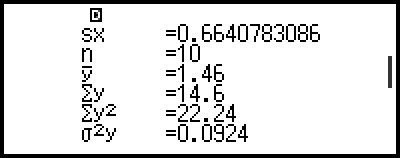
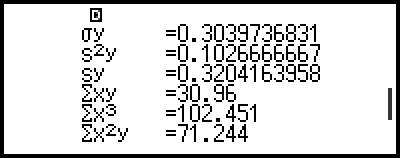
6. Select [2-Var Results], and then press .
This displays the 2-Var Results screen.
- (or )
- (or )
- (or )
For the meanings of the variables shown on the 2-Var Results screen, see the "List of Statistical Value Variables and Statistical Calculation Functions".
7. Press or to return to the Statistics Editor.
Displaying Regression Calculation Results
The Reg Results screen displays a list of regression calculation results (coefficients of regression equations) based on paired-variable data. This section describes the operation required to display the Reg Results screen.
Example 5: To use the paired-variable data input in Example 4 and display the results of the two regression calculations shown below
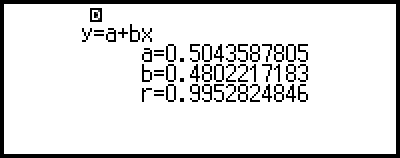
The regression equation "y = a + bx" coefficients (a, b), and the correlation coefficient (r) when linear regression is performed on the data
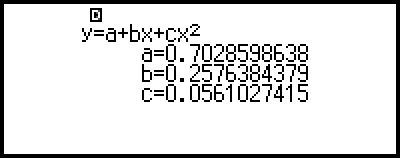
The regression equation "y = a + bx + cx2" coefficients (a, b, c) when quadratic regression is performed on the data
Note
For information about regression calculation types supported by the Statistics app, see the "Supported Regression Type List".
1. Perform steps 1 through 5 of the procedure under Example 4.
2. Select [Reg Results], and then press .
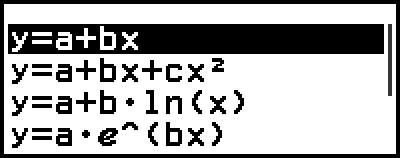
This displays the regression type menu.

3. Select [y=a+bx], and then press .
This displays the linear regression Reg Results screen.
4. Press or to return to the Statistics Editor.
5. Press , and then select [Reg Results] > [y=a+bx+cx2].
This displays quadratic regression Reg Results screen.
6. Press or to return to the Statistics Editor.
For the meanings of the variables shown on the Reg Results screen, see the "List of Statistical Value Variables and Statistical Calculation Functions".
Supported Regression Type List
| Regression Type | Regression Equation (regression type menu item) |
|---|---|
| Linear Regression | y = a + bx |
| Quadratic Regression | y = a + bx + cx2 |
| Logarithmic Regression | y = a + b・ln(x) |
| e exponential Regression | y = a・e^(bx) |
| ab exponential Regression | y = a・b^x |
| Power Regression | y = a・x^b |
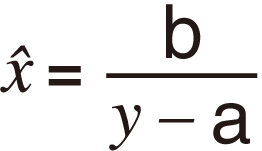
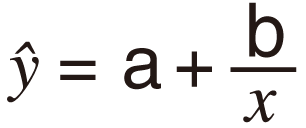
| Inverse Regression | y = a + b/x |
Using Statistical Calculation Screen
You can use the statistical calculation screen to recall individual statistical values and use the values in calculations.

Screen without calculation expression input
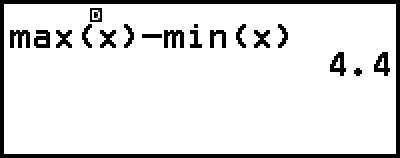
Example calculation
To recall a statistical value, use a variable representing the statistical value you want to recall (for example, x mean: x, x population standard deviation: σx, x maximum value: max(x), and so on). For more information about these variables, see the "List of Statistical Value Variables and Statistical Calculation Functions".
Displaying a Statistical Calculation Screen
Single-variable
1. While the Statistics Editor is displayed, press .
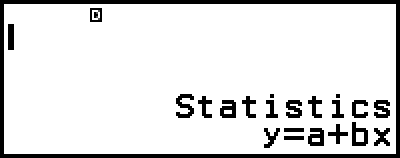
2. On the menu that appears, select [Statistics Calc] and then press .

Paired-variable
1. While the Statistics Editor is displayed, press .
2. On the menu that appears, select [Statistics Calc] and then press .
This displays the regression type menu (see the "Supported Regression Type List").

3. On the menu, select the regression type you want and then press .

In the example above, use the displayed menu to select [y=a+bx] (Linear regression).
To return to the Statistics Editor from a statistical calculation screen
Press , and then .
Calculation Example Using the Statistical Calculation Screen
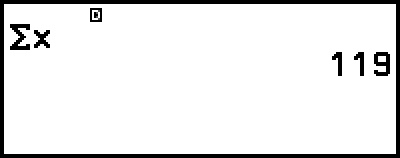
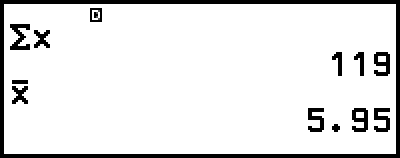
Example 6: To determine the sum of the sample data (Σx) and mean (x) of the single-variable data input in Example 3
1. Perform steps 1 through 6 of the procedure under Example 3.
2. Select [Statistics Calc], and then press .

3. Calculate the sum of the sample data (Σx).
 – [Statistics] > [Summation] > [Σx]
4. Calculate the mean (x).
- – [Statistics] >
[Mean/Var/Dev...] > [x]
Note
To display the 1-Var Results screen from the statistical calculation screen above, press and then select [1-Var Results].
To return to the statistical calculation screen from the 1-Var Results screen, press or .
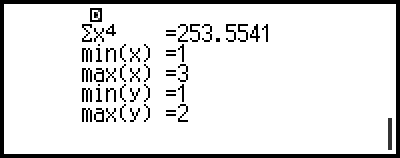
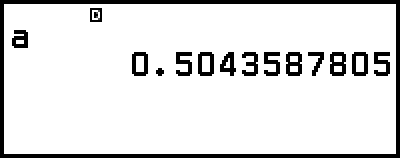
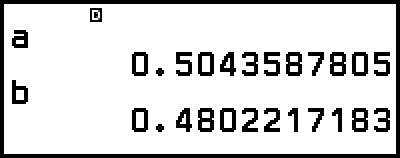
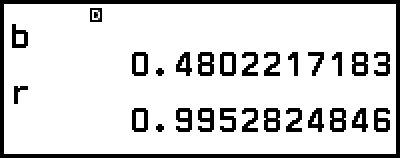
Example 7: To determine the coefficients (a, b) and correlation coefficient (r) of the linear regression equation "y = a + bx" based on the paired-variable data input in Example 4
1. Perform steps 1 through 5 of the procedure under Example 4.
2. Select [Statistics Calc], and then press .
This displays the regression type menu.

3. Select [y=a+bx], and then press .

4. Determine the coefficients (a, b) and correlation coefficient (r) of the regression equation "y = a + bx".
- – [Statistics] > [Regression] > [a]
- – [Statistics] > [Regression] > [b]
- – [Statistics] > [Regression] > [r]
To select a different regression type, press and then select [Select Reg Type]. This displays the regression type menu from step 2.
To display the 2-Var Results screen from a statistical calculation screen
Press and then select [2-Var Results].
To display the Reg Results screen from a statistical calculation screen
Press and then select [Reg Results].
List of Statistical Value Variables and Statistical Calculation Functions
You can use the CATALOG menu to recall variables representing statistical values and functions used for statistical calculations.
Note
For single-variable statistical calculations, the variables marked with an asterisk (*) are available.
For the calculation formula used for each variable and command, see "Statistical Calculation Formula".
– [Statistics] > [Summation]
Σx*, Σy ...... sum of the sample data
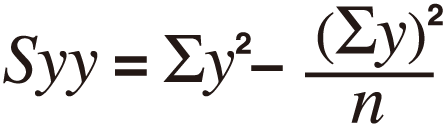
Σx2*, Σy2 ...... sum of squares of the sample data
Σxy ...... sum of products of the x-data and y-data
Σx3 ...... sum of cubes of the x-data
Σx2y ...... sum of (x-data squares × y-data)
Σx4 ...... sum of biquadrate of the x-data
– [Statistics] > [Mean/Var/Dev...]
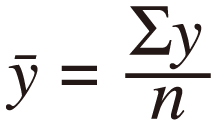
x*, y ...... mean
σ2x*, σ2y ...... population variance
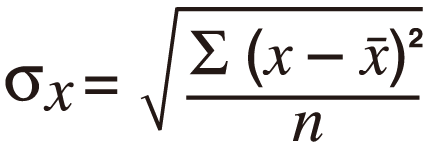
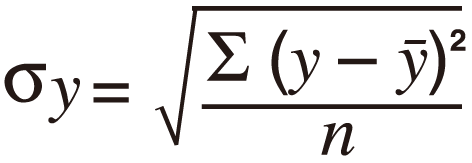
σx*, σy ...... population standard deviation
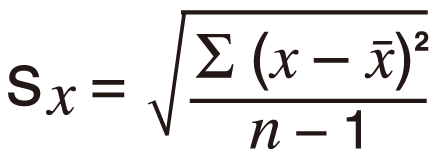
s2x*, s2y ...... sample variance
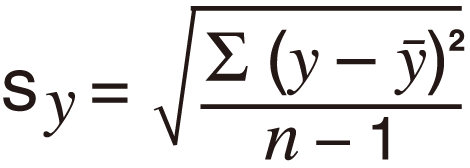
sx*, sy ...... sample standard deviation
n* ...... number of items
– [Statistics] > [Min/Max/Quartile] (Single-Variable Data Only)
min(x)* ...... minimum value
Q1* ...... first quartile
Med* ...... median
Q3* ...... third quartile
max(x)* ...... maximum value
– [Statistics] > [Norm Dist] (Single-Variable Data Only)
P(*, Q(*, R(*,  t* ...... Functions for executing normal distribution calculations. For more information about these functions, see "Performing Normal Distribution Calculations (Single-Variable Data Only)".
– [Statistics] > [Min/Max] (Paired-Variable Data Only)
min(x), min(y) ...... minimum value
max(x), max(y) ...... maximum value
– [Statistics] > [Regression] (Paired-Variable Data Only)
For quadratic regression
a, b, c ...... regression coefficients for quadratic regression
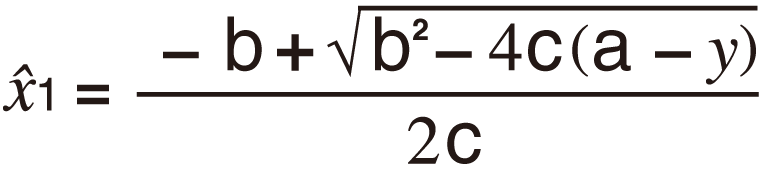
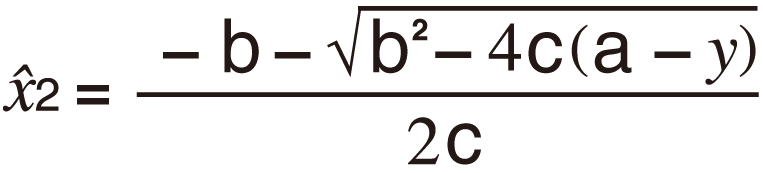
xˆ1, xˆ2 ...... Functions for determining x1 and x2 estimated values for an input y-value. For the argument, input the value of y immediately before the xˆ1 or xˆ2 function.
yˆ ...... Function for determining the y estimated value for an input x-value. For the argument, input the value of x immediately before this function.
For non-quadratic regression
a, b ...... regression coefficients
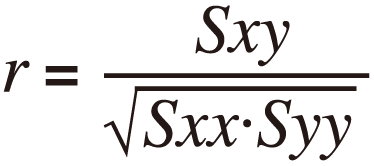
r ...... correlation coefficient
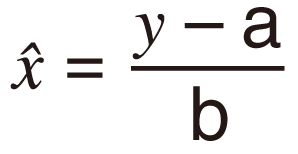
xˆ ...... Function for determining x estimated value for an input y-value. For the argument, input the value of y immediately before this function.
yˆ ...... Function for determining the y estimated value for an input x-value. For the argument, input the value of x immediately before this function.
For an example of the operation to determine estimated values, see "Calculating Estimated Values (Paired-Variable Data Only)".
Performing Normal Distribution Calculations (Single-Variable Data Only)
While single-variable statistical calculation is selected, you can perform normal distribution calculation using the functions shown below from the menu that appears when you press and then select [Statistics] > [Norm Dist].
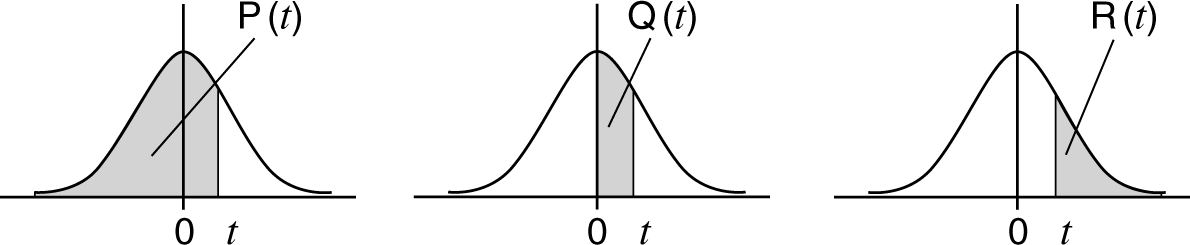
P(, Q(, R( ... These functions take the argument t and determine a probability of standard normal distribution as illustrated below.
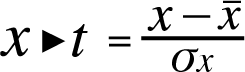
t ...... This function is preceded by the argument x. It calculates the standard variate for data value x using the mean value (x) and population standard deviation (σx) of data input with the Statistics Editor.
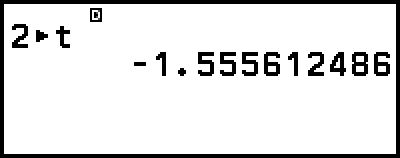
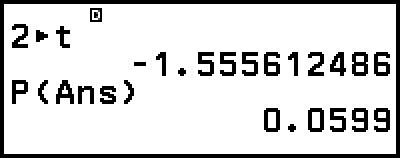
Example 8: For the single-variable data input in Example 3, determine the normalized variate when x = 2, and P(t) at that point.
1. Perform steps 1 through 6 of the procedure under Example 3.
2. Select [Statistics Calc], and then press .

3. Calculate the normalized variate when x = 2.
- 2
– [Statistics] > [Norm Dist] > [t]
4. Calculate P(t).
- – [Statistics] > [Norm Dist] > [P(]


Calculating Estimated Values (Paired-Variable Data Only)
Based on the regression equation obtained by paired-variable statistical calculation, the estimated value of y can be calculated for a given x-value. The corresponding x-value (two values, x1 and x2, in the case of quadratic regression) also can be calculated for a value of y in the regression equation.
Example 9: To determine the estimated value for y when x = 5.5 in the regression equation produced by linear regression of the data input in Example 4
1. Perform steps 1 through 5 of the procedure under Example 4.
2. Select [Statistics Calc], and then press .
This displays the regression type menu.
3. Select [y=a+bx], and then press .
4. Input the x-value (5.5), and then input "yˆ", which is the function to determine the estimated value of y.
- 55
– [Statistics] > [Regression] > [yˆ] 
5. Press .

Statistical Calculation Formula
Single-Variable Statistical Calculation Formula
![]()
Paired-Variable Statistical Calculation Formula
![]()
Regression Calculation Formula
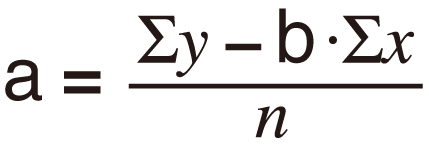
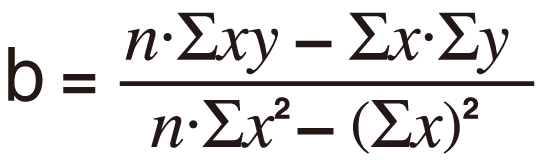
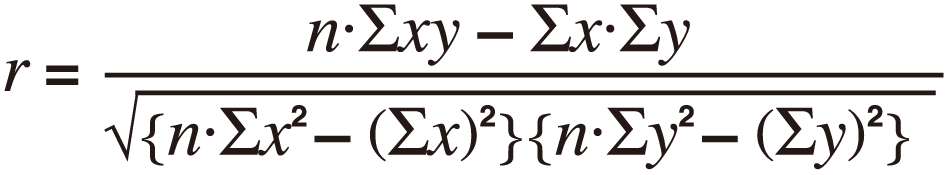
Linear Regression (y = a + bx)

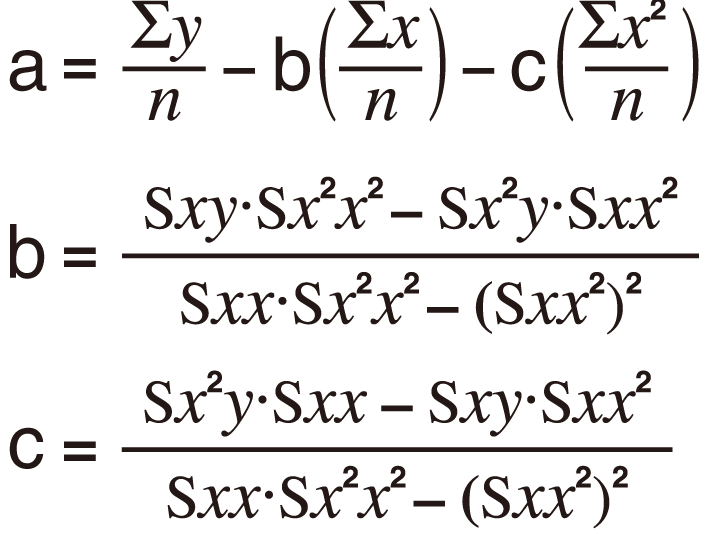
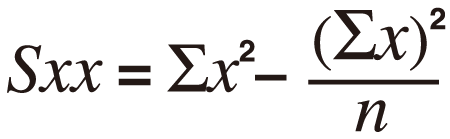
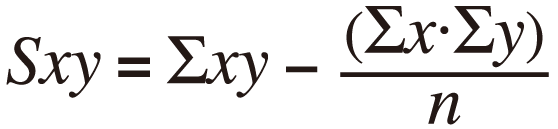
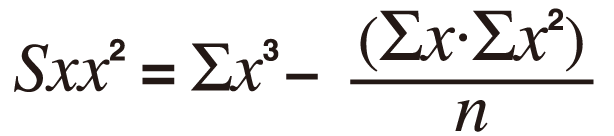
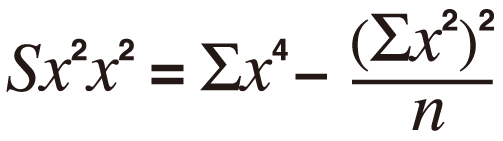
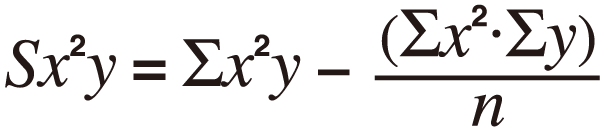
Quadratic Regression (y = a + bx + cx2)

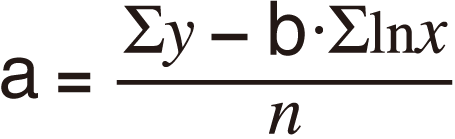
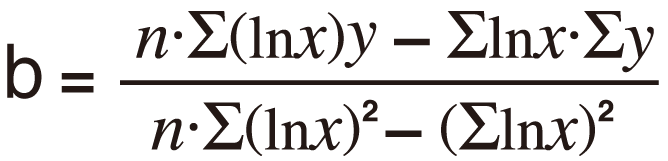
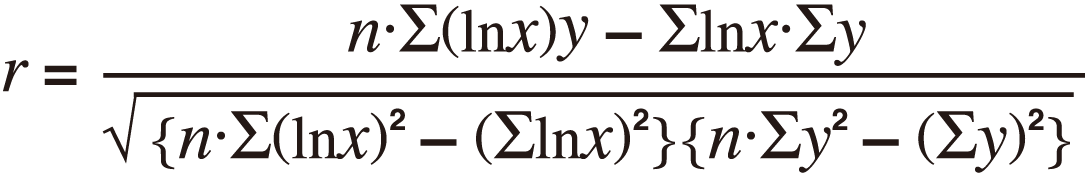
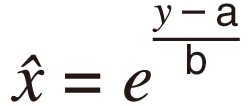
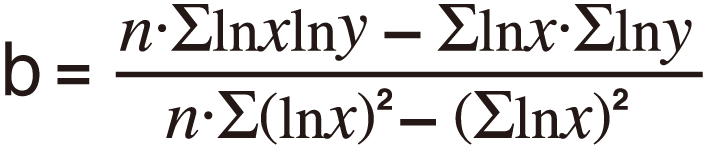
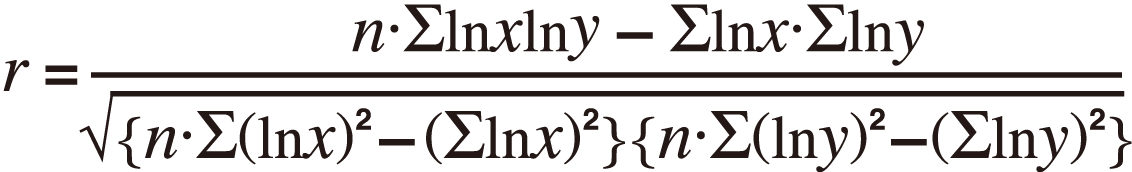
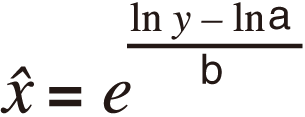
Logarithmic Regression (y = a + b・ln(x))

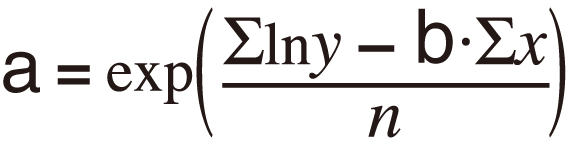
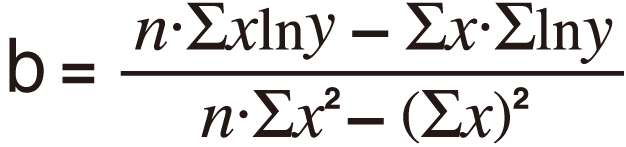
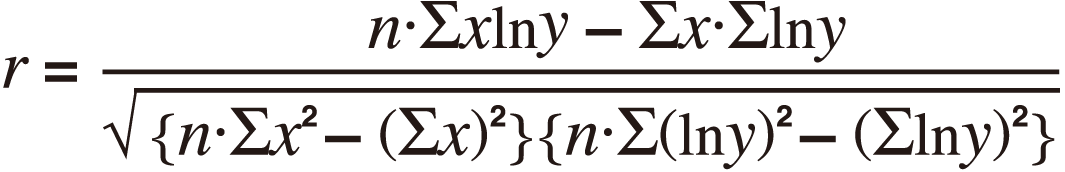
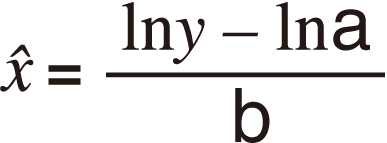
e Exponential Regression (y = a・e^(bx))

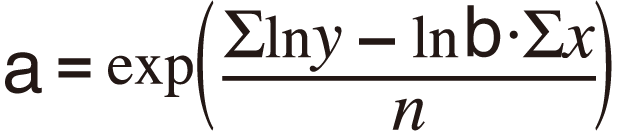
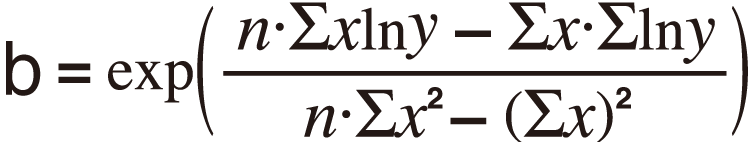
ab Exponential Regression (y = a・b^x)
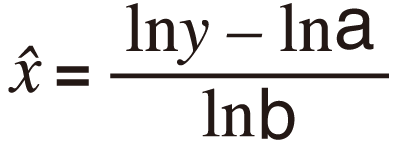

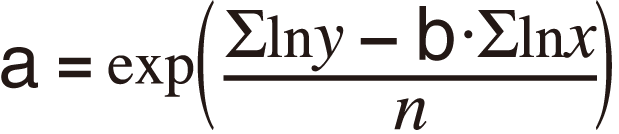
Power Regression (y = a・x^b)

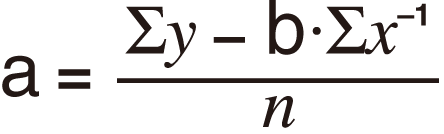
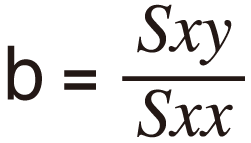
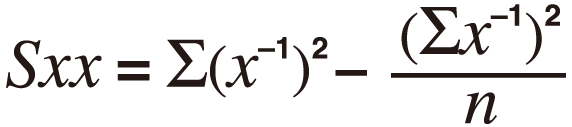
Inverse Regression (y = a + b/x)